In the fast-paced world of event management, success depends on precision, planning, and performance. From marketing and budgeting to logistics and guest satisfaction, every detail counts. But without proper tracking, it’s nearly impossible to measure what’s working and what’s not.
That’s where the Event Management KPI Scorecard in Excel comes into play. This ready-to-use Excel template helps event professionals monitor, analyze, and visualize performance using measurable Key Performance Indicators (KPIs). It transforms complex event data into clear, actionable insights — ensuring every event meets its goals efficiently and effectively.
Click to Purchases Event Management KPI Scorecard in Excel
What Is an Event Management KPI Scorecard in Excel?
An Event Management KPI Scorecard is an Excel-based tool designed to track the critical metrics that define event success. It helps planners, coordinators, and managers evaluate their event performance in terms of cost, attendance, satisfaction, ROI, and operational efficiency.
Using Excel for KPI management allows flexibility, affordability, and ease of use. With built-in formulas, charts, and conditional formatting, event managers can visualize performance trends and make quick, data-driven decisions — without the need for expensive software.
In short, this scorecard becomes your one-stop solution for analyzing the effectiveness of your event planning and execution.
Click to Purchases Event Management KPI Scorecard in Excel
Why Event Managers Need a KPI Scorecard
Event management involves multiple moving parts — vendors, budgets, marketing, registrations, and feedback. Without centralized performance tracking, it’s easy to lose sight of objectives.
The Event Management KPI Scorecard solves this problem by offering a structured, visual approach to measure success. It enables event teams to:
-
Track KPIs for budget adherence, attendance, and engagement.
-
Compare actual results versus targets.
-
Identify trends and improvement areas.
-
Monitor performance over time with MTD (Month-to-Date) and YTD (Year-to-Date) analysis.
-
Make informed, data-backed decisions.
With this tool, you don’t just plan events — you optimize them for measurable results.
Key Features of the Event Management KPI Scorecard in Excel
This professionally designed scorecard template comes with four key worksheets, each serving a unique purpose for comprehensive performance tracking.
1️⃣ Scorecard Sheet
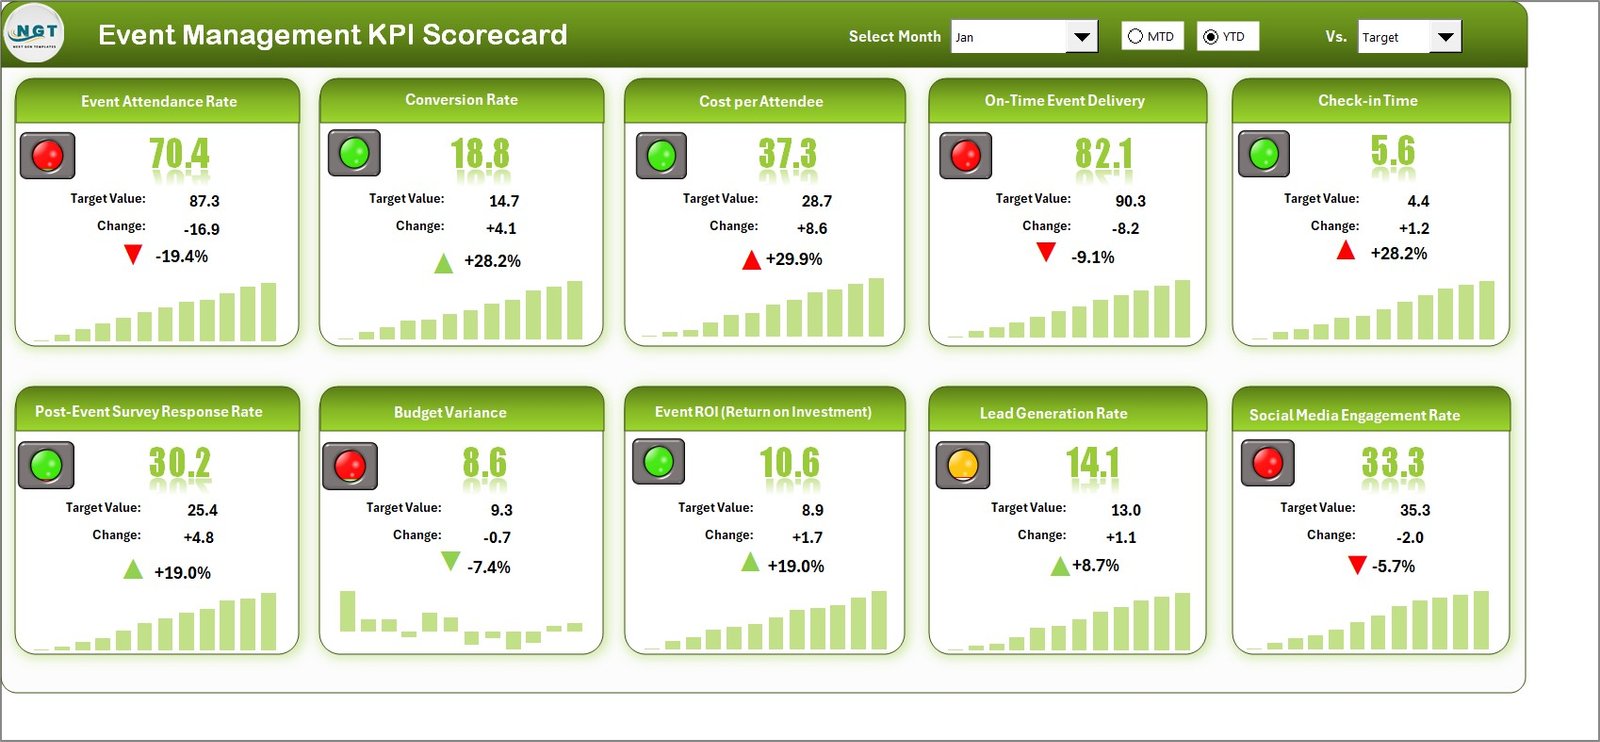
The Scorecard Sheet is the main dashboard of the template. It provides a high-level overview of your KPIs, allowing you to evaluate how your event strategies are performing.
Key features include:
-
Dropdown Menus: Easily select the month and choose between MTD or YTD for deeper analysis.
-
Actual vs Target Comparison: See instantly whether performance meets or misses expectations.
-
Visual Indicators: Color-coded conditional formatting (green for success, red for underperformance) makes analysis intuitive.
-
Comprehensive KPI Overview: View multiple KPIs at once — such as cost efficiency, attendance, and satisfaction — for a quick snapshot of event health.
The Scorecard Sheet is your command center, helping you prepare reports, share updates with stakeholders, and guide your event strategy effectively.
2️⃣ KPI Trend Sheet
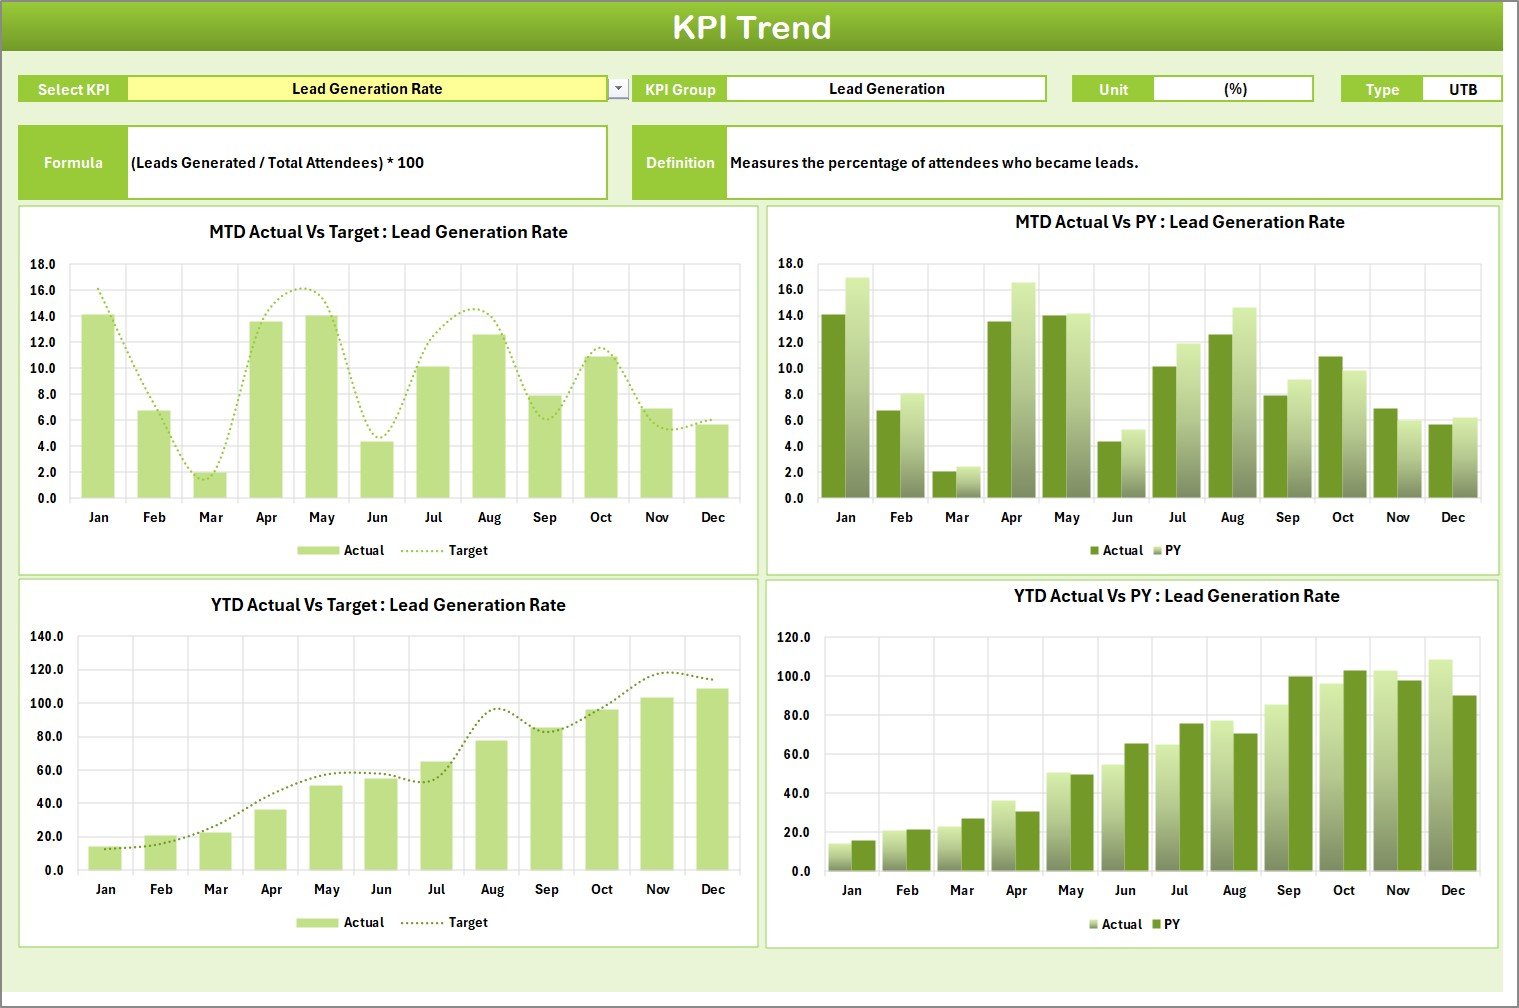
The KPI Trend Sheet is where you dive into detailed analytics for each KPI. By selecting a KPI name from the dropdown (available in cell C3), you can visualize how that metric performed over time.
Key components of this sheet:
-
KPI Details Section: Displays KPI Group, Unit, Type (LTB – Lower the Better or UTB – Upper the Better), Formula, and Definition.
-
Dynamic Charts: Automatically generated MTD and YTD trend charts show Actual, Target, and Previous Year (PY) data.
-
Trend Visualization: Spot upward or downward trends quickly to assess performance consistency.
This sheet gives you a deeper understanding of how your KPIs evolve throughout the event season, helping you fine-tune strategies for better results.
3️⃣ Input Data Sheet
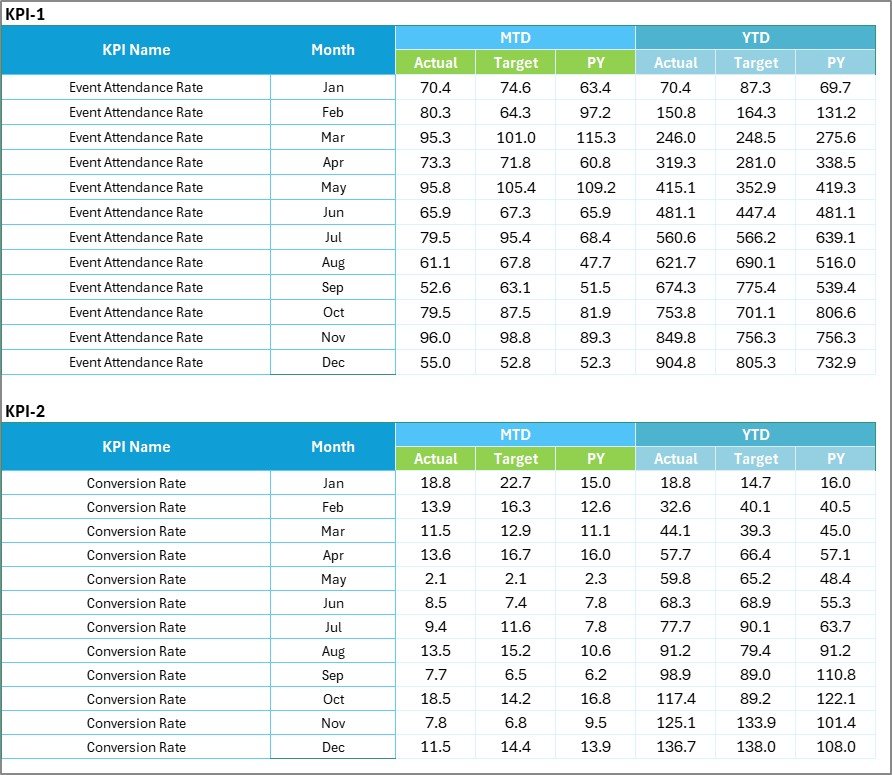
The Input Data Sheet is the data engine of your scorecard. It’s where you record all KPI data — actuals, targets, and previous year numbers.
Features include:
-
Data Entry Columns: Enter key details like KPI name, month, actual value, target, and PY data.
-
Ease of Update: Quickly add new event results to keep your scorecard current.
-
Automatic Updates: Once data is entered, all linked sheets (Scorecard and Trend) update automatically.
This sheet ensures all performance data remains accurate, organized, and easily traceable for future analysis.
4️⃣ KPI Definition Sheet
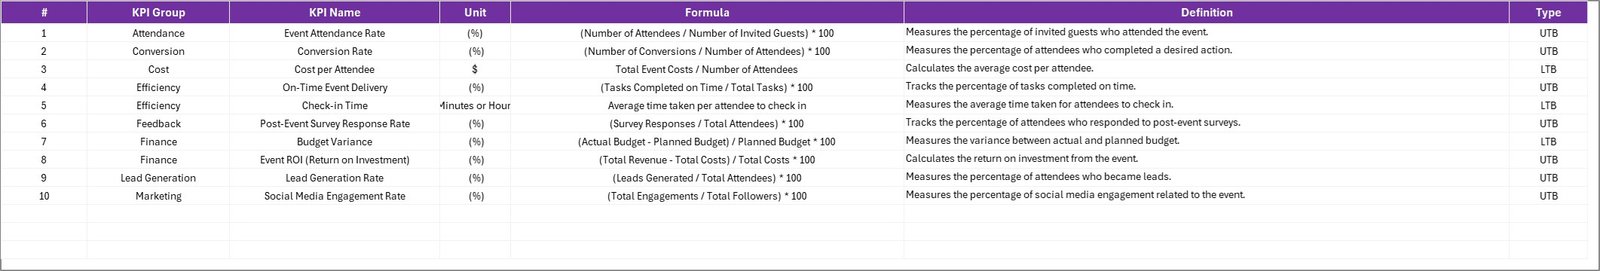
Every metric should be clearly defined — and that’s the purpose of the KPI Definition Sheet.
This sheet includes columns for:
-
KPI Name
-
KPI Group (e.g., Marketing, Operations, Finance, Customer Experience)
-
Unit of Measurement
-
Formula
-
Definition
By documenting every KPI, this sheet eliminates ambiguity and ensures consistency across reporting. Everyone in the organization can interpret KPIs in the same way.
Click to Purchases Event Management KPI Scorecard in Excel
Example KPIs for Event Management
When setting up your Event Management KPI Scorecard, you can customize it with metrics that matter most to your goals. Here are some example KPIs grouped by category:
🎯 Marketing KPIs
-
Event Reach (Number of people reached through promotions)
-
Conversion Rate (Registrations ÷ Total Leads)
-
Social Media Engagement (%)
-
Website Visits Before Event
💰 Financial KPIs
-
Budget Variance (%)
-
Sponsorship Revenue
-
Cost per Attendee
-
ROI (Return on Investment)
👥 Operational KPIs
-
On-Time Task Completion (%)
-
Vendor Performance Score
-
Resource Utilization (%)
-
Event Setup Time (Hours)
💬 Customer Experience KPIs
-
Attendee Satisfaction Score (1–10)
-
Post-Event Feedback Response Rate (%)
-
Repeat Attendance Rate
-
Net Promoter Score (NPS)
These KPIs provide a well-rounded view of your event performance, covering everything from marketing impact to attendee experience.
How to Use the Event Management KPI Scorecard in Excel
Getting started with this template is simple. Follow these practical steps:
-
List Your KPIs: Identify measurable indicators aligned with your event goals.
-
Define Each KPI: Enter formulas and definitions in the KPI Definition sheet.
-
Set Targets: Add monthly and yearly target values for each KPI.
-
Enter Actual Data: Record real-time or post-event results in the Input Data sheet.
-
Analyze the Scorecard: Use the Scorecard sheet to compare Actual vs Target.
-
Review Trends: Examine the KPI Trend sheet to identify long-term progress.
-
Take Action: Address underperforming areas and replicate successful strategies.
With consistent use, you’ll gain deep insights into your events’ effectiveness and efficiency.
Advantages of Using an Event Management KPI Scorecard in Excel
The benefits of this Excel scorecard extend far beyond convenience. It helps event professionals transform data into a performance-driven strategy.
✅ 1. Real-Time Insights
Get instant visibility into how your event is performing — before, during, and after execution.
✅ 2. Improved Decision-Making
By comparing targets with actuals, you can make evidence-based decisions instead of assumptions.
✅ 3. Time-Saving Automation
Automated formulas and visuals eliminate the need for manual calculations and complex reporting.
✅ 4. Enhanced Accountability
Each department (marketing, logistics, finance) can see its KPIs, promoting responsibility and collaboration.
✅ 5. Customization Flexibility
Modify the KPIs, colors, and layouts to match your event type — conferences, weddings, corporate seminars, or exhibitions.
✅ 6. Cost-Effective Solution
Unlike expensive event analytics tools, this Excel scorecard provides similar insights at no extra cost.
Best Practices for the Event Management KPI Scorecard
To make the most of your KPI scorecard, follow these best practices:
🧭 Align KPIs with Event Goals: Each KPI should reflect an important business or event objective.
📊 Keep It Simple: Focus on quality KPIs rather than quantity.
🗓️ Update Regularly: Enter data consistently to keep reports accurate.
🎨 Use Visuals Wisely: Leverage color codes and charts to improve readability.
📈 Analyze Both MTD and YTD Trends: This helps in understanding short-term performance and long-term progress.
👥 Collaborate Across Teams: Ensure marketing, finance, and logistics teams contribute accurate data.
🕵️ Review Post-Event Results: After each event, review insights to improve future performance.
Adopting these practices will turn your Excel scorecard into a strategic decision-making tool.
Click to Purchases Event Management KPI Scorecard in Excel
How Excel Enhances Event KPI Tracking
Excel remains one of the most reliable tools for KPI management, especially for event professionals. Here’s why:
-
User-Friendly Interface: No need for advanced technical skills.
-
Highly Customizable: Adjust layout, visuals, and metrics easily.
-
Data Security: Protect sheets with passwords and manage access control.
-
Integration Ready: Compatible with other tools like Google Forms, SurveyMonkey, or CRM exports.
-
Dynamic Analysis: Pivot tables and slicers allow interactive filtering and deep analysis.
Excel’s versatility makes it perfect for organizations of any size — from small event planners to large corporations hosting international conferences.
Common Mistakes to Avoid
Even with a great scorecard, certain mistakes can reduce effectiveness. Avoid these pitfalls:
❌ Tracking too many KPIs without clear purpose.
❌ Not defining KPI formulas or units clearly.
❌ Ignoring monthly updates and trend reviews.
❌ Setting unrealistic targets.
❌ Neglecting post-event analysis.
By steering clear of these errors, your KPI scorecard will remain accurate, reliable, and meaningful.
How This Scorecard Boosts Event Performance
The Event Management KPI Scorecard in Excel bridges the gap between planning and performance. Here’s how it adds value:
-
Before the Event: Helps set realistic goals and prepare benchmarks.
-
During the Event: Monitors live performance indicators like check-ins, response rates, or expenses.
-
After the Event: Evaluates success and identifies lessons for future improvements.
In essence, it’s not just a reporting tool — it’s a roadmap for continuous event excellence.
Conclusion
The Event Management KPI Scorecard in Excel is a must-have tool for professionals who aim to elevate event performance through data-driven insights.
With four structured sheets — Scorecard, KPI Trend, Input Data, and KPI Definition — it offers everything you need to measure success, identify trends, and enhance efficiency. Whether you’re managing corporate events, weddings, trade shows, or fundraisers, this Excel scorecard ensures your efforts translate into measurable results.
Empower your event strategy today with the clarity and precision of the Event Management KPI Scorecard in Excel — because successful events don’t happen by chance; they’re managed by data.
Click to Purchases Event Management KPI Scorecard in Excel
Frequently Asked Questions (FAQs)
1. What is an Event Management KPI Scorecard?
It’s an Excel-based performance tracking tool used to monitor key event metrics such as attendance, cost, satisfaction, and ROI.
2. Why use Excel for tracking event KPIs?
Excel offers flexibility, automation, and visual analysis features — making it ideal for small and medium-sized event teams.
3. What types of KPIs can I track?
You can track financial, marketing, operational, and attendee-related KPIs, including budget variance, NPS, and engagement rates.
4. How often should I update my KPI data?
Ideally, update it after every major event or monthly for ongoing campaigns to ensure reports stay accurate.
5. Can this scorecard handle multiple events?
Yes, you can duplicate sheets or create new tabs to track multiple events across the year.
6. Is this scorecard customizable?
Absolutely. You can modify KPIs, formulas, visuals, and colors to suit your organization’s requirements.
7. Does it support collaboration?
Yes. When shared through cloud platforms like OneDrive or Google Drive, multiple users can update and view data in real time.
Click to Purchases Event Management KPI Scorecard in Excel
Visit our YouTube channel to learn step-by-step video tutorials