Recruitment leaders, staffing agencies, and executive search firms face constant pressure to deliver faster placements, maintain high client satisfaction, and control operational delays. However, when teams rely on scattered spreadsheets and manual reports, decision-making slows down and errors increase.
That is exactly where an Executive Search and Staffing Dashboard in Excel creates a powerful difference.
In this detailed guide, you will learn what an Executive Search and Staffing Dashboard in Excel is, why it matters, how it works, its key features, advantages, best practices, and frequently asked questions. You will also understand how this ready-to-use Excel dashboard simplifies recruitment analytics while improving transparency and performance.
Click to Purchases Executive Search and Staffing Dashboard in Excel
What Is an Executive Search and Staffing Dashboard in Excel?
An Executive Search and Staffing Dashboard in Excel is a centralized analytical tool that tracks and visualizes recruitment performance metrics in a single interactive interface. Instead of working with multiple disconnected sheets, recruiters and leaders can monitor search progress, client satisfaction, closure timelines, and revenue values in real time.
This dashboard converts raw recruitment data into clear charts, KPIs, and trends that support smarter decisions. Because Excel powers the dashboard, users can easily update data, customize metrics, and share insights without advanced technical skills.
More importantly, this dashboard helps executive search firms answer critical questions such as:
-
Which industries generate the highest search fee value?
-
How fast do teams close executive searches?
-
Which candidate sources deliver the best results?
-
Where do cancellations increase, and why?
Why Do Executive Search Firms Need a Staffing Dashboard?
Executive search firms operate in a highly competitive and relationship-driven market. Every delayed closure, unhappy client, or cancelled search directly impacts revenue and reputation. Therefore, firms need data-driven visibility across every stage of recruitment.
An Executive Search and Staffing Dashboard in Excel helps because it:
-
Centralizes recruitment data in one place
-
Highlights performance gaps instantly
-
Tracks SLA compliance and closure efficiency
-
Improves client satisfaction through insights
-
Supports leadership-level decision-making
Instead of reacting to problems late, recruitment teams can act early and stay ahead.
How Does the Executive Search and Staffing Dashboard in Excel Work?
This dashboard works by connecting structured recruitment data to pre-built Excel charts and metrics. Once users update the data sheet, the entire dashboard refreshes automatically.
The dashboard includes five analytical pages, each focused on a specific recruitment dimension. A page navigator placed on the left side allows seamless movement between views. Right-side slicers help users filter insights by region, industry, position level, candidate source, or month.
As a result, users gain instant access to both high-level summaries and deep operational insights.
What Are the Key Features of the Executive Search and Staffing Dashboard in Excel?
This ready-to-use dashboard includes thoughtfully designed features that support recruitment analytics and leadership reporting.
Page Navigator for Easy Navigation
The dashboard includes a page navigator on the left side, which allows users to jump quickly between analytical pages. This design saves time and improves usability, especially during presentations and reviews.
Interactive Slicers for Dynamic Analysis
Each page includes right-side slicers that allow filtering by key recruitment dimensions. Users can instantly adjust insights without changing formulas or layouts.
Five Dedicated Analytical Pages
The dashboard includes five structured pages, each delivering focused insights.
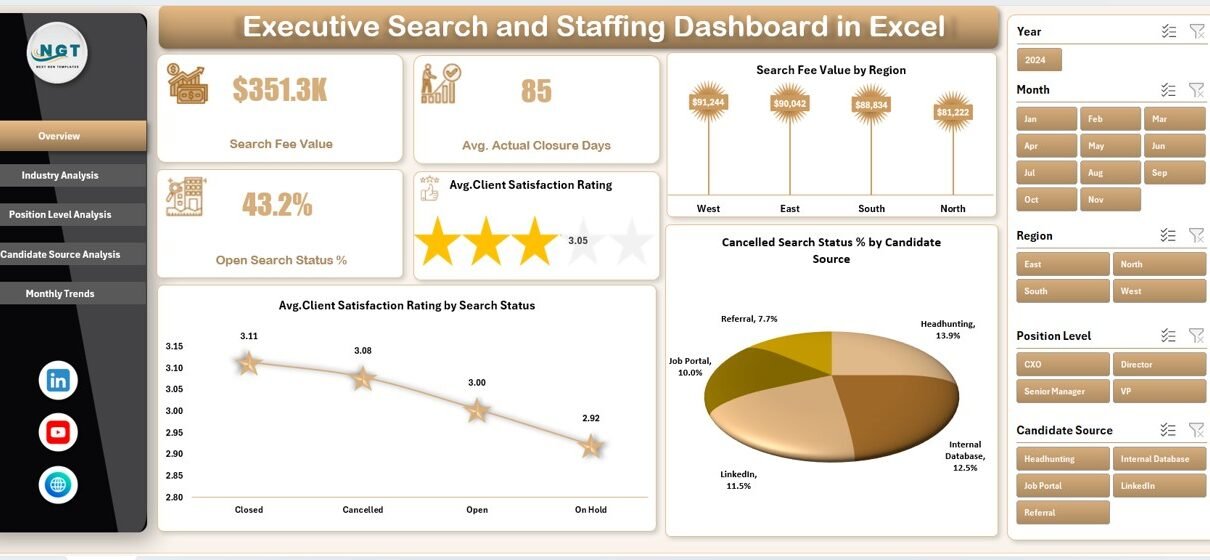
What Insights Does the Overview Page Provide?
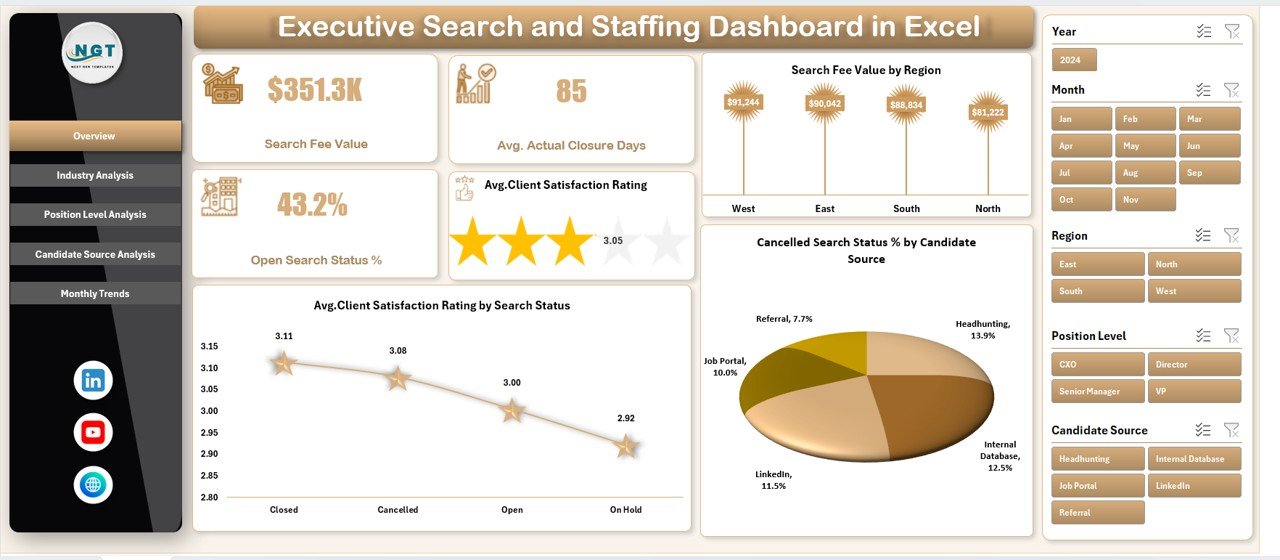
The Overview Page acts as the control center of the dashboard. It summarizes overall recruitment performance and highlights key trends.
Key Metrics and Charts on the Overview Page
This page includes four important charts:
-
Search Fee Value by Region
This chart shows how revenue distributes across regions. Leaders can identify top-performing markets and growth opportunities. -
Average Client Satisfaction Rating by Search Status
This metric reveals how satisfaction varies across open, closed, or cancelled searches. -
Cancelled Search Status % by Candidate Source
This view highlights which candidate sources contribute to higher cancellation risks. -
KPI Cards for Quick Insights
The page also displays four KPI cards that offer instant performance snapshots.
Because this page delivers a high-level view, leadership teams often start every review here.
How Does Industry Analysis Improve Recruitment Strategy?
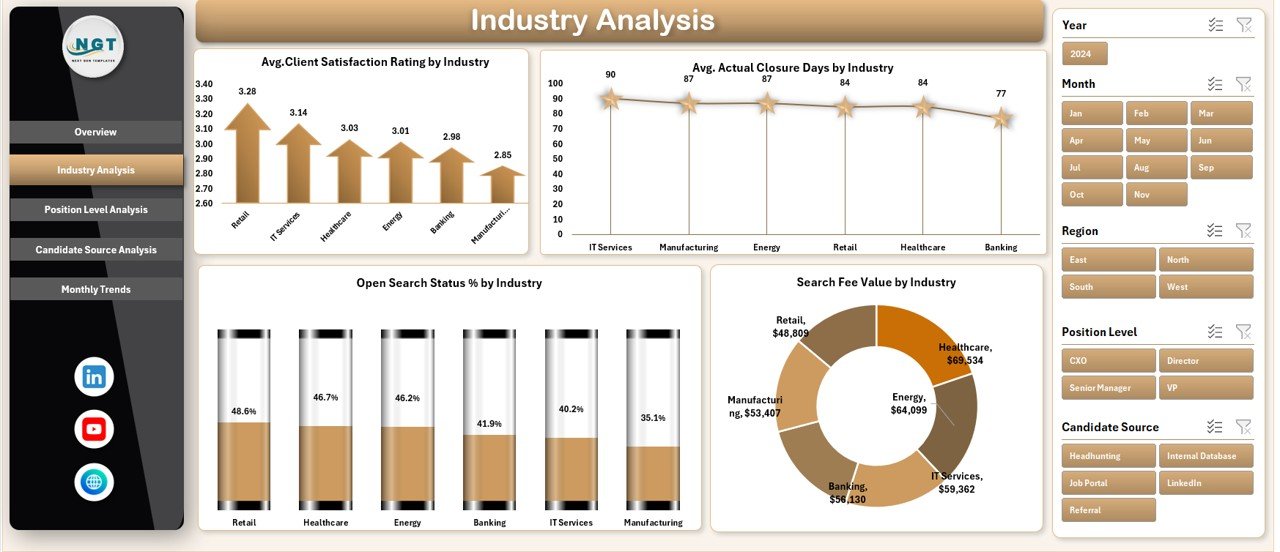
The Industry Analysis Page helps firms understand how recruitment performance varies across industries.
Key Charts in Industry Analysis
This page includes four powerful charts:
-
Average Client Satisfaction Rating by Industry
This chart shows which industries experience stronger client relationships. -
Average Actual Closure Days by Industry
This insight helps teams identify industries that require longer search cycles. -
Open Search Status % by Industry
This metric highlights workload distribution and pipeline pressure. -
Search Fee Value by Industry
This chart reveals the most profitable industry segments.
By using this page, firms can align consultants, pricing strategies, and resources with industry-specific realities.
Click to Purchases Executive Search and Staffing Dashboard in Excel
Why Is Position Level Analysis Critical for Executive Search?
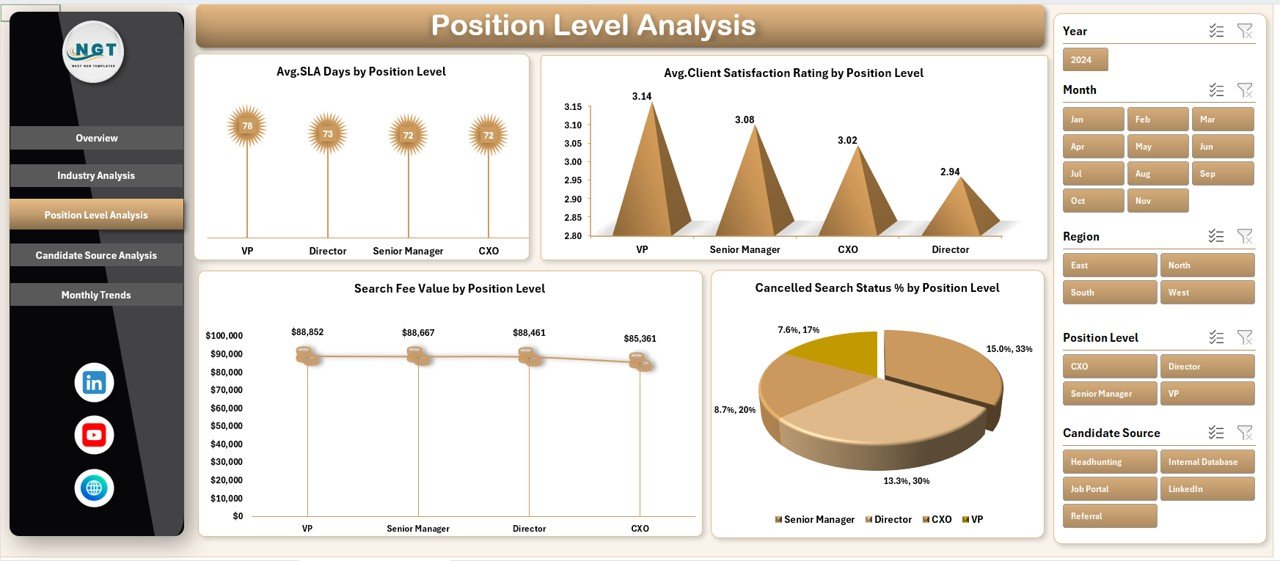
Different leadership levels require different recruitment approaches. Therefore, the Position Level Analysis Page focuses on performance across executive tiers.
Key Charts in Position Level Analysis
This page includes:
-
Average Client Satisfaction Rating by Position Level
This metric shows how satisfaction changes between senior, mid-level, and leadership roles. -
Average SLA Days by Position Level
This chart tracks service-level performance across roles. -
Search Fee Value by Position Level
This insight helps firms understand revenue distribution by hierarchy. -
Cancelled Search Status % by Position Level
This view highlights risk-prone position categories.
With these insights, firms can adjust expectations, timelines, and communication strategies by role level.
How Does Candidate Source Analysis Improve Hiring Outcomes?
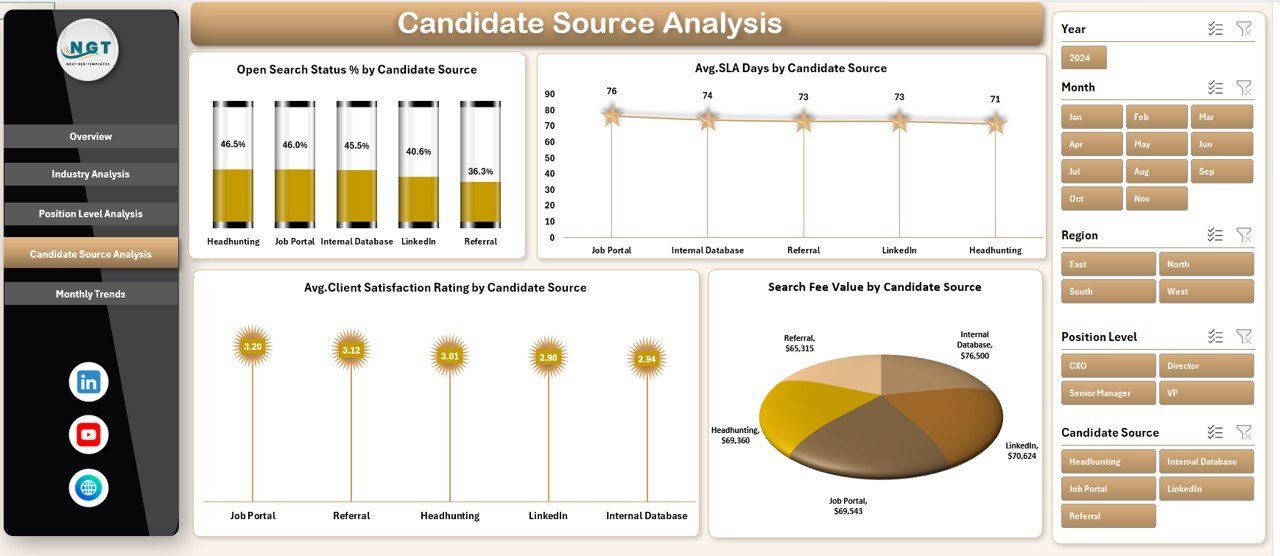
Candidate sourcing directly affects closure speed, satisfaction, and cancellation rates. The Candidate Source Analysis Page focuses on this critical dimension.
Key Charts in Candidate Source Analysis
This page includes four targeted charts:
-
Open Search Status % by Candidate Source
This chart shows which sources experience longer open durations. -
Average SLA Days by Candidate Source
This metric helps evaluate sourcing efficiency. -
Average Client Satisfaction Rating by Candidate Source
This insight links sourcing quality with client experience. -
Search Fee Value by Candidate Source
This chart highlights the most profitable sourcing channels.
As a result, recruitment teams can invest more in high-performing channels while reducing dependency on weaker ones.
Click to Purchases Executive Search and Staffing Dashboard in Excel
What Trends Does the Month Analysis Page Reveal?
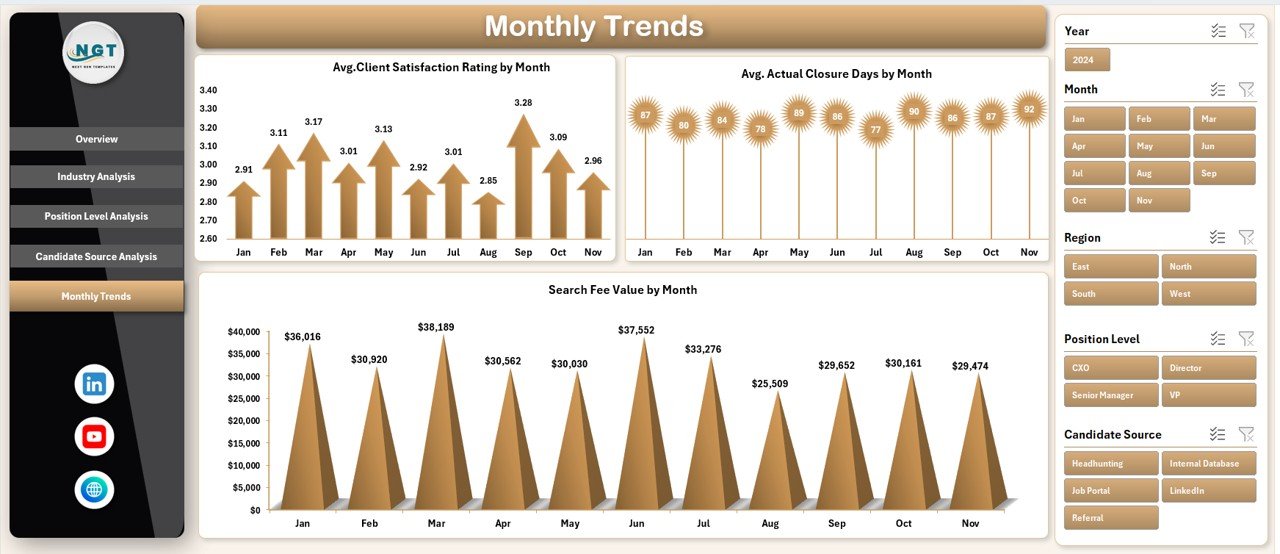
Recruitment performance often changes over time. The Month Analysis Page reveals seasonality and operational trends.
Key Charts in Month Analysis
This page includes:
-
Average Client Satisfaction Rating by Month
-
Average Actual Closure Days by Month
-
Search Fee Value by Month
These trends help firms forecast demand, manage recruiter capacity, and plan hiring campaigns more effectively.
What Supporting Sheets Power the Dashboard?
The dashboard includes support sheets and a structured data sheet. These sheets store raw recruitment data and mapping logic. Users only need to update the data sheet to refresh all visuals instantly.
This structure ensures accuracy, scalability, and ease of maintenance.
Advantages of the Executive Search and Staffing Dashboard in Excel
An Executive Search and Staffing Dashboard in Excel offers several practical advantages for recruitment teams and leadership.
Clear Visibility Across Recruitment Operations
The dashboard provides real-time visibility into search status, revenue, and satisfaction metrics.
Faster and Smarter Decision-Making
Because insights update instantly, leaders can respond quickly to risks and opportunities.
Improved Client Satisfaction Tracking
The dashboard links satisfaction scores with search status, industry, and sourcing strategy.
Better SLA and Closure Management
Teams can monitor delays, identify bottlenecks, and improve delivery timelines.
Cost-Effective and Easy to Use
Excel-based dashboards eliminate the need for expensive BI tools or complex training.
Click to Purchases Executive Search and Staffing Dashboard in Excel
Who Should Use an Executive Search and Staffing Dashboard in Excel?
This dashboard supports multiple stakeholders, including:
-
Executive search firms
-
Staffing and recruitment agencies
-
Recruitment managers and leaders
-
Talent acquisition teams
-
Business development heads
-
Operations and strategy teams
Because Excel powers the dashboard, both technical and non-technical users can use it confidently.
Best Practices for the Executive Search and Staffing Dashboard in Excel
To maximize value, teams should follow proven best practices.
Maintain Clean and Consistent Data
Accurate insights depend on structured and updated data.
Use Slicers During Reviews
Slicers help focus discussions on specific regions, industries, or roles.
Review KPIs Regularly
Frequent reviews prevent small issues from becoming major risks.
Align Metrics With Business Goals
Teams should track KPIs that directly support revenue, quality, and satisfaction.
Customize Charts When Needed
Excel allows easy customization to match firm-specific requirements.
How Does This Dashboard Support Long-Term Growth?
This dashboard does more than track performance. It supports strategic growth by:
-
Identifying high-margin industries
-
Improving recruiter productivity
-
Strengthening client relationships
-
Reducing cancellations
-
Enhancing forecasting accuracy
Over time, firms that rely on data-driven recruitment outperform competitors who depend on intuition alone.
Conclusion: Why Should You Use an Executive Search and Staffing Dashboard in Excel?
An Executive Search and Staffing Dashboard in Excel transforms recruitment data into actionable intelligence. It replaces guesswork with clarity and helps firms deliver faster, better, and more profitable search outcomes.
By centralizing metrics across overview, industry, position level, candidate source, and monthly trends, this dashboard empowers leaders to take control of recruitment performance. Moreover, because Excel drives the solution, teams enjoy flexibility, affordability, and ease of use.
If your firm wants stronger insights, better decisions, and higher client satisfaction, this dashboard offers a practical and proven solution.
Frequently Asked Questions About the Executive Search and Staffing Dashboard in Excel
What is the main purpose of an Executive Search and Staffing Dashboard in Excel?
The dashboard helps recruitment teams track performance, satisfaction, timelines, and revenue in one centralized view.
Can non-technical users use this dashboard?
Yes, Excel-based design ensures ease of use without advanced technical skills.
How often should teams update the data?
Teams should update data regularly, ideally weekly or monthly, to maintain accurate insights.
Can the dashboard support customization?
Yes, Excel allows full customization of charts, KPIs, and layouts.
Does this dashboard replace recruitment software?
No, it complements recruitment systems by turning raw data into visual insights.
Who benefits the most from this dashboard?
Executive search firms, staffing agencies, recruitment leaders, and talent acquisition teams benefit the most.
Visit our YouTube channel to learn step-by-step video tutorials