Hiring senior leaders and critical talent never works on guesswork. Every executive search firm and staffing agency faces pressure to close roles faster, improve client satisfaction, manage fees, and track search performance across industries and regions. However, when data stays scattered across spreadsheets and emails, recruiters lose visibility and control.
That is exactly why an Executive Search and Staffing Dashboard in Power BI becomes a powerful solution.
This article explains what an Executive Search and Staffing Dashboard in Power BI is, why it matters, how it works, its key features, advantages, best practices, and frequently asked questions. By the end, you will clearly understand how this dashboard helps recruitment leaders make faster, smarter, and more confident decisions.
Click to Purchases Executive Search and Staffing Dashboard in Power BI
What Is an Executive Search and Staffing Dashboard in Power BI?
An Executive Search and Staffing Dashboard in Power BI is a centralized analytics solution designed to track, monitor, and analyze recruitment performance metrics in real time.
Instead of manually reviewing multiple reports, recruiters and leadership teams can instantly see:
-
Search progress across industries and roles
-
Average SLA days for candidate placement
-
Open search status trends
-
Search fee value by region, industry, and source
-
Client satisfaction levels
Because Power BI connects all recruitment data into one visual interface, decision-makers always stay informed.
Why Do Executive Search Firms Need a Power BI Dashboard?
Executive hiring involves high stakes. Therefore, every delay, missed SLA, or unhappy client impacts revenue and reputation.
However, traditional tracking methods create problems such as:
-
Limited visibility into open search status
-
Difficulty tracking SLA performance
-
No clear view of fee contribution by industry or region
-
Inconsistent client satisfaction measurement
A Power BI staffing dashboard solves these challenges by converting raw recruitment data into meaningful insights.
As a result, recruitment leaders gain clarity, control, and confidence.
How Does an Executive Search and Staffing Dashboard Work?
First, recruitment data flows into Power BI from sources such as:
-
Applicant tracking systems (ATS)
-
CRM tools
-
Excel or Google Sheets
-
Internal recruitment databases
Next, Power BI processes and models this data. Then, the dashboard displays insights through interactive visuals, slicers, and KPI cards.
Because everything updates dynamically, users always see the latest performance data.
Key Features of Executive Search and Staffing Dashboard in Power BI
This dashboard includes 5 well-structured analytical pages, each designed to answer specific recruitment questions.
1. Overview Page: How Is Overall Recruitment Performance Tracking?
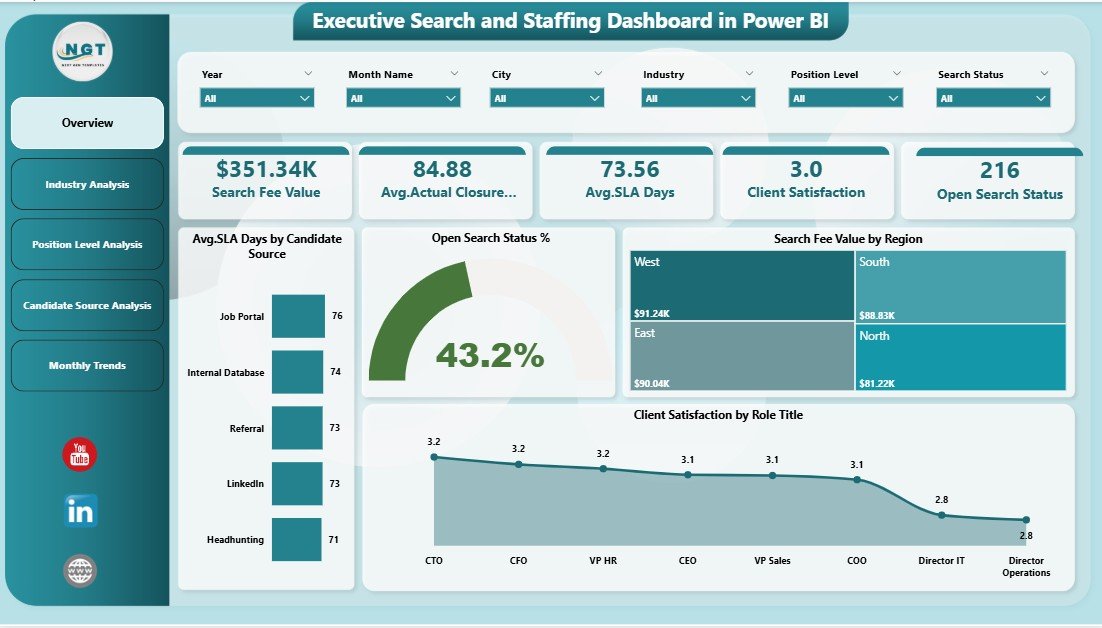
The Overview Page acts as the control center of the dashboard.
Here, leadership teams get an instant snapshot of overall hiring performance.
Key Metrics and Visuals on the Overview Page
-
Average SLA Days by Candidate Source
Helps identify which sources deliver candidates faster -
Open Search Status %
Shows how many searches remain open versus closed -
Search Fee Value by Region
Highlights revenue contribution across regions -
Client Satisfaction by Role Title
Reveals satisfaction levels for different executive roles
Why the Overview Page Matters
Because this page provides high-level clarity, decision-makers can quickly spot risks and opportunities. As a result, leadership can act immediately without digging into raw data.
2. Industry Analysis Page: Which Industries Perform Better?
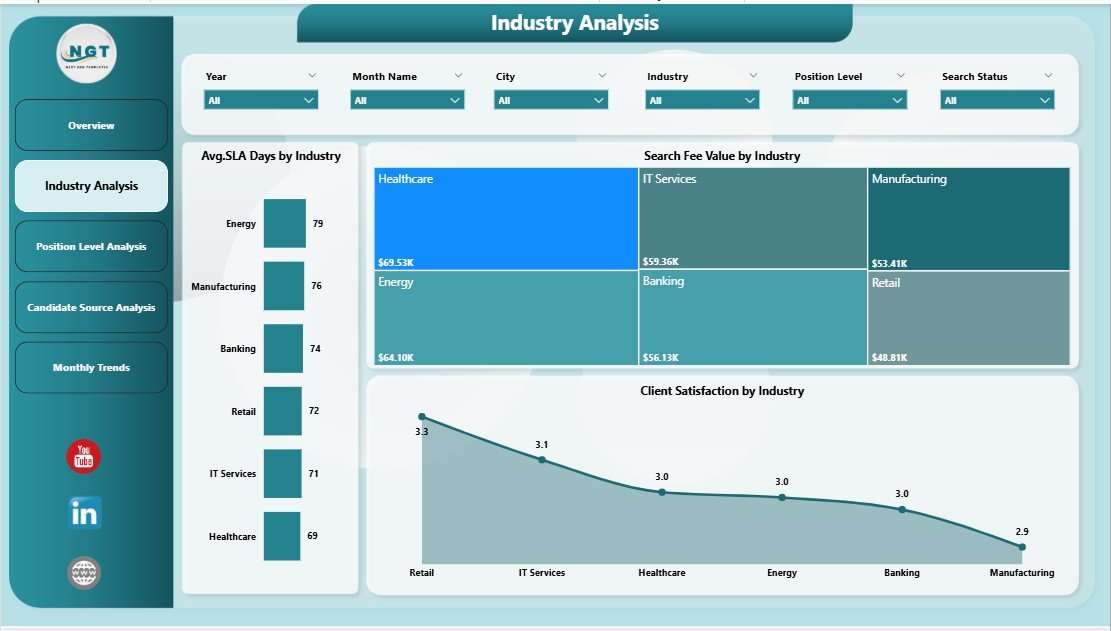
The Industry Analysis Page focuses on performance comparison across industries.
Key Charts on Industry Analysis Page
-
Average SLA Days by Industry
Identifies industries with faster or slower placements -
Search Fee Value by Industry
Shows which industries generate higher revenue -
Client Satisfaction by Industry
Highlights service quality across sectors
How Industry Analysis Improves Decision-Making
Because recruitment demand varies by industry, this page helps firms prioritize high-value sectors. Therefore, teams can allocate recruiters more effectively.
3. Position Level Analysis Page: How Do Seniority Levels Impact Performance?
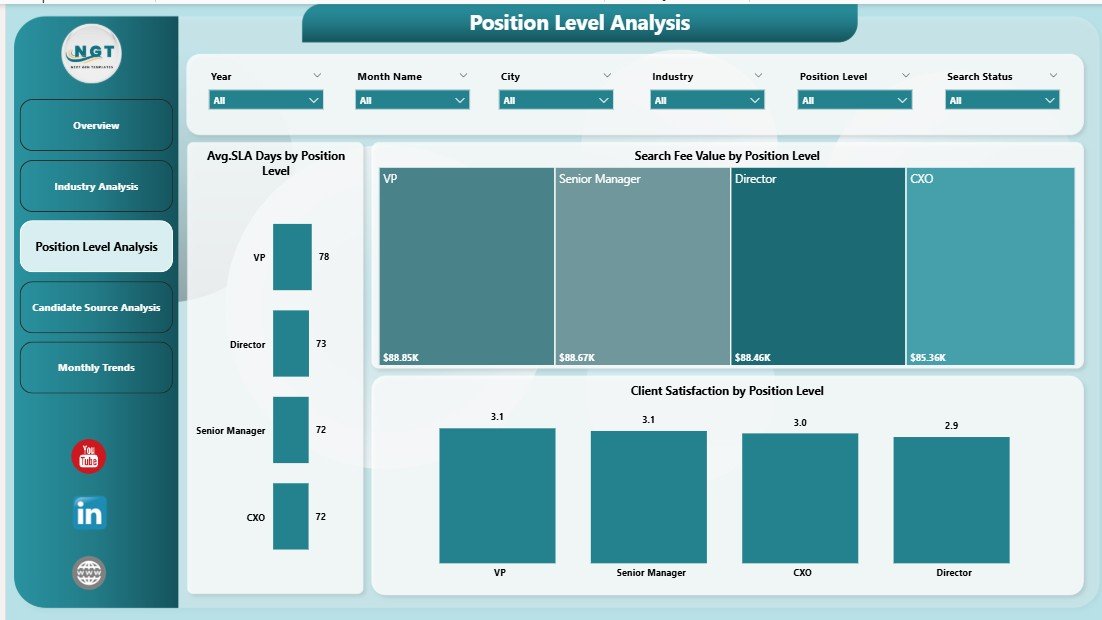
The Position Level Analysis Page evaluates hiring performance across different job levels.
Key Insights Provided
-
Average SLA Days by Position Level
Reveals how long executive, senior, and mid-level searches take -
Search Fee Value by Position Level
Shows revenue contribution by seniority -
Client Satisfaction by Position Level
Measures satisfaction for each level
Why Position Level Analysis Is Critical
Executive roles usually take longer to close. However, this page helps firms balance speed, quality, and revenue across all levels.
4. Candidate Source Analysis Page: Which Sources Deliver the Best Results?
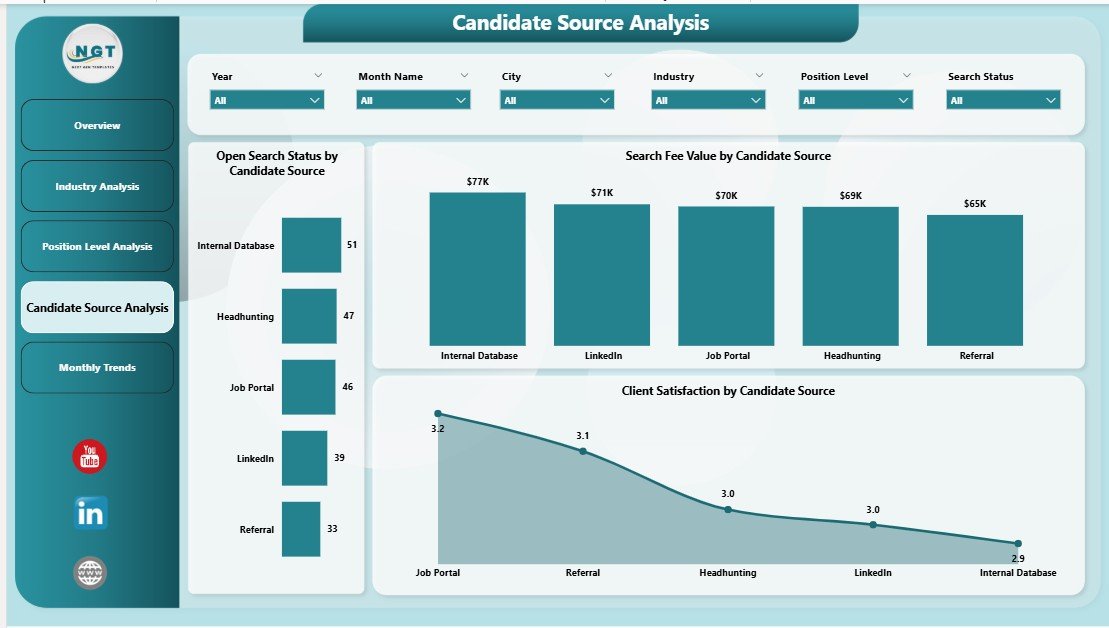
The Candidate Source Analysis Page evaluates the effectiveness of different sourcing channels.
Key Metrics on Candidate Source Analysis
-
Open Search Status by Candidate Source
Tracks active searches by source -
Search Fee Value by Candidate Source
Identifies the most profitable sourcing channels -
Client Satisfaction by Candidate Source
Measures quality of hires from each source
How This Page Helps Recruiters
Because not all sources perform equally, this page allows recruiters to focus on high-performing channels. As a result, sourcing costs reduce while placement quality improves.
5. Month Analysis Page: How Does Recruitment Performance Change Over Time?
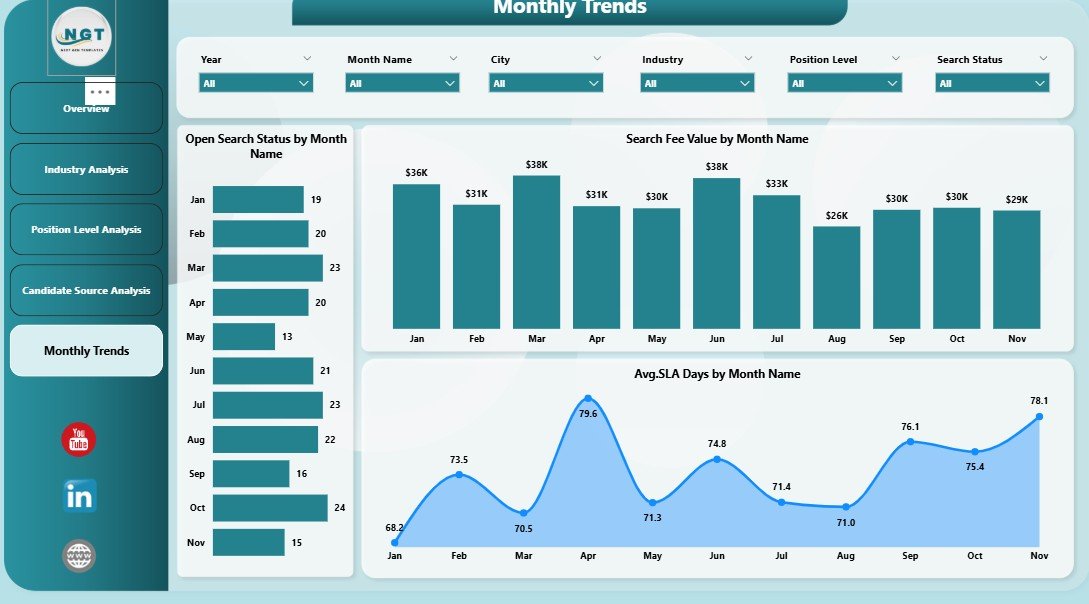
The Month Analysis Page highlights recruitment trends over time.
Key Monthly Trends Tracked
-
Open Search Status by Month
Shows workload trends -
Search Fee Value by Month
Tracks revenue growth or decline -
Average SLA Days by Month
Measures efficiency trends
Why Monthly Analysis Matters
Seasonality affects recruitment. Therefore, this page helps firms forecast demand and plan resources in advance.
What KPIs Does an Executive Search and Staffing Dashboard Track?
Click to Purchases Executive Search and Staffing Dashboard in Power BI
A strong dashboard tracks meaningful recruitment KPIs such as:
-
Average SLA days
-
Open search percentage
-
Search fee value
-
Client satisfaction score
-
Placement speed by source
-
Industry-wise revenue contribution
Because these KPIs align with business goals, leadership can drive growth confidently.
Advantages of Executive Search and Staffing Dashboard in Power BI
1. Improves Recruitment Visibility
The dashboard provides a single source of truth. Therefore, teams always know search status, SLA performance, and revenue impact.
2. Speeds Up Decision-Making
Because insights appear instantly, leaders act faster and reduce delays.
3. Enhances Client Satisfaction
Tracking satisfaction by role and industry helps firms improve service quality.
4. Optimizes Recruiter Productivity
By identifying bottlenecks, teams focus on high-impact tasks.
5. Increases Revenue Transparency
Clear visibility into search fee value helps forecast income accurately.
How Does Power BI Improve Executive Search Strategy?
Power BI allows recruiters to:
-
Identify slow-moving searches
-
Improve SLA compliance
-
Allocate recruiters strategically
-
Focus on profitable industries and roles
-
Enhance client relationships
As a result, firms move from reactive hiring to proactive strategy.
Best Practices for Executive Search and Staffing Dashboard in Power BI
1. Track Only Relevant KPIs
Avoid clutter. Instead, focus on metrics that drive decisions.
2. Maintain Clean and Consistent Data
Accurate insights depend on clean data. Therefore, validate inputs regularly.
3. Use Slicers for Flexibility
Allow users to filter by industry, region, position, and source.
4. Review SLA Trends Weekly
Frequent reviews help avoid delays and client dissatisfaction.
5. Train Recruiters to Use Insights
Dashboards create value only when teams act on insights.
Who Can Benefit from an Executive Search and Staffing Dashboard?
Click to Purchases Executive Search and Staffing Dashboard in Power BI
This dashboard benefits:
-
Executive search firms
-
Staffing agencies
-
Recruitment managers
-
HR leadership teams
-
Talent acquisition analysts
Because the dashboard supports both strategic and operational needs, it suits organizations of all sizes.
How to Implement an Executive Search and Staffing Dashboard Successfully?
Follow these steps:
-
Define recruitment goals clearly
-
Identify key KPIs
-
Prepare structured data sources
-
Build interactive visuals in Power BI
-
Test insights with stakeholders
-
Improve continuously
This approach ensures long-term success.
Common Challenges Solved by This Dashboard
-
Delayed reporting
-
Inconsistent SLA tracking
-
Poor source performance visibility
-
Revenue forecasting issues
-
Client satisfaction blind spots
Because the dashboard centralizes insights, these problems disappear.
Future of Executive Search Analytics with Power BI
Recruitment analytics will continue evolving. Power BI enables:
-
Predictive hiring insights
-
Advanced trend forecasting
-
AI-driven candidate insights
-
Automated reporting
Therefore, firms adopting dashboards today stay future-ready.
Conclusion: Why Executive Search and Staffing Dashboard in Power BI Is a Must-Have
Executive search demands precision, speed, and transparency. Manual tracking simply cannot keep up with modern recruitment complexity.
An Executive Search and Staffing Dashboard in Power BI transforms raw recruitment data into clear, actionable insights. It improves SLA compliance, boosts client satisfaction, enhances recruiter productivity, and drives revenue growth.
If your recruitment firm wants clarity, control, and confidence, this dashboard becomes essential.
Frequently Asked Questions About Executive Search and Staffing Dashboard in Power BI
Click to Purchases Executive Search and Staffing Dashboard in Power BI
What is the main purpose of an executive search dashboard?
The main purpose is to track recruitment performance, SLA efficiency, revenue, and client satisfaction in one place.
Can small staffing firms use Power BI dashboards?
Yes, Power BI works well for both small and large recruitment firms.
Does this dashboard require technical expertise?
No. Users can interact with visuals easily using slicers and filters.
How often should recruitment data be updated?
Ideally, update data daily or weekly to ensure accurate insights.
Can this dashboard integrate with ATS systems?
Yes, Power BI integrates with most ATS and CRM platforms.
How does the dashboard improve client satisfaction?
By tracking SLA and performance trends, firms resolve issues faster and improve service quality.
Visit our YouTube channel to learn step-by-step video tutorials