Export Promotion Councils KPI Dashboard
Export Promotion Councils KPI Dashboard is a ready-to-use Excel template designed to help export promotion teams track MTD and YTD KPIs, compare to targets and previous year figures, and visualize KPI trends with clear conditional formatting and charts.
Click to Purchases Export Promotion Councils KPI Dashboard in Excel
Introduction
This Export Promotion Councils KPI Dashboard template is built for monitoring the performance of export-promotion activities. It provides an organized, interactive view of actuals, targets, and previous year (PY) values with trend analysis and conditional formatting for fast decision-making.
Key Features of Export Promotion Councils KPI Dashboard
- Ready-to-use Excel dashboard with 7 functional worksheets.
- Month selector to view MTD and YTD numbers dynamically.
- Side-by-side comparison: Actual vs Target and PY vs Actual with up/down arrow conditional formatting.
- KPI Trend charts for Actual, Target, and Previous Year values.
- Separate input sheets for Actuals, Targets, and Previous Year values for easy updates.
- KPI definition table including unit, formula, and whether lower or upper is better.
Dashboard Pages Explanation
1. Home sheet
The Home sheet acts as an index, providing quick navigation to other dashboard pages via six buttons. Use it as the starting point for your workflow.
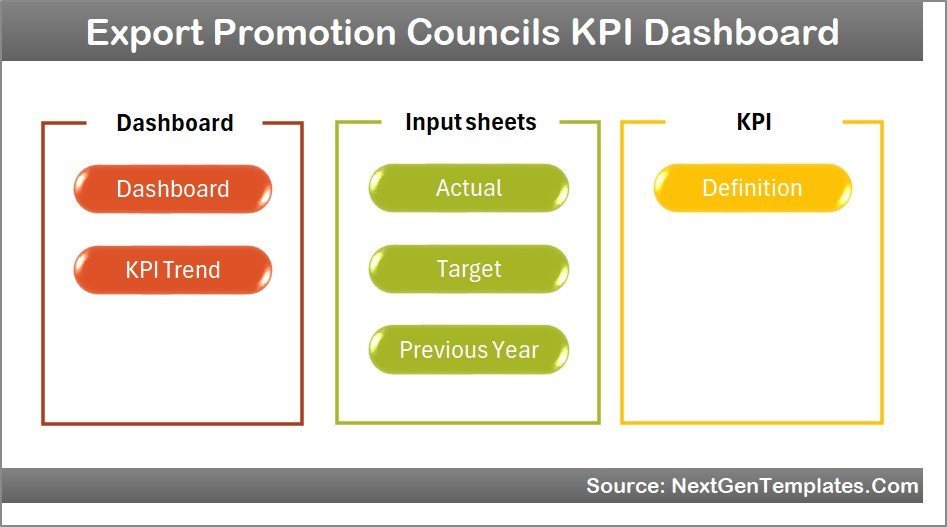
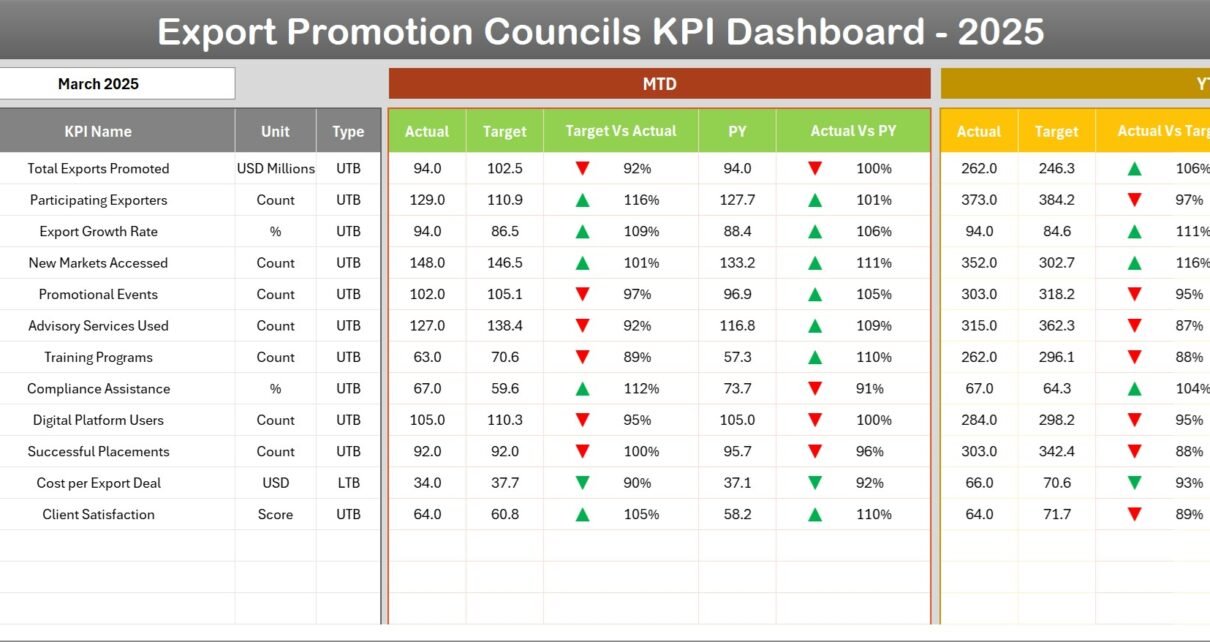
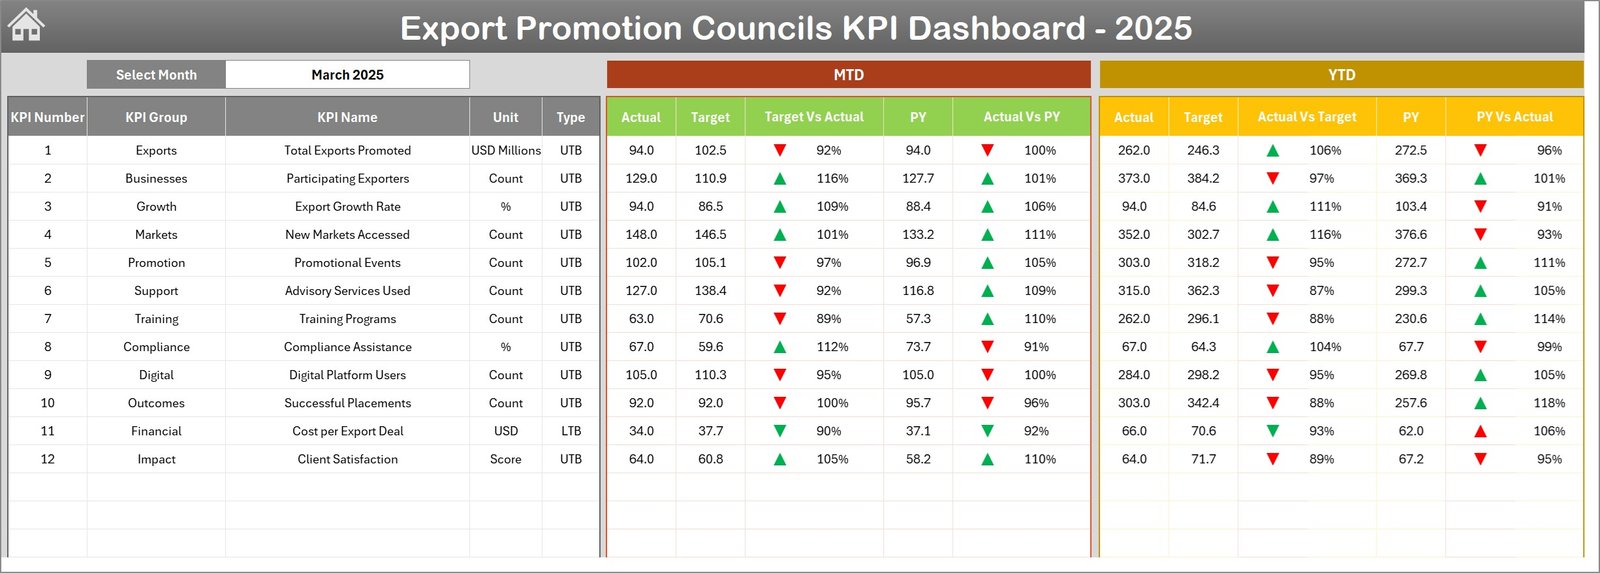
2. Dashboard sheet
This is the main analytical view. Select a month from the drop-down (cell D3) and the entire dashboard updates for that month. You will see:
- MTD Actual, Target, and PY values
- MTD Target vs Actual and PY vs Actual with conditional up/down arrows
- YTD Actual, Target, and PY values with the same comparisons
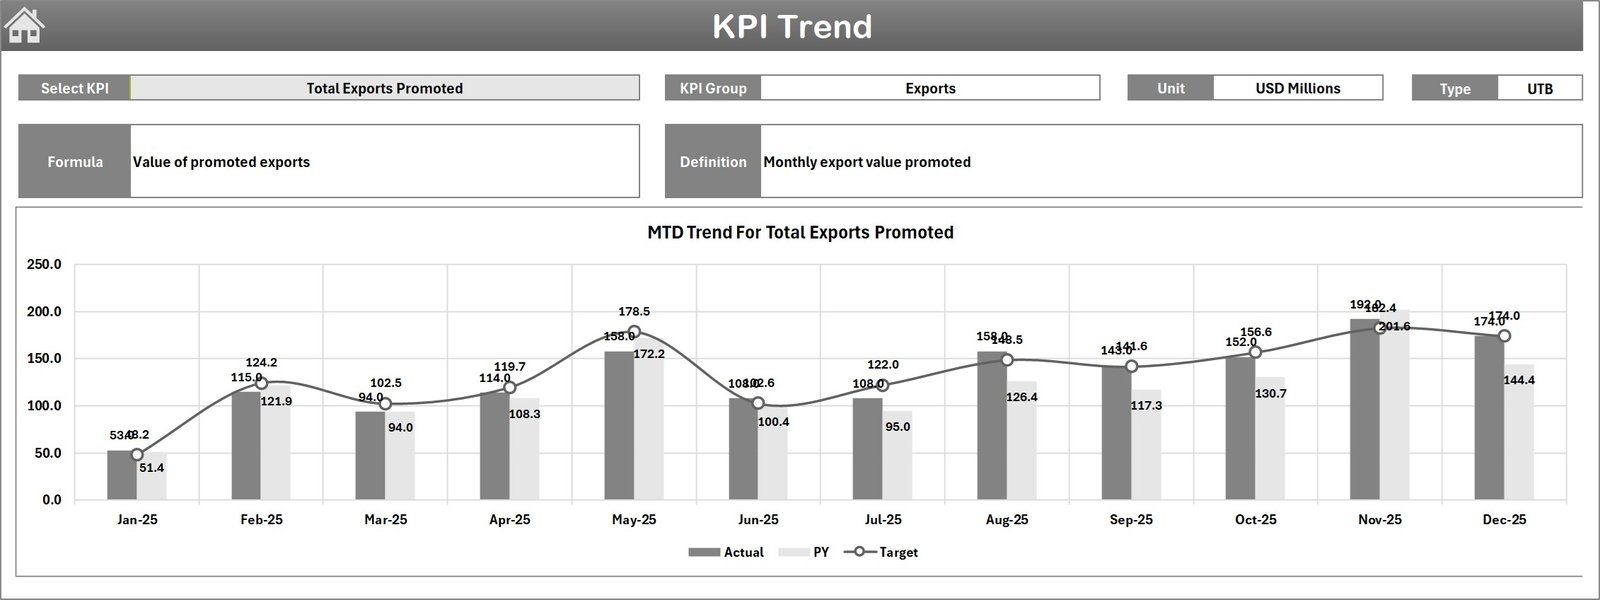
3. KPI Trend sheet
Select the KPI name from the drop-down (cell C3) to see detailed KPI information and trend charts. The sheet shows:
- KPI Group, Unit, Type (LTB or UTB), Formula, and Definition
- MTD and YTD trend charts comparing Actual, Target, and PY values
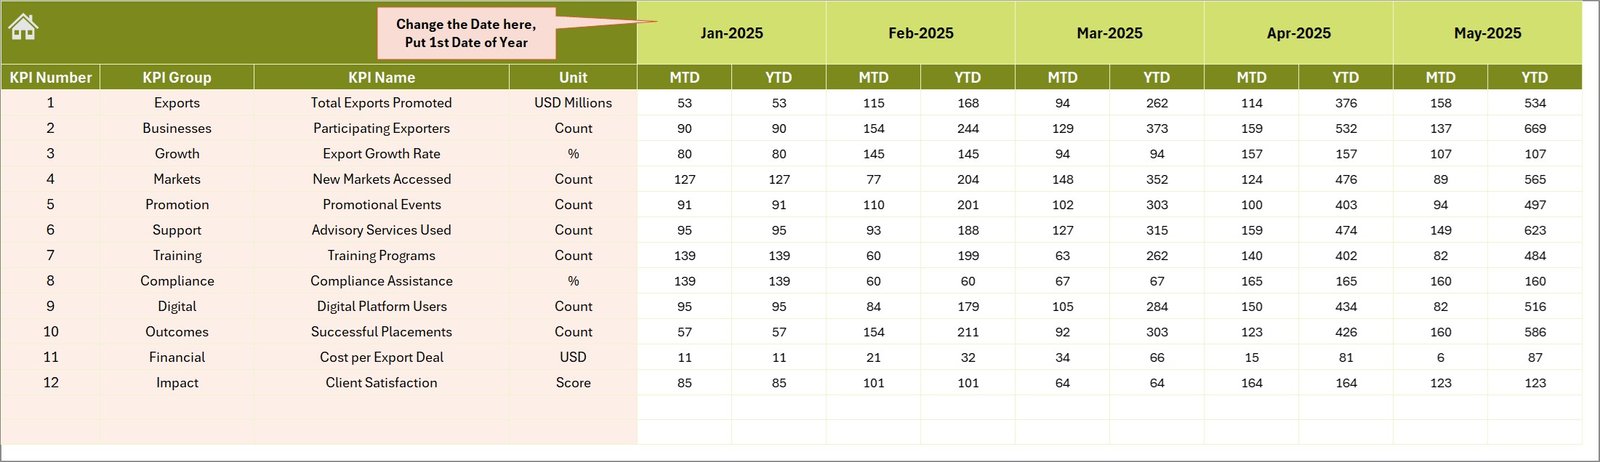
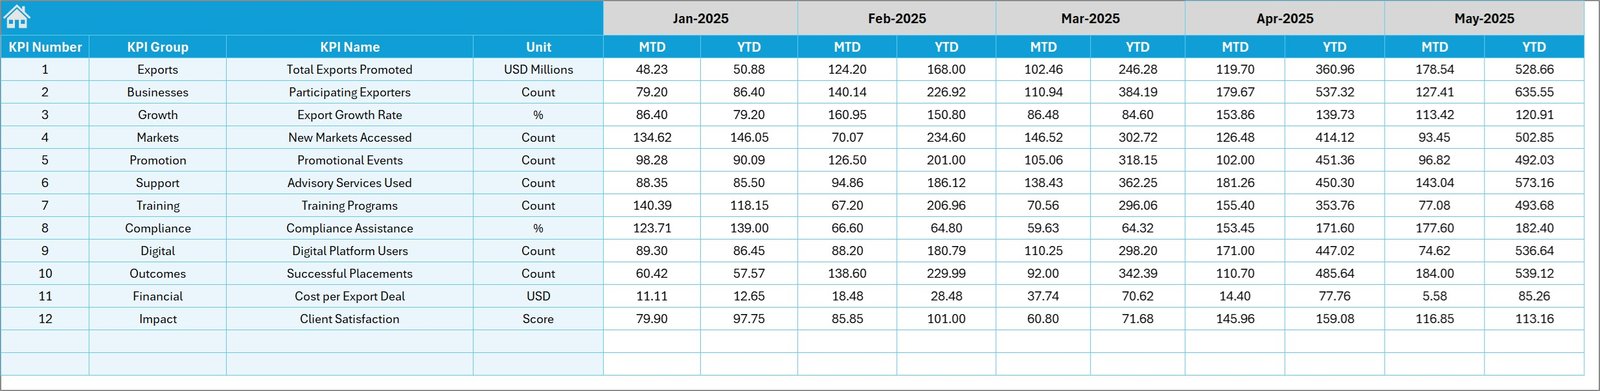
4. Actual Numbers Input sheet
Enter the actual MTD and YTD numbers for each KPI. Set the first month of the fiscal year in cell E1 to align YTD calculations.
5. Target Number Input sheet
Maintain monthly Target values (MTD and YTD). These feed the Dashboard and KPI Trend charts so you can compare performance against objectives.
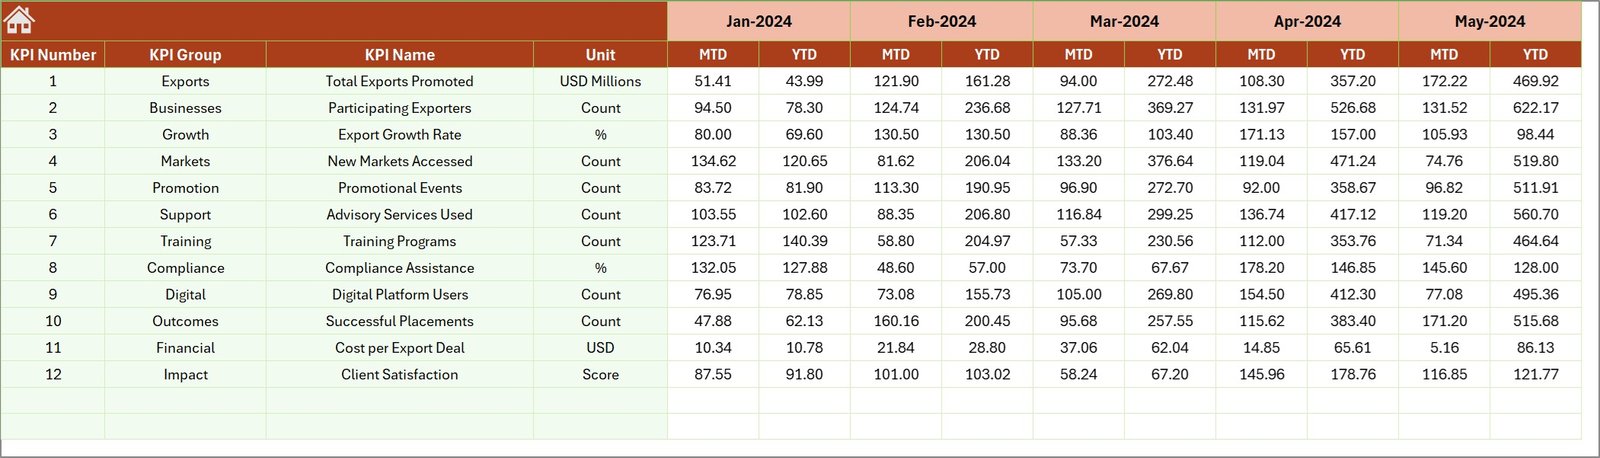
6. Previous Year Number sheet
Enter last year’s monthly numbers in the same layout as the current year to enable accurate year-over-year comparisons and trend analysis.
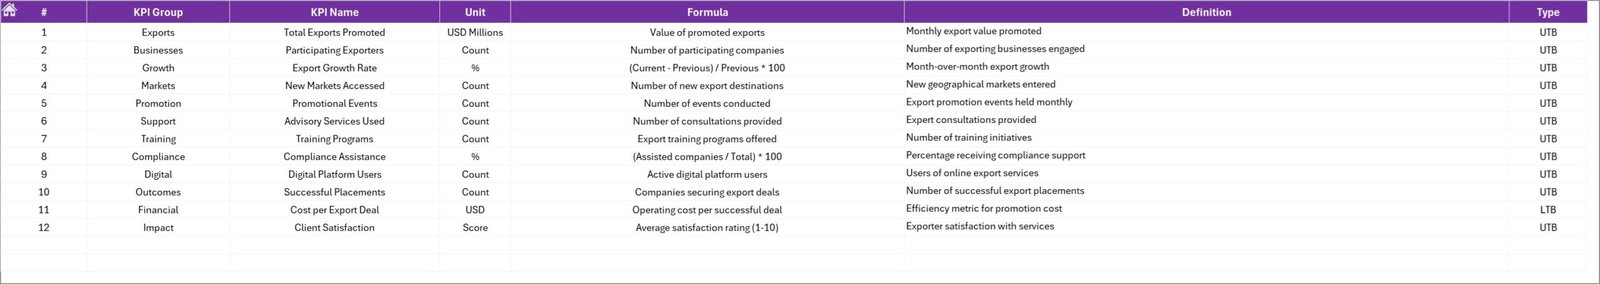
7. KPI Definition sheet
Centralized KPI metadata: enter KPI Name, Group, Unit, Formula, Definition, and KPI Type (LTB or UTB). This ensures consistency across the dashboard and reporting.
Advantages of Export Promotion Councils KPI Dashboard
- Fast, visual insights into performance against targets and last year.
- Centralized input structure reduces data-entry errors.
- Conditional formatting highlights areas that need attention.
- Interactive selectors allow scenario and month-based analysis.
- Helps stakeholders make data-driven decisions quickly.
Opportunities for Improvement
- Integrate with Power BI or Excel Power Query for automated data refreshes from source systems.
- Add role-based views or filters to show KPI subsets per council or region.
- Include forecasted values and variance explanations for proactive planning.
- Automate KPI alerts using Power Automate or VBA for monthly notifications.
Best Practices
- Standardize KPI definitions and units in the KPI Definition sheet before populating data.
- Keep a single master file and use protected input sheets to avoid unintentional formula changes.
- Use data validation for month selection and KPI names to prevent typos.
- Review conditional formatting rules annually to align with changing targets or strategy.
- Back up historical versions before major changes to avoid data loss.
FAQs
Q: How do I change the reporting month?
A: On the Dashboard sheet, change the month in cell D3. For the input sheets, ensure the first month in cell E1 is set correctly to align YTD calculations.
Q: Can I add new KPIs?
A: Yes. Add the KPI to the KPI Definition sheet, then add relevant rows in the Actual, Target, and Previous Year sheets so the dashboard formulas pick up the new KPI.
Q: Is this dashboard compatible with Power BI?
A: The Excel layout is compatible with Power BI imports. For automated refresh and advanced visualization, export the input tables to Power BI and use its data modeling capabilities. See Microsoft Power BI documentation for guidance: Power BI docs.
Click to Purchases Export Promotion Councils KPI Dashboard in Excel
Conclusion
The Export Promotion Councils KPI Dashboard is an effective, ready-made template for tracking export-related KPIs, comparing performance against targets and prior year, and visualizing trends. It promotes consistent KPI management and helps decision-makers act quickly.
Learn more about Excel features referenced in this template: Microsoft Excel Help & Learning.
Visit our YouTube channel to watch the demo: Youtube.com/@NextGenTemplates