Managing facilities leasing without clear visibility often leads to rising costs, missed renewals, and poor space utilization. However, when organizations track the right KPIs, they gain control, clarity, and confidence in every leasing decision. That is exactly why a Facilities Leasing KPI Dashboard in Power BI becomes a critical business tool.
In this detailed guide, you will learn what a Facilities Leasing KPI Dashboard in Power BI is, why organizations need it, how it works, and how it helps decision-makers monitor leasing performance effectively. Moreover, this article explains every dashboard page, KPIs, data structure, advantages, best practices, and common questions in detail.
Click to buy Facilities Leasing KPI Dashboard in Power BI
What Is a Facilities Leasing KPI Dashboard in Power BI?
A Facilities Leasing KPI Dashboard in Power BI is a centralized analytical solution that helps organizations track, analyze, and optimize facility leasing performance using key performance indicators.
Instead of managing multiple Excel sheets, emails, and reports, this dashboard consolidates leasing data into one interactive Power BI report. As a result, facility managers, finance teams, and leadership gain real-time insights into lease performance.
Because Power BI supports dynamic visuals, slicers, and drill-through features, users can easily analyze Month-to-Date (MTD), Year-to-Date (YTD), targets, and historical trends without technical complexity.
Why Do Organizations Need a Facilities Leasing KPI Dashboard?
Facilities leasing involves multiple KPIs, locations, timelines, and cost elements. Without structured monitoring, organizations struggle to control expenses and ensure compliance. Therefore, a KPI dashboard becomes essential.
Key Reasons Organizations Use This Dashboard
- Because it provides complete lease visibility
- Because it improves cost control and forecasting
- Because it tracks MTD and YTD performance
- Because it highlights target gaps instantly
- Because it supports data-driven decisions
As leasing portfolios grow, manual tracking fails. However, Power BI transforms leasing data into actionable insights.
How Does a Facilities Leasing KPI Dashboard in Power BI Work?
This dashboard uses Excel as the data source and Power BI Desktop for visualization. As a result, users enjoy flexibility and control.
Data Flow Overview
- Users enter data in structured Excel templates
- Power BI connects to the Excel file
- Measures calculate KPIs automatically
- Visuals update instantly based on slicers
Therefore, updates remain simple and scalable.
Dashboard Structure: Pages Included in the Power BI File
The Facilities Leasing KPI Dashboard in Power BI includes three professionally designed pages. Each page serves a unique analytical purpose.
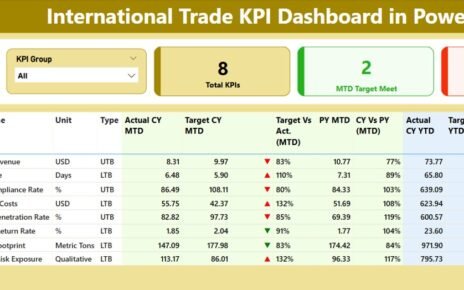
Summary Page Show
The Summary Page acts as the command center of the dashboard. It provides a complete snapshot of leasing performance at a glance.
Top-Level Filters and Cards
- Month Slicer – Analyze data month-wise
- KPI Group Slicer – Focus on specific KPI categories
- Total KPIs Count – Total KPIs tracked
- MTD Target Met Count – KPIs achieving targets
- MTD Target Missed Count – KPIs missing targets
Because these cards update dynamically, users instantly understand overall leasing health.
Detailed KPI Performance Table
Below the cards, the dashboard displays a structured KPI table with the following columns:
- KPI Number – Unique sequence number
- KPI Group – KPI category or group
- KPI Name – Name of the leasing KPI
- Unit – Measurement unit
- Type – LTB (Lower the Better) or UTB (Upper the Better)
Month-to-Date (MTD) Analysis
- Actual CY MTD – Current year actual MTD value
- Target CY MTD – Current year target MTD value
- MTD Icon – ▲ or ▼ indicator with color coding
- Target vs Actual (MTD) – Actual ÷ Target
- PY MTD – Previous year MTD value
- CY vs PY (MTD) – CY MTD ÷ PY MTD
Because of conditional formatting, users immediately identify underperforming KPIs.
Year-to-Date (YTD) Analysis
- Actual CY YTD
- Target CY YTD
- YTD Icon
- Target vs Actual (YTD)
- PY YTD
- CY vs PY (YTD)
Thus, the summary page delivers both short-term and long-term insights.

Click to buy Facilities Leasing KPI Dashboard in Power BI
KPI Trend Page
The KPI Trend Page focuses on historical analysis. While the summary page shows current status, this page shows trends over time.
Key Features of the KPI Trend Page
Two Combo Charts
MTD Actual vs Target vs Previous Year
YTD Actual vs Target vs Previous Year
KPI Name Slicer
Select any KPI for deep analysis
Because combo charts combine bars and lines, users easily compare performance across periods.

Click to buy Facilities Leasing KPI Dashboard in Power BI
KPI Definition Page
The KPI Definition Page acts as a knowledge base for KPIs.
Why This Page Matters
- It explains KPI formulas
- It defines business meaning
- It clarifies LTB vs UTB logic
This page remains hidden by default and opens through drill-through from the summary page. Therefore, users get context without cluttering the main view.

Click to buy Facilities Leasing KPI Dashboard in Power BI
How Does Drill-Through Improve Analysis?
Drill-through allows users to right-click on any KPI and view its detailed definition instantly. As a result:
- New users understand KPIs quickly
- Stakeholders avoid confusion
- Reporting accuracy improves
To return, users simply click the Back button on the top left corner.
Excel Data Structure Used in This Dashboard
The dashboard connects to a single Excel file with three structured worksheets. This approach keeps data management simple and efficient.
Input_Actual Sheet
This sheet captures actual performance data.
Columns Included
- KPI Name
- Month (First date of the month)
- MTD Actual Value
- YTD Actual Value
Because the structure remains consistent, Power BI refreshes smoothly.
Click to buy Facilities Leasing KPI Dashboard in Power BI
Input_Target Sheet
This sheet stores target values for KPIs.
Columns Included
- KPI Name
- Month (First date of the month)
- MTD Target Value
- YTD Target Value
Therefore, performance comparisons remain accurate.
KPI Definition Sheet
This sheet defines KPIs clearly.
Columns Included
- KPI Number
- KPI Group
- KPI Name
- Unit
- Formula
- Definition
- Type (LTB or UTB)
Because definitions stay centralized, governance improves significantly.
Advantages of Facilities Leasing KPI Dashboard in Power BI
Why This Dashboard Adds Real Business Value
- Provides centralized lease performance tracking
- Improves cost control and budgeting
- Identifies underperforming leases instantly
- Supports proactive decision-making
- Reduces manual reporting effort
- Enhances transparency across teams
As a result, organizations operate more efficiently and confidently.
Who Can Benefit from This Dashboard?
This dashboard serves multiple roles across the organization.
Key Users
- Facility Managers
- Real Estate Teams
- Finance & Accounting Teams
- Operations Managers
- Senior Leadership
Because the dashboard uses Power BI, users do not need advanced technical skills.
Best Practices for Using Facilities Leasing KPI Dashboard in Power BI
How to Get the Best Results
- Keep KPI definitions standardized
- Update Excel data monthly without gaps
- Review MTD and YTD trends regularly
- Monitor target misses proactively
- Use drill-through for clarity
- Train users on KPI logic
When teams follow these practices, dashboard adoption increases significantly.
How Does This Dashboard Support Strategic Decisions?
This dashboard enables organizations to:
- Optimize lease renewals
- Control occupancy costs
- Improve utilization planning
- Align leasing goals with budgets
Therefore, leadership moves from reactive to proactive decision-making.
Conclusion: Why Facilities Leasing KPI Dashboard in Power BI Is Essential
Facilities leasing requires constant monitoring, accurate reporting, and strategic insight. Without a structured system, organizations risk inefficiency and financial loss.
The Facilities Leasing KPI Dashboard in Power BI solves this challenge by combining structured Excel data with powerful Power BI visuals. As a result, teams gain clarity, control, and confidence.
If your organization manages multiple facilities or leases, this dashboard becomes a must-have analytical tool.
Frequently Asked Questions (FAQs)
What is the main purpose of a Facilities Leasing KPI Dashboard?
The main purpose is to track, analyze, and improve leasing performance using real-time KPIs.
Can beginners use this Power BI dashboard?
Yes. Because the dashboard uses slicers and visuals, beginners can use it easily.
Do I need Power BI Service to use this dashboard?
No. You can use it fully in Power BI Desktop.
How often should data be updated?
You should update the Excel data monthly for accurate MTD and YTD analysis.
Can I add more KPIs to this dashboard?
Yes. You can easily add new KPIs by updating the Excel sheets.
Does this dashboard support drill-through analysis?
Yes. Users can drill through from the summary page to KPI definitions.
Is Excel mandatory as a data source?
This dashboard uses Excel by design. However, advanced users can replace it with other data sources if required.
Visit our YouTube channel to learn step-by-step video tutorials
Watch the step-by-step video tutorial:
Click to buy Facilities Leasing KPI Dashboard in Power BI