In today’s dynamic business environment, efficient facility management is more than just maintenance — it’s about ensuring safety, comfort, and productivity across every building and workspace. From tracking maintenance requests to analyzing operational costs, facility managers face increasing pressure to make data-driven decisions quickly. That’s where the Facilities Management Dashboard in Power BI comes in.
This interactive dashboard transforms raw facility data into clear, actionable insights. With just a few clicks, you can monitor performance across departments, track issue resolutions, prioritize critical repairs, and identify patterns that drive better decisions.
In this article, we’ll explore everything about the Facilities Management Dashboard in Power BI — its structure, features, advantages, and best practices. By the end, you’ll see how this tool helps you manage facilities smarter, faster, and more efficiently.
Click to Purchases Facilities Management Dashboard in Power BI
What Is a Facilities Management Dashboard in Power BI?
A Facilities Management Dashboard in Power BI is a business intelligence tool that consolidates and visualizes all facility-related data in one place. It connects to your Excel data file and turns rows of maintenance logs, requests, and performance records into insightful charts and summaries.
With this dashboard, facility managers can track:
-
Number of open, closed, and in-progress maintenance requests
-
Priority-wise issue distribution (High, Medium, Low)
-
Department-wise and location-wise requests
-
Monthly trends and performance indicators
-
High-priority issue ratios and completion timelines
Instead of manually checking multiple sheets or systems, Power BI automates the analysis and visualizes it in real time. The result — better control, faster responses, and improved facility performance.
Key Features of the Facilities Management Dashboard in Power BI
This ready-to-use Power BI dashboard includes five key pages, each offering a unique view of your facility’s performance and issues.
Click to Purchases Facilities Management Dashboard in Power BI
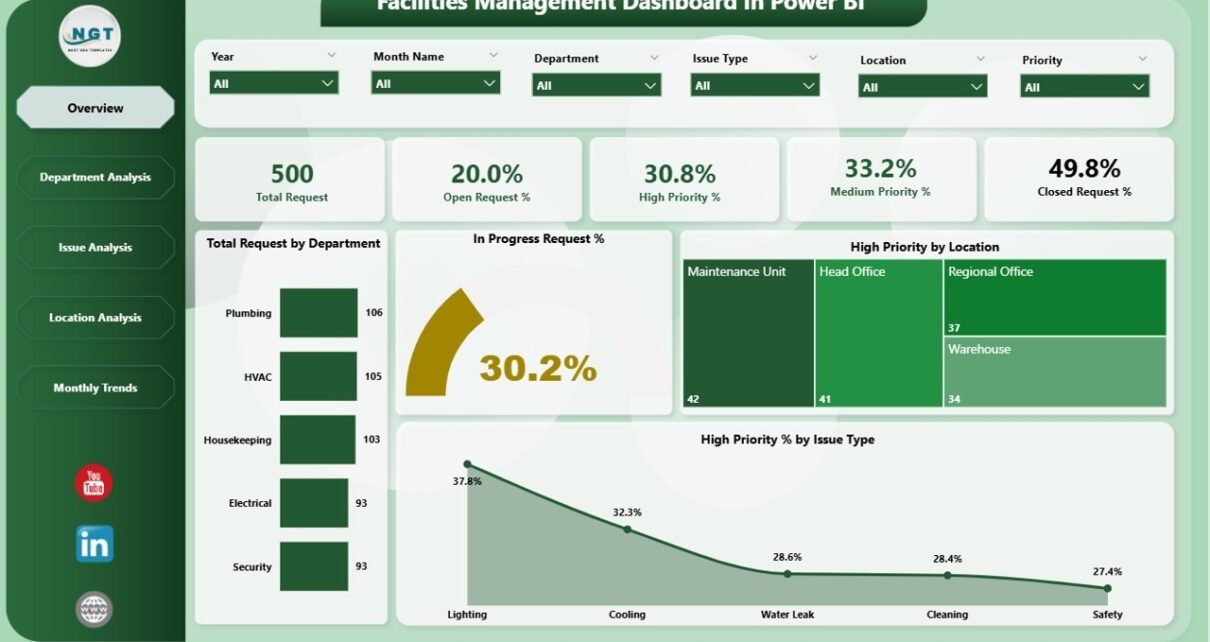
1️⃣ Overview Page
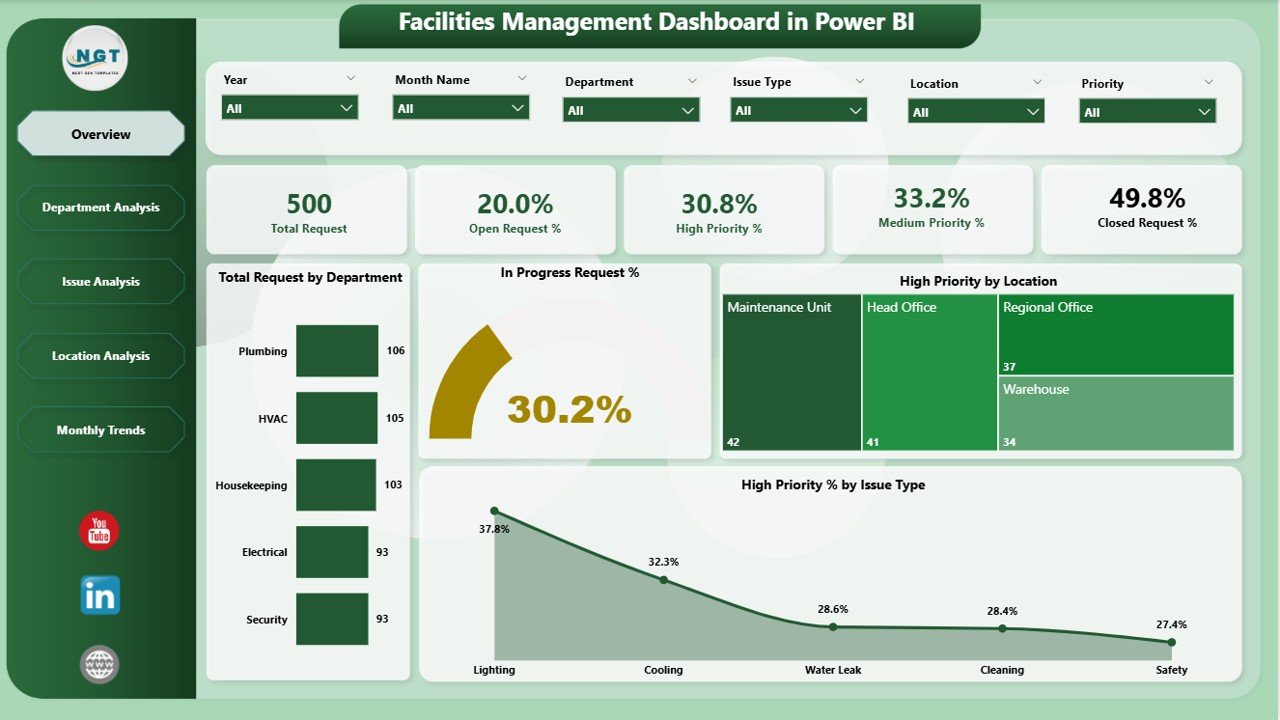
The Overview Page is the main dashboard interface where you get a complete snapshot of your facility operations.
Key highlights include:
-
Interactive slicers to filter by department, location, or priority
-
Five summary cards displaying key figures like Total Requests, Closed Requests, In Progress %, and High Priority %
Four dynamic charts visualizing:
- Total Requests by Department
- In Progress Request %
- High Priority Requests by Location
- High Priority % by Issue Type
This page gives managers a bird’s-eye view of all ongoing activities, helping them quickly identify where attention is needed.
2️⃣ Department Analysis Page
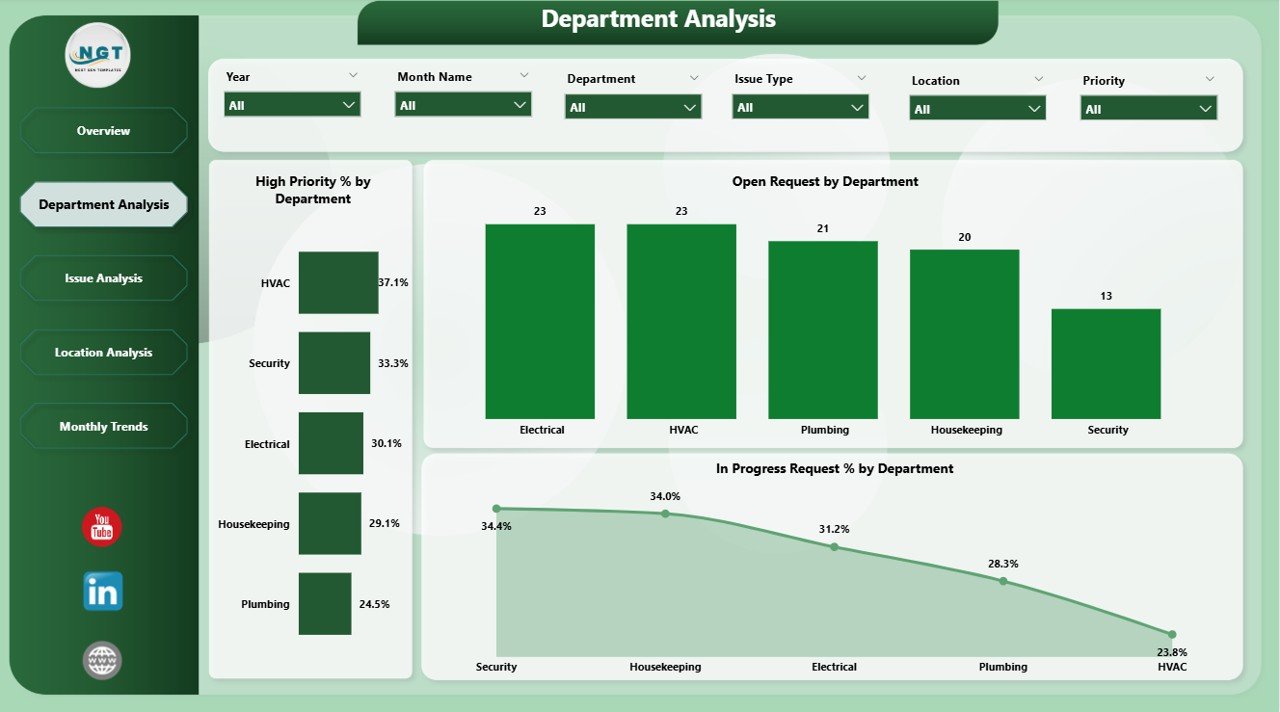
The Department Analysis Page dives deeper into departmental performance.
It includes:
-
Slicers for department selection
Three comparative charts:
- High Priority % by Department
- Open Requests by Department
- In Progress Request % by Department
This section helps identify which departments face more issues, where delays occur, and which teams are performing efficiently.
3️⃣ Issue Analysis Page
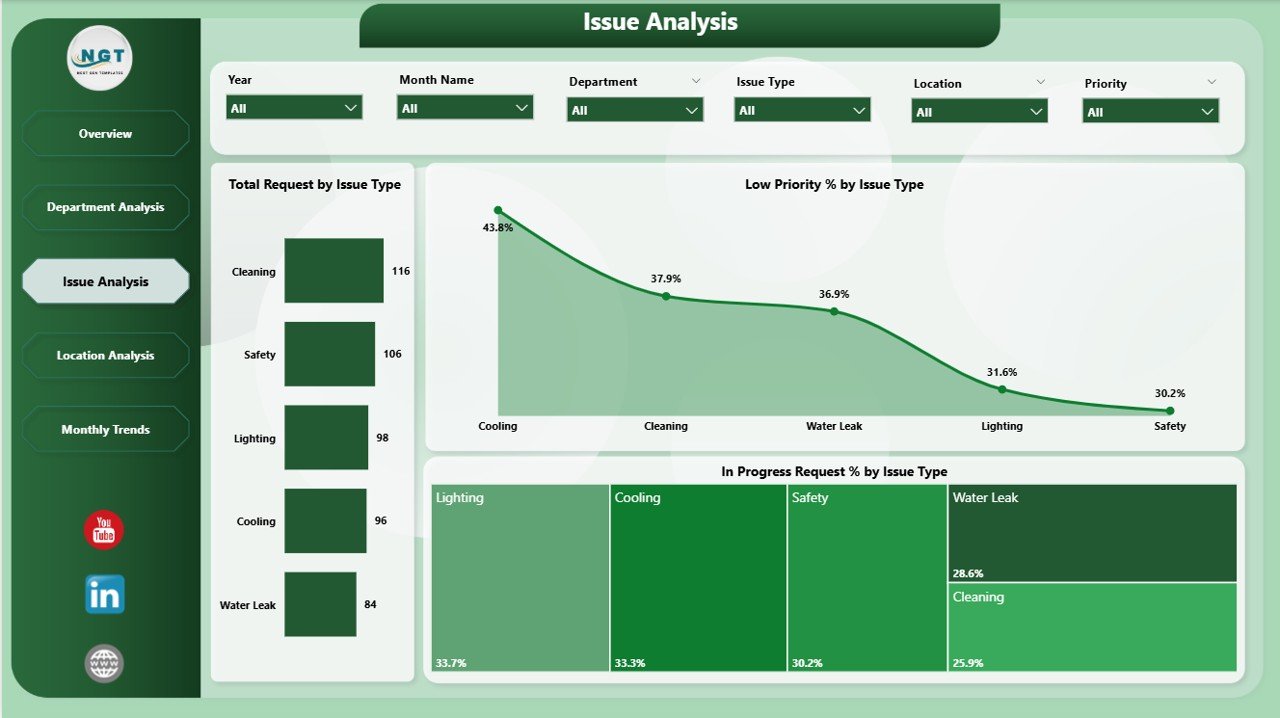
The Issue Analysis Page focuses on problem types and their impact.
Key charts on this page include:
-
Total Requests by Issue Type
-
Low Priority % by Issue Type
-
In Progress Request % by Issue Type
By analyzing this page, you can determine recurring problems, assess workload by issue type, and plan preventive measures to reduce frequent failures.
4️⃣ Location Analysis Page
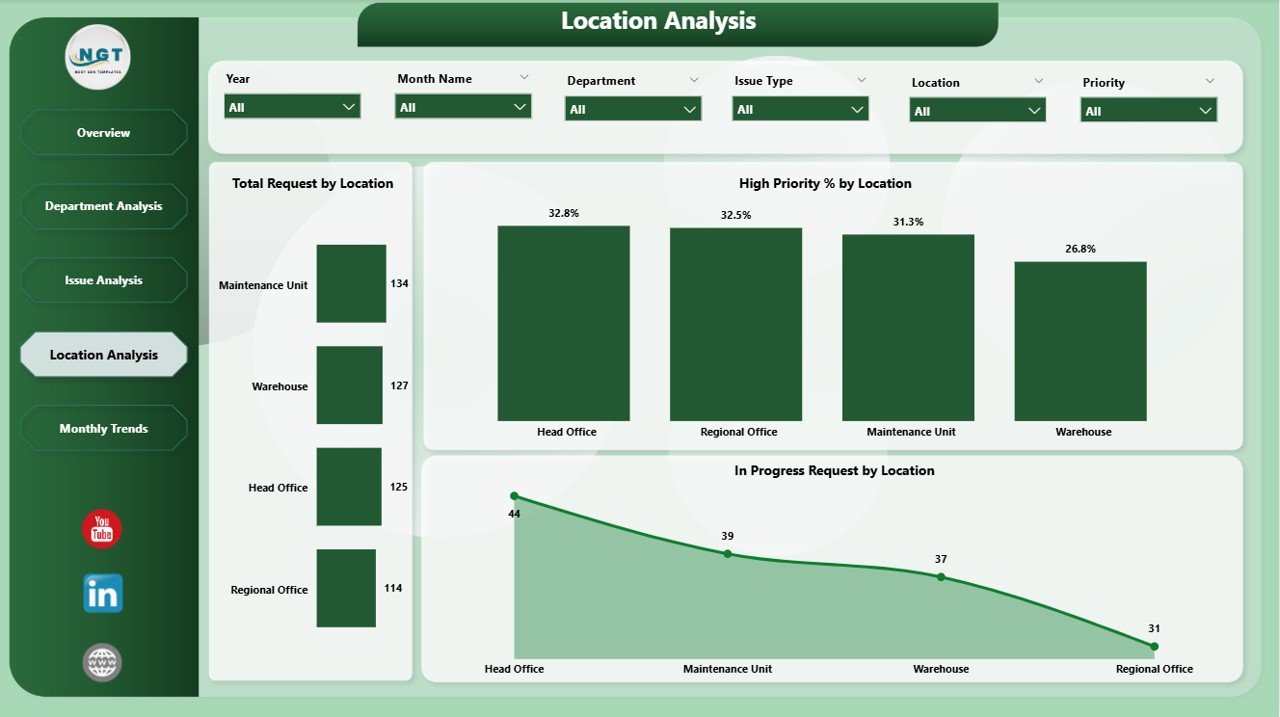
The Location Analysis Page gives insights into geographical or branch-based performance.
Here you’ll find:
-
Total Requests by Location
-
In Progress Request % by Location
-
High Priority % by Location
These visuals are perfect for organizations managing multiple offices, campuses, or sites. Facility managers can easily identify which location experiences more issues or where urgent attention is required.
5️⃣ Monthly Trends Page
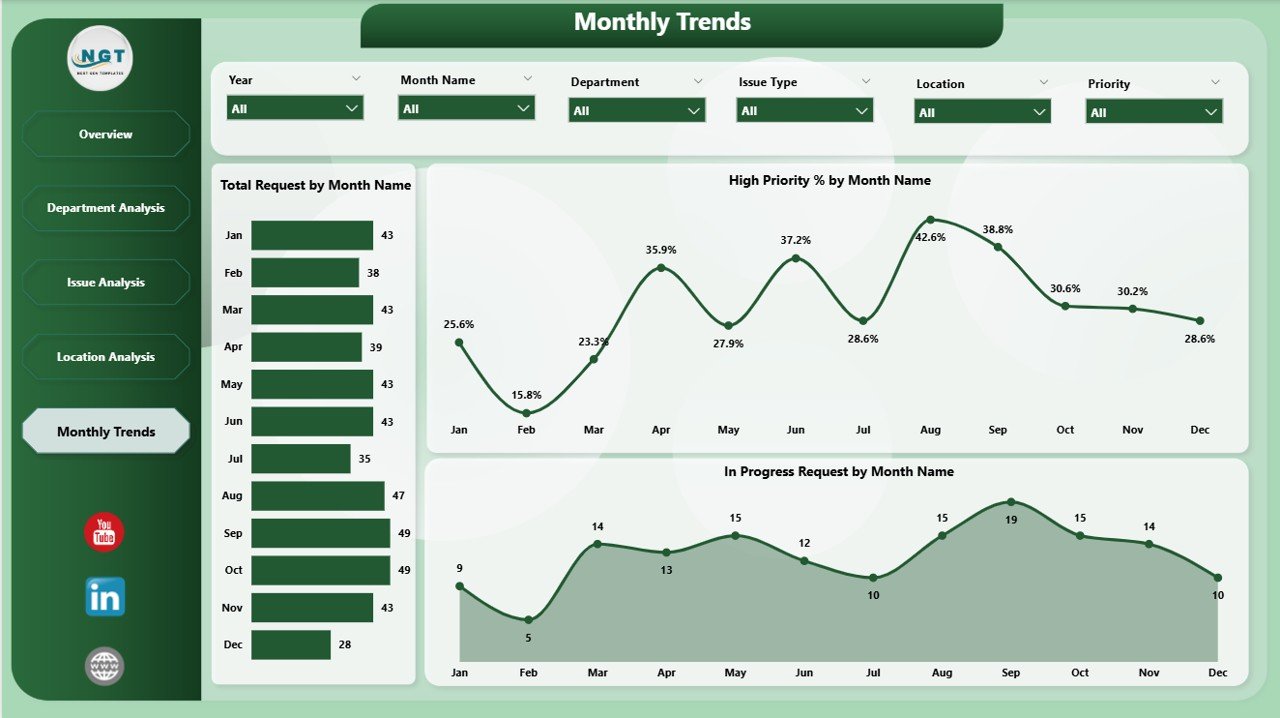
The Monthly Trends Page tracks progress and performance over time.
Charts include:
-
Total Requests by Month
-
In Progress Requests by Month
-
High Priority % by Month
Trend analysis is crucial for planning maintenance schedules, forecasting resource needs, and measuring improvement month after month.
💡 Why Use Power BI for Facilities Management?
Microsoft Power BI stands out as one of the most powerful business intelligence tools. For facilities management, it offers several benefits:
-
Real-time Insights: Automatic data refresh ensures managers always work with the latest data.
-
Interactive Visuals: Easily filter and drill down into any department or issue.
-
Customizable Dashboards: Adapt visuals to match your organization’s reporting needs.
-
Data Integration: Combine Excel, SQL, and IoT sensor data into one system.
-
Mobile Accessibility: View reports anytime on tablets or smartphones.
Power BI eliminates manual reporting, making facility operations transparent and measurable.
Click to Purchases Facilities Management Dashboard in Power BI
⚙️ How Does the Facilities Management Dashboard Work?
The Facilities Management Dashboard in Power BI connects directly to your Excel data source.
Here’s a simple workflow:
-
Data Input in Excel: All facility requests, issue types, departments, priorities, and dates are recorded in an Excel sheet.
-
Data Connection: Power BI imports this data using Power Query.
-
Data Modeling: Relationships are established between tables (e.g., Issues, Departments, Locations).
-
Visual Creation: Each dashboard page displays KPIs, charts, and filters.
-
User Interaction: Users explore data using slicers, filters, and drill-through features.
-
Auto Refresh: The dashboard updates automatically when new data is added.
This seamless process eliminates repetitive manual reporting, allowing teams to focus on improving operations instead.
🚀 Advantages of Using a Facilities Management Dashboard in Power BI
Implementing a Power BI dashboard for facilities management offers numerous advantages. Here are the top benefits:
✅ 1. Real-Time Performance Tracking
You can monitor open, closed, and in-progress requests instantly. The dashboard updates automatically, providing accurate and timely insights.
✅ 2. Improved Decision-Making
Interactive visuals help managers identify issues faster and allocate resources efficiently.
✅ 3. Enhanced Accountability
Each department’s performance becomes transparent, promoting accountability and faster issue resolution.
✅ 4. Centralized Reporting
Combining multiple data points in one dashboard simplifies reporting and ensures consistency across teams.
✅ 5. Time and Cost Savings
Automated analytics reduce the time spent on manual tracking, freeing up resources for actual facility improvement.
✅ 6. Predictive Maintenance
Analyzing trends helps predict when issues are likely to occur, reducing unexpected breakdowns.
✅ 7. Customizable and Scalable
Power BI dashboards can grow with your organization — from single-building facilities to multi-location enterprises.
🔧 How to Build a Facilities Management Dashboard in Power BI
Building this dashboard isn’t difficult if you follow a structured approach. Here’s a step-by-step guide:
Step 1: Prepare Your Data in Excel
Create an Excel table with columns like:
-
Request ID
-
Department
-
Issue Type
-
Location
-
Request Date
-
Priority
-
Status
-
Completion Date
Step 2: Import Data into Power BI
Open Power BI → Get Data → Excel → Load your file.
Step 3: Clean and Transform Data
Use Power Query to remove duplicates, correct errors, and ensure consistent data formatting.
Step 4: Create Relationships
Link tables such as Department, Location, and Issues using primary keys.
Step 5: Add Measures and DAX Formulas
Use DAX to calculate metrics such as:
-
Total Requests = COUNT(Request ID)
-
In Progress % = [In Progress Count] / [Total Requests]
-
High Priority % = [High Priority Count] / [Total Requests]
Step 6: Design the Dashboard Pages
Add visuals like bar charts, pie charts, line graphs, and cards to represent your KPIs.
Step 7: Add Slicers and Filters
Include slicers for Month, Department, and Location to make the report interactive.
Step 8: Publish and Share
Publish the dashboard to Power BI Service and share it securely with stakeholders.
🔍 Common Use Cases of Facilities Management Dashboards
Facilities Management Dashboards are versatile and useful across different industries and organizations:
-
Corporate Offices: Monitor maintenance requests across floors and departments.
-
Educational Institutions: Track classroom and lab maintenance.
-
Hospitals: Manage medical equipment maintenance and housekeeping requests.
-
Manufacturing Plants: Oversee machinery upkeep and factory maintenance.
-
Retail Chains: Track facilities performance across multiple store locations.
-
Government Buildings: Maintain public infrastructure and utilities efficiently.
📈 Insights You Can Derive from the Dashboard
With this Power BI dashboard, you can quickly answer key operational questions like:
-
Which department generates the most facility requests?
-
What percentage of issues remain unresolved this month?
-
Which locations have the highest priority complaints?
-
Are maintenance trends improving month over month?
-
How quickly are teams resolving issues?
These insights allow facility leaders to set realistic goals, improve resource allocation, and maintain service quality.
🧠 Best Practices for the Facilities Management Dashboard in Power BI
To get the most out of your dashboard, follow these best practices:
🌟 1. Keep Data Updated
Schedule automatic refreshes so that the dashboard always reflects the latest data.
🌟 2. Use Clear Visuals
Avoid cluttered visuals — use bar charts, line graphs, and cards for clarity.
🌟 3. Define Standard KPIs
Ensure all departments use the same definitions for KPIs to maintain consistency.
🌟 4. Leverage Conditional Formatting
Use color codes (red, yellow, green) to highlight performance status instantly.
🌟 5. Protect Data Privacy
Use Power BI’s role-level security to restrict sensitive data access.
🌟 6. Create Drill-Through Pages
Allow users to click on charts to explore detailed information for specific issues or departments.
🌟 7. Review and Improve Regularly
Continuously gather feedback from users and enhance visuals or calculations as needed.
🧾 Opportunities for Improvement
Even the most powerful dashboard can evolve further. Here are a few ways to enhance your Facilities Management Dashboard:
-
Integrate IoT sensors for real-time facility monitoring.
-
Add AI-driven predictions for maintenance schedules.
-
Enable mobile alerts for urgent requests.
-
Include cost dashboards for better budget control.
-
Incorporate feedback forms for user satisfaction tracking.
🏁 Conclusion
The Facilities Management Dashboard in Power BI is an essential tool for modern organizations. It simplifies complex maintenance operations, improves visibility, and drives efficiency across departments and locations.
By centralizing your facility data, automating performance analysis, and enabling real-time decision-making, Power BI helps you maintain safer, cleaner, and more productive spaces.
Whether you’re managing one building or hundreds, this dashboard gives you the control and insights you need to run your facilities seamlessly.
❓ Frequently Asked Questions (FAQs)
1️⃣ What is a Facilities Management Dashboard used for?
It is used to monitor maintenance activities, track requests, and analyze facility performance across departments and locations.
2️⃣ Can I connect the dashboard to live data?
Yes, Power BI allows you to connect live data sources like Excel, SQL, or IoT sensors for real-time updates.
3️⃣ Is this dashboard suitable for small businesses?
Absolutely. Small and medium organizations can customize this template to fit their scale and data structure.
4️⃣ What types of KPIs can I track in this dashboard?
You can track metrics like total requests, high priority %, resolution time, and monthly trends.
5️⃣ Can this dashboard be shared online?
Yes, once published to Power BI Service, it can be securely shared with team members or stakeholders.
6️⃣ How often should I update the data?
Ideally, schedule a daily or weekly auto-refresh depending on your organization’s activity level.
7️⃣ Does Power BI require coding knowledge?
No, Power BI is user-friendly. You can build dashboards using drag-and-drop visuals and basic DAX formulas.
8️⃣ Can I export dashboard insights to Excel or PDF?
Yes, Power BI allows export options for reports, charts, and tables in multiple formats.
9️⃣ What are the prerequisites to use this dashboard?
You need an Excel dataset containing facility management information and Power BI Desktop installed.
🔟 How can this dashboard improve operational efficiency?
It provides transparency, prioritizes tasks, and highlights problem areas — enabling quicker decisions and better facility management.
Visit our YouTube channel to learn step-by-step video tutorials