Running a fashion boutique today involves far more than selling stylish clothing. You must track sales trends, inventory movement, customer behavior, and profitability at the same time. Therefore, boutique owners and managers need clear, structured, and real-time insights to stay competitive. That is exactly where a Fashion Boutiques KPI Dashboard in Excel becomes essential.
Instead of juggling multiple Excel sheets or relying on guesswork, this dashboard brings all key performance indicators (KPIs) into one centralized and easy-to-use reporting solution. Moreover, it helps you make faster decisions, improve profitability, and optimize daily operations without complex tools.
In this in-depth article, you will learn what a Fashion Boutiques KPI Dashboard in Excel is, why it matters, how it works, and how each worksheet supports better decision-making. Additionally, you will explore its advantages, best practices, and frequently asked questions. By the end, you will clearly understand how this dashboard transforms raw boutique data into actionable business insights.
What Is a Fashion Boutiques KPI Dashboard in Excel?
A Fashion Boutiques KPI Dashboard in Excel is a structured and interactive performance-tracking tool designed specifically for fashion retail businesses. It consolidates all critical KPIs into one Excel file so that boutique owners can monitor performance efficiently.
Instead of switching between sales reports, inventory sheets, and finance files, this dashboard presents all KPIs in a single view. As a result, decision-makers gain instant clarity and control.
Moreover, because the dashboard uses Excel, it remains simple, flexible, and cost-effective. You can update data easily, customize KPIs, and share reports without advanced technical skills.
Why Do Fashion Boutiques Need a KPI Dashboard?
Fashion boutiques operate in a highly dynamic environment. Trends change quickly, customer preferences evolve, and inventory cycles remain short. Therefore, relying on intuition alone often leads to missed opportunities and avoidable losses.
A KPI dashboard solves this problem by providing:
- Real-time performance visibility
- Clear comparison between targets and actual results
- Trend analysis across months and years
- Structured decision support
As a result, boutique owners can react faster, plan better, and grow sustainably.
What KPIs Does a Fashion Boutique Track?
A Fashion Boutiques KPI Dashboard in Excel typically tracks KPIs such as:
- Total Sales Revenue
- Sales Growth %
- Average Order Value
- Inventory Turnover
- Gross Profit Margin
- Sell-Through Rate
- Stock Aging
- Monthly and Year-to-Date Performance
Because all KPIs remain configurable, boutiques can adapt the dashboard to their unique business goals.
How Does the Fashion Boutiques KPI Dashboard in Excel Work?
This dashboard follows a structured worksheet design. Each worksheet serves a specific purpose and connects seamlessly with others. Therefore, data flows smoothly from input sheets to analysis and visualization pages.
Let us explore each worksheet in detail.
What Is the Summary Page in the Fashion Boutiques KPI Dashboard?
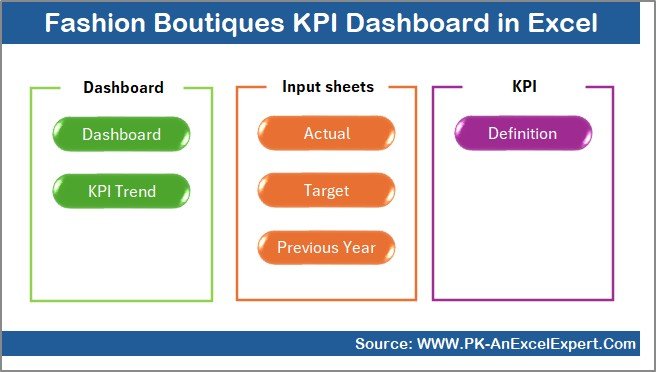
Summary Page (Index Sheet)
The Summary Page acts as the navigation hub of the dashboard. It allows users to move quickly between worksheets using buttons.
Key Highlights of the Summary Page
- Acts as an index for the entire dashboard
- Contains six navigation buttons
- Enables quick access to all major sheets
- Improves usability and user experience
Because of this structure, even non-technical users can navigate the dashboard confidently.
Dashboard Sheet
Dashboard Sheet Tab (Main Dashboard)
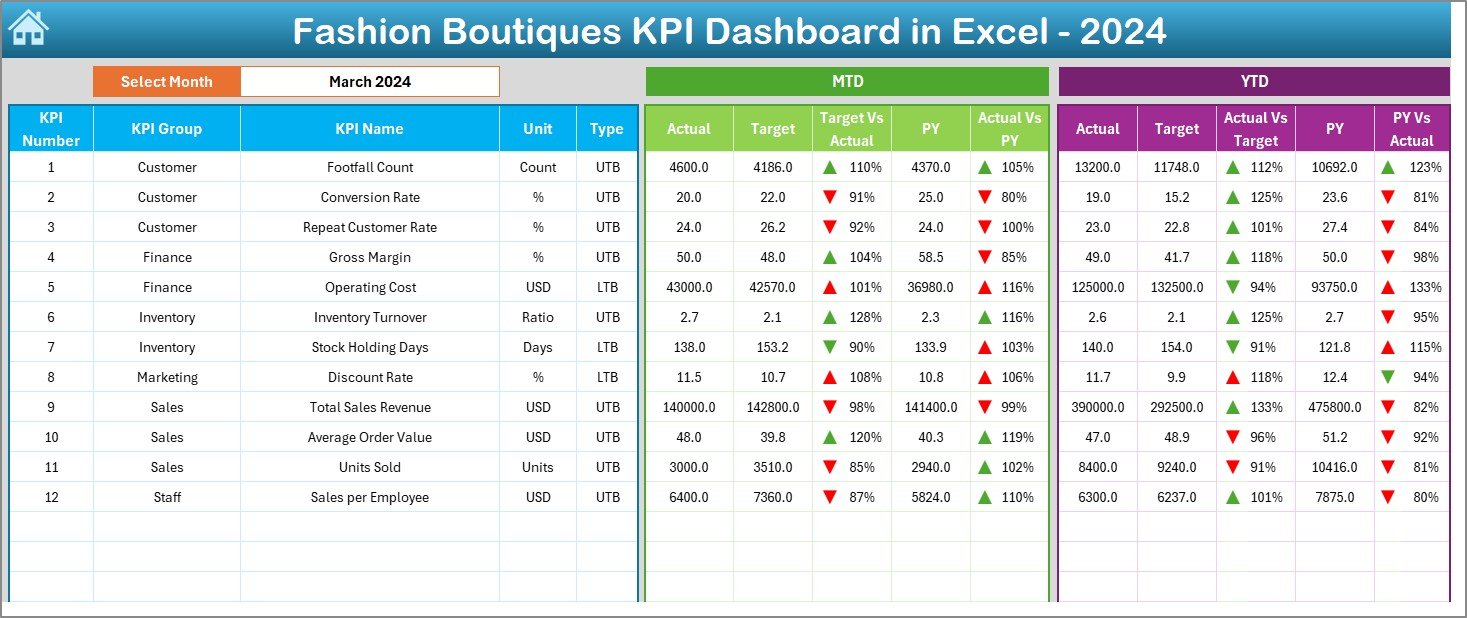
The Dashboard Sheet is the heart of the Fashion Boutiques KPI Dashboard in Excel. It displays all KPIs in a visually structured format.
Key Features of the Dashboard Sheet
- Month selection drop-down at cell D3
- Dynamic update of all KPIs based on selected month
- Clear presentation of MTD and YTD metrics
KPIs Displayed on the Dashboard
Month-to-Date (MTD):
- Actual
- Target
- Previous Year
- Target vs Actual
- Previous Year vs Actual
Year-to-Date (YTD):
- Actual
- Target
- Previous Year
- Target vs Actual
- Previous Year vs Actual
Visual Enhancements
- Conditional formatting with up and down arrows
- Instant identification of performance gaps
- Easy comparison across time periods
As a result, boutique owners can instantly see where performance exceeds expectations and where corrective action is required.
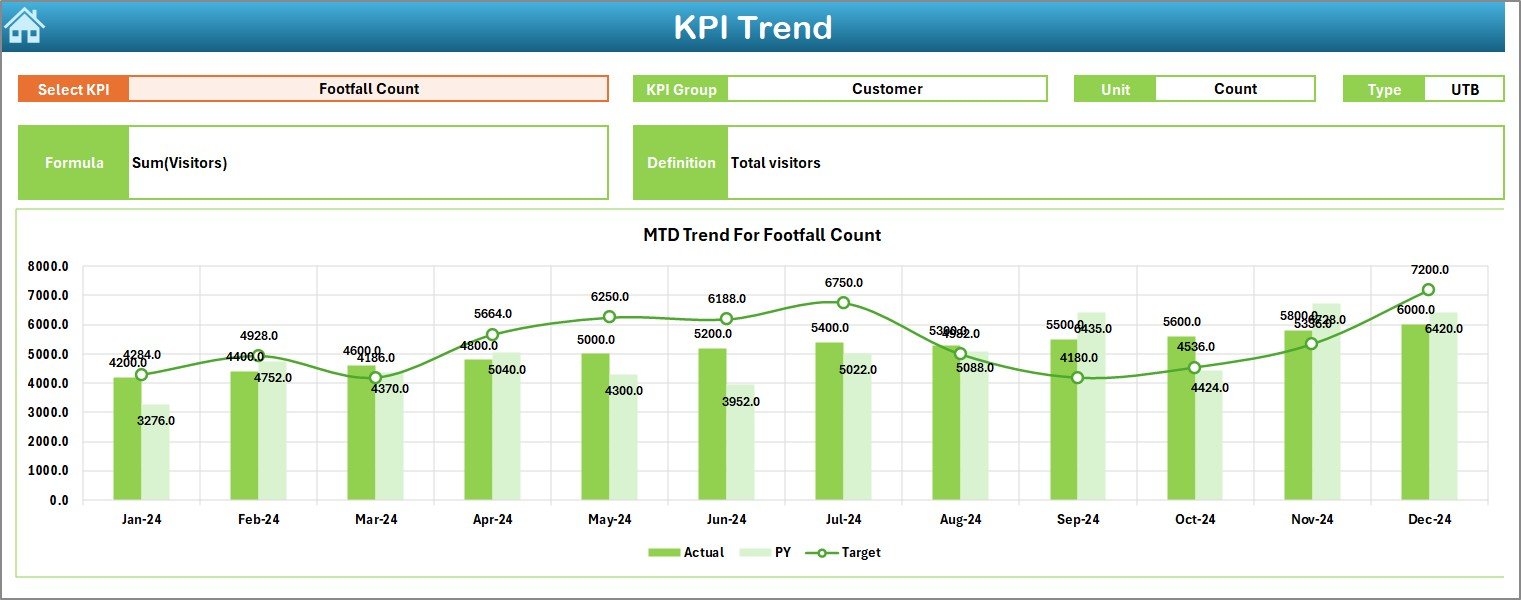
How Does the Trend Sheet Help in Performance Analysis?
Trend Sheet Tab
The Trend Sheet provides deep analytical insight into individual KPIs over time. Instead of viewing aggregated numbers, users can analyze each KPI separately.
Key Features of the Trend Sheet
- KPI selection drop-down at cell C3
- Automatic display of KPI details such as:
KPI Group
Unit of Measurement
KPI Type (Lower the Better or Upper the Better)
KPI Formula
KPI Definition
Trend Analysis Charts
MTD trend chart for Actual, Target, and Previous Year
- YTD trend chart for Actual, Target, and Previous Year
Because of this structure, boutique managers can quickly identify trends, seasonality, and performance patterns.
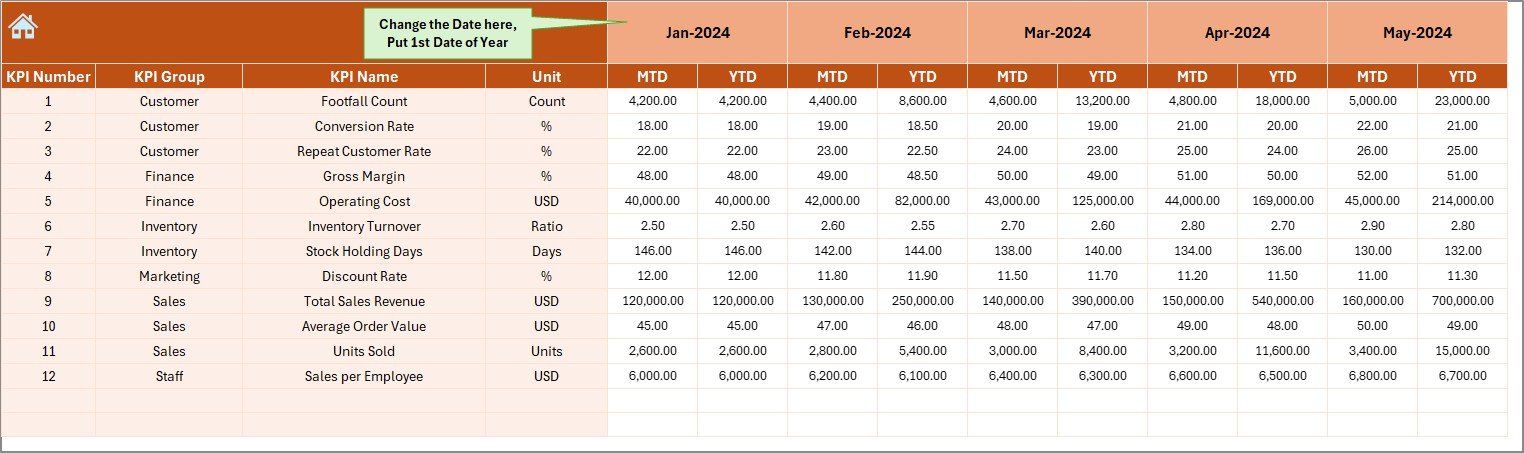
Where Do You Enter Actual KPI Data?
Actual Numbers Input Sheet
The Actual Numbers Input Sheet serves as the primary data entry point for current performance.
How This Sheet Works
- Enter actual KPI values for each month
- Supports both MTD and YTD data
- Month selection at cell E1
- Requires entering the first month of the year at E1
Once users enter data, all dashboard visuals update automatically. Therefore, the reporting process remains fast and reliable.
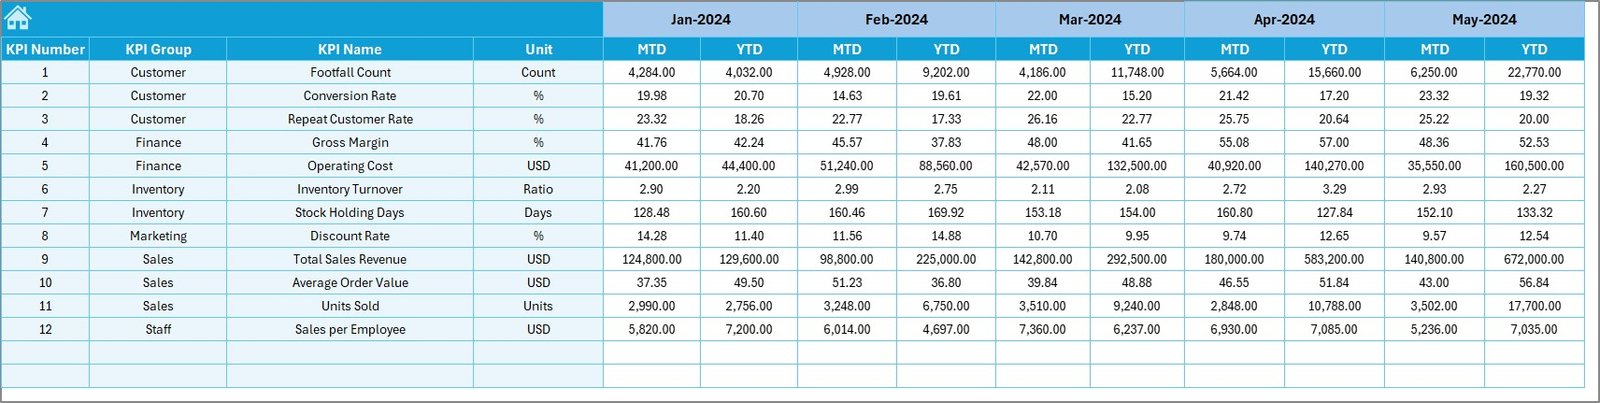
How Do You Manage Targets in the Dashboard?
Target Sheet Tab
The Target Sheet stores planned KPI values. It allows boutiques to define goals clearly for each month.
Key Functions of the Target Sheet
- Enter monthly target values
- Supports both MTD and YTD targets
- Enables performance benchmarking
- Supports proactive decision-making
Because targets remain visible alongside actuals, teams stay aligned with business objectives.
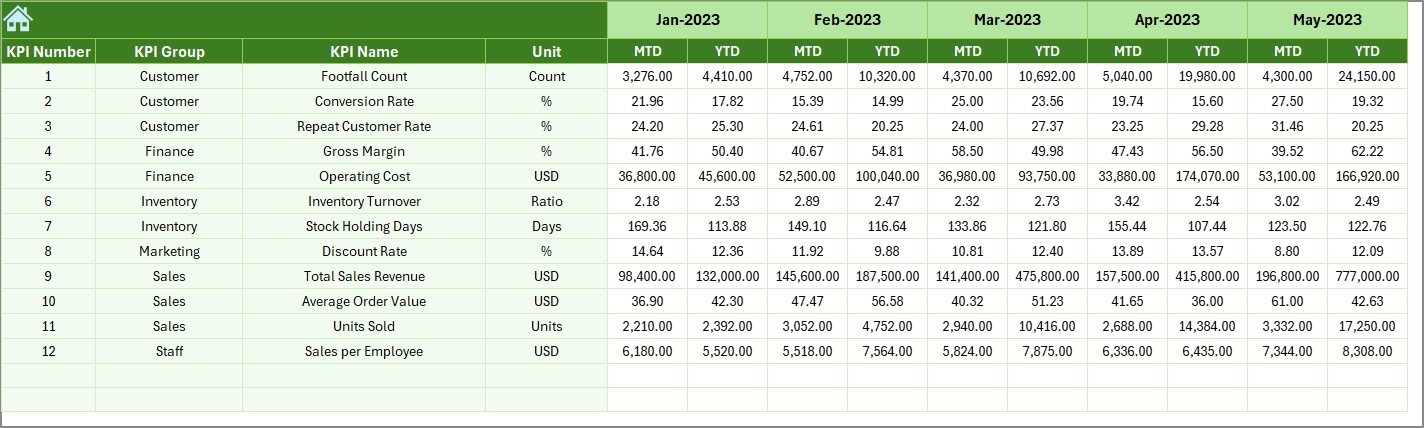
Why Is the Previous Year Sheet Important?
Previous Year Number Sheet Tab
The Previous Year Sheet allows boutiques to compare current performance with historical data.
Benefits of Previous Year Comparison
- Identifies growth or decline trends
- Supports year-over-year analysis
- Improves forecasting accuracy
- Highlights seasonal patterns
By entering previous year values in the same format as current data, boutiques gain deeper analytical insights.
What Is the Purpose of the KPI Definition Sheet?
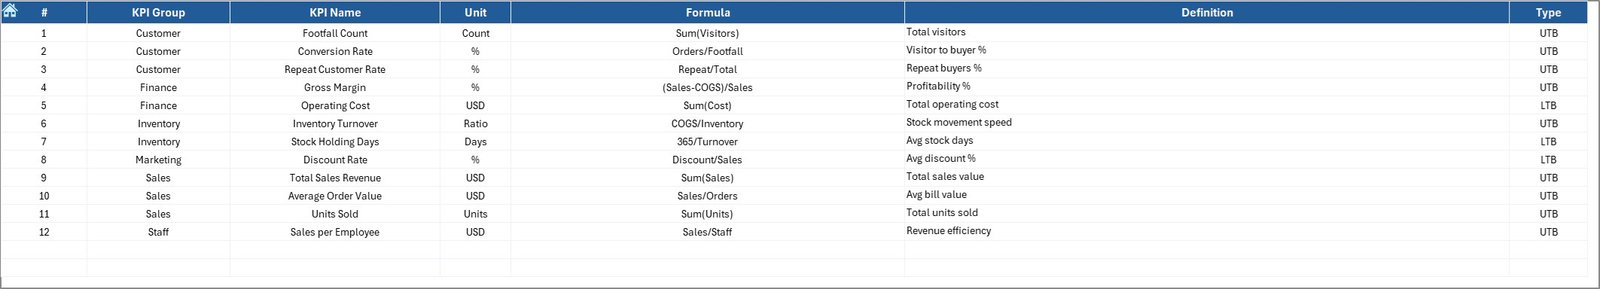
KPI Definition Sheet Tab
The KPI Definition Sheet acts as a reference guide for all KPIs used in the dashboard.
Information Stored in This Sheet
- KPI Name
- KPI Group
- Unit of Measurement
- KPI Formula
- KPI Definition
Because of this sheet, all stakeholders clearly understand each KPI. As a result, confusion and misinterpretation reduce significantly.
Advantages of Fashion Boutiques KPI Dashboard in Excel
Using a Fashion Boutiques KPI Dashboard in Excel offers several powerful advantages.
Key Advantages
- Centralized Performance View
All KPIs remain available in one structured dashboard. - Time-Saving Reporting
Automated calculations eliminate manual work. - Target vs Actual Clarity
Conditional formatting highlights performance gaps instantly. - Trend-Based Decision Making
MTD and YTD trends support strategic planning. - User-Friendly Design
Excel familiarity reduces training requirements. - Cost-Effective Solution
No need for expensive BI tools or subscriptions.
Because of these benefits, boutiques can focus more on growth and less on reporting effort.
Opportunities for Improvement in the Dashboard
Although the dashboard delivers strong value, boutiques can enhance it further.
Possible Enhancements
- Add category-wise or brand-wise analysis
- Include store-level or channel-level KPIs
- Integrate automated data imports
- Add inventory aging visuals
- Include customer retention metrics
These improvements can further strengthen performance visibility.
Best Practices for the Fashion Boutiques KPI Dashboard in Excel
Following best practices ensures maximum value from the dashboard.
Best Practices
- Update data regularly and consistently
- Define realistic and measurable targets
- Review dashboard weekly or monthly
- Keep KPI definitions clear and standardized
- Use trend insights for planning inventory and promotions
- Avoid tracking too many KPIs at once
By following these practices, boutiques can maintain accuracy, relevance, and usability.
How Does This Dashboard Improve Decision-Making?
This dashboard improves decision-making by:
- Highlighting underperforming KPIs early
- Supporting proactive inventory planning
- Improving sales forecasting accuracy
- Aligning teams with business goals
- Reducing dependency on intuition
Therefore, boutique owners gain confidence in every decision they make.
Conclusion: Why Every Fashion Boutique Needs This Dashboard
A Fashion Boutiques KPI Dashboard in Excel acts as a powerful business companion for modern retail operations. It transforms raw data into meaningful insights while keeping reporting simple and structured.
Because it combines flexibility, clarity, and affordability, this dashboard suits both small boutiques and growing fashion retailers. Moreover, it empowers decision-makers to track performance, manage targets, and improve profitability with confidence.
If you want better control over your boutique’s performance, this dashboard offers the clarity you need.
Frequently Asked Questions (FAQs)
What is a Fashion Boutiques KPI Dashboard in Excel?
A Fashion Boutiques KPI Dashboard in Excel is a structured reporting tool that tracks key retail performance metrics in one interactive Excel file.
Who can use this dashboard?
Boutique owners, store managers, sales teams, and finance teams can use this dashboard easily.
Does the dashboard support monthly and yearly analysis?
Yes, it supports both Month-to-Date (MTD) and Year-to-Date (YTD) analysis.
Can I customize the KPIs?
Yes, you can easily add, remove, or modify KPIs based on your boutique’s needs.
Do I need advanced Excel skills to use it?
No, basic Excel knowledge is enough to operate and update the dashboard.
How often should I update the dashboard?
You should update it monthly or weekly depending on your reporting cycle.
Is this dashboard suitable for multi-store boutiques?
Yes, with minor customization, it can support multi-store or multi-channel analysis.
Can this dashboard replace BI tools?
For many small and medium boutiques, it can effectively replace expensive BI tools.
Visit our YouTube channel to learn step-by-step video tutorials
Watch the step-by-step video tutorial: