The fashion industry runs on creativity, speed, and data. Every design, production run, and retail sale reflects a series of decisions that determine profitability and brand success. To manage this complex ecosystem effectively, fashion businesses must rely on measurable performance indicators.
That’s where the Fashion KPI Scorecard in Excel comes in.
This powerful and easy-to-use tool helps fashion manufacturers, retailers, and designers measure key performance indicators (KPIs) such as production efficiency, quality standards, on-time delivery, sales performance, and customer satisfaction. It turns raw numbers into actionable insights — empowering teams to track goals, identify trends, and make data-backed decisions.
In this article, we’ll explore everything about the Fashion KPI Scorecard in Excel — its structure, features, advantages, and best practices. You’ll also find frequently asked questions to help you use it effectively in your fashion business.
Click to Purchases Fashion KPI Scorecard in Excel
🧵 What Is a Fashion KPI Scorecard in Excel?
A Fashion KPI Scorecard in Excel is a digital performance tracking tool that organizes key business metrics across design, production, supply chain, and retail operations. It provides a central platform where fashion professionals can visualize their progress toward strategic goals.
Using Microsoft Excel’s flexibility, you can compare Actual vs Target performance for each KPI, view Month-to-Date (MTD) and Year-to-Date (YTD) metrics, and analyze historical trends — all in one place.
Whether you’re monitoring production efficiency, inventory turnover, or sales growth, this scorecard makes it simple to see what’s working and what needs improvement.
🪡 Key Features of the Fashion KPI Scorecard in Excel
This ready-to-use template includes four main worksheets, each designed for a specific function. Together, they make fashion performance tracking both visual and data-driven.
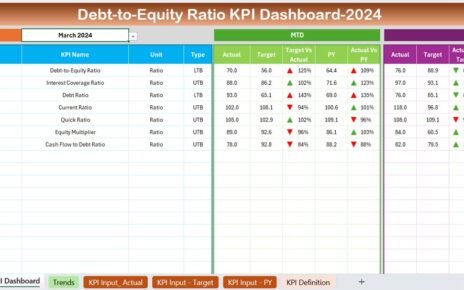
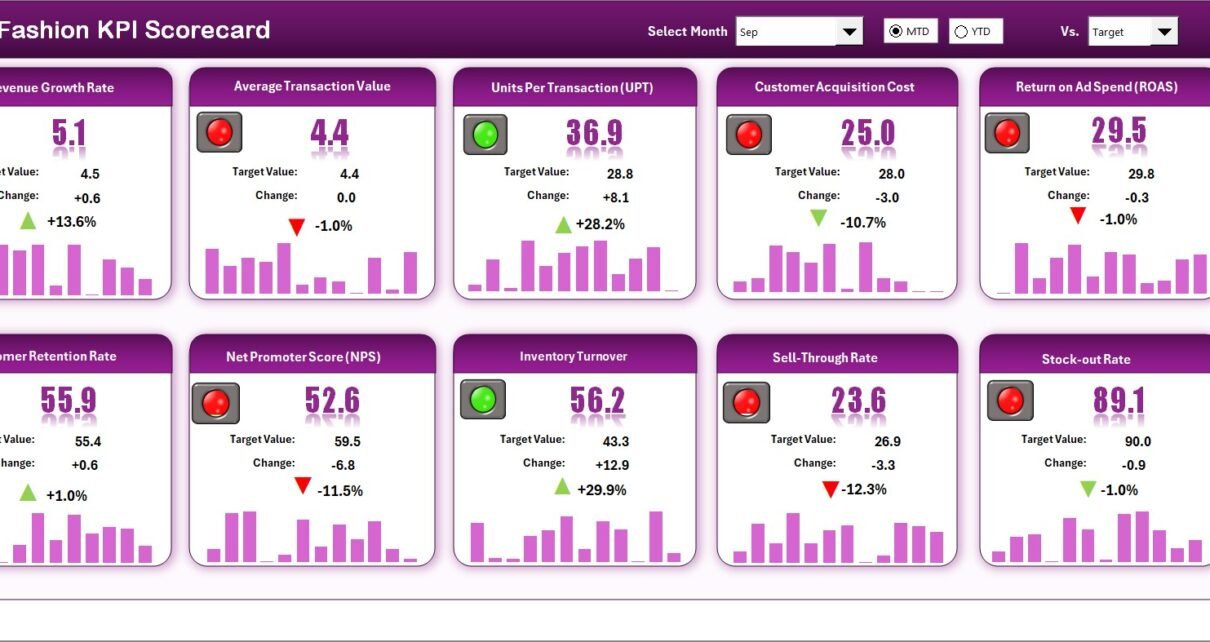
1️⃣ Scorecard Sheet
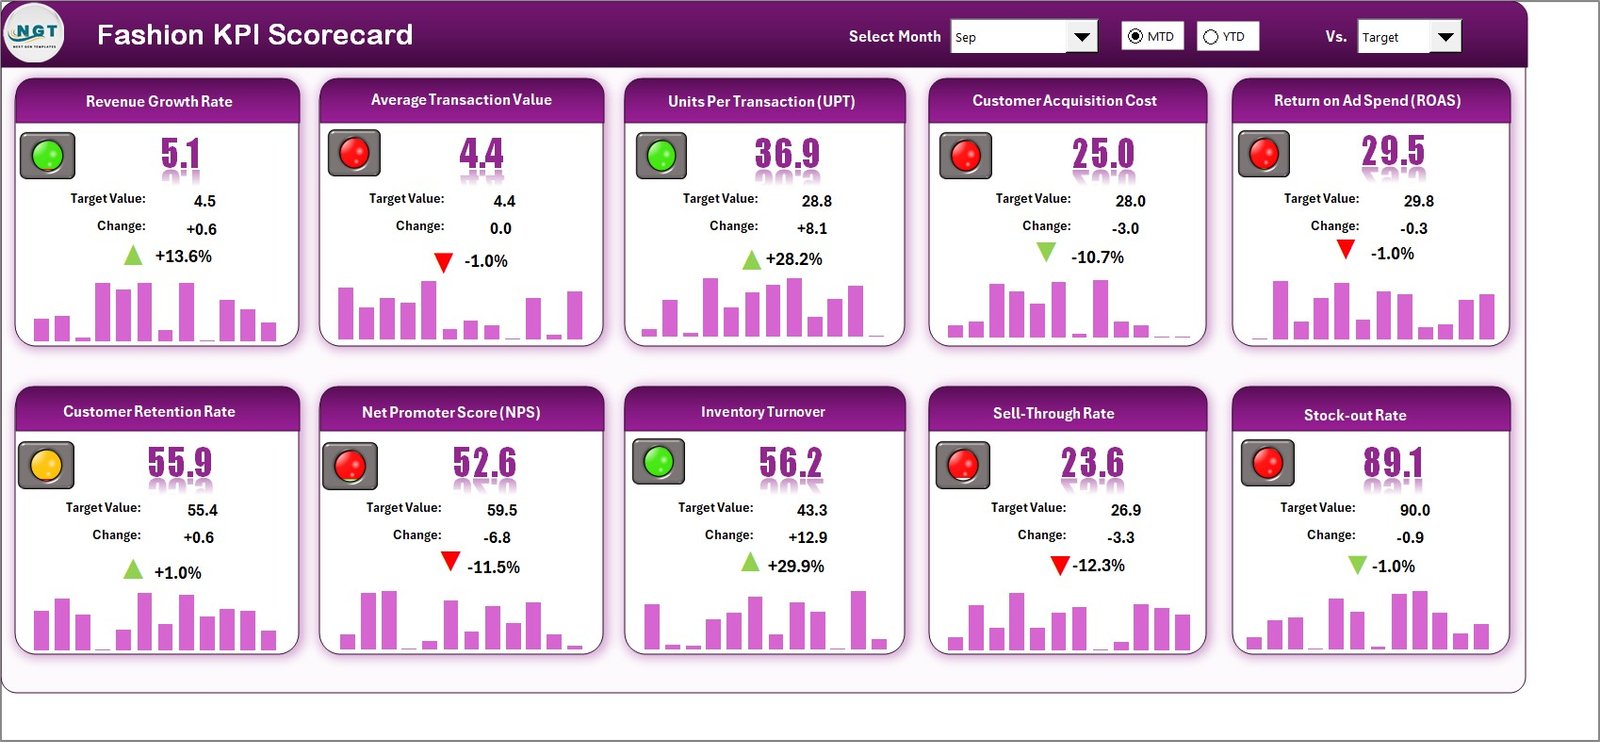
The Scorecard Sheet is the main dashboard of the template. It gives a quick snapshot of fashion KPIs through interactive dropdowns and color-coded visuals.
Key highlights:
-
Dropdown Menus: Select a specific month or toggle between MTD and YTD performance views.
-
Actual vs Target Comparison: Measure how well your team is meeting targets for each KPI.
-
Visual Indicators: Use conditional formatting and color codes (e.g., green for success, red for below target) for instant insights.
-
Comprehensive Overview: Get a full list of KPIs showing both MTD and YTD progress for better transparency.
This sheet helps managers and designers stay informed at a glance, without needing complex dashboards or BI tools.
2️⃣ KPI Trend Sheet
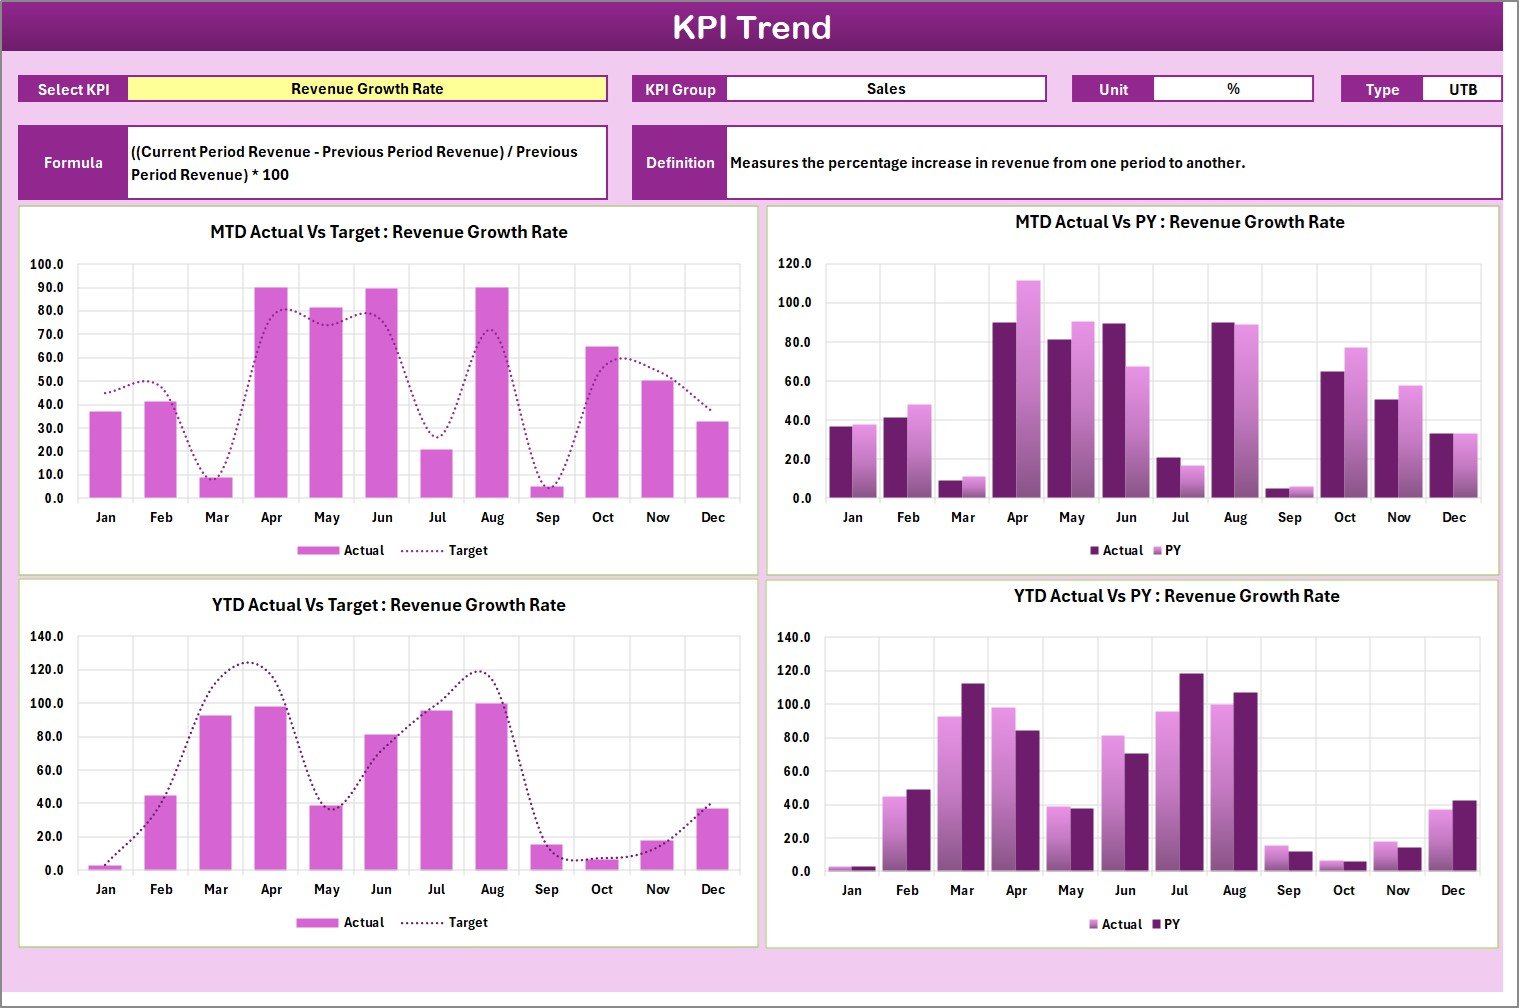
The KPI Trend Sheet helps you dive deeper into each KPI to study patterns and variations over time.
Features include:
-
Dropdown Selection: Pick a KPI from the list (cell C3) to view its detailed data.
-
KPI Information: Displays KPI Group, Unit, Type (Lower the Better or Upper the Better), Formula, and Definition.
-
MTD & YTD Trend Charts: Track Actual, Target, and Previous Year (PY) performance through easy-to-read line or column charts.
This tab reveals seasonal patterns, identifies performance gaps, and highlights which KPIs consistently hit their targets.
3️⃣ Input Data Sheet
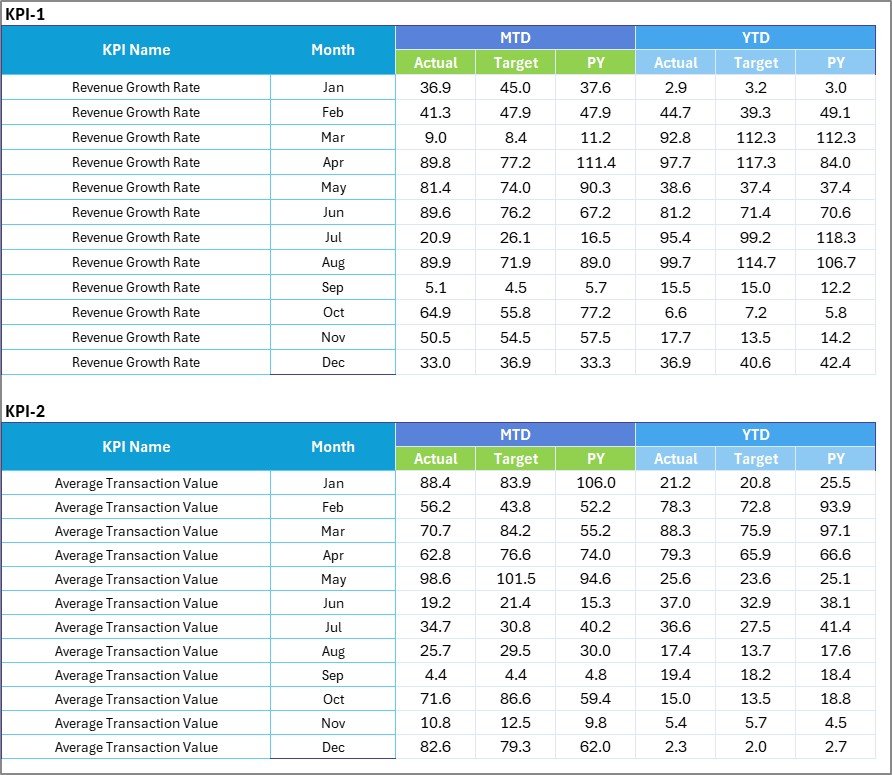
The Input Data Sheet is the foundation of your scorecard. It’s where all the numbers live.
Functions:
-
Data Entry: Record monthly Actuals and Targets for each KPI.
-
Simple Structure: Organized columns make data input quick and error-free.
-
Dynamic Updates: As you enter new data, the scorecard and trend sheets update automatically.
Keeping this sheet accurate ensures your entire scorecard reflects the latest business performance.
4️⃣ KPI Definition Sheet
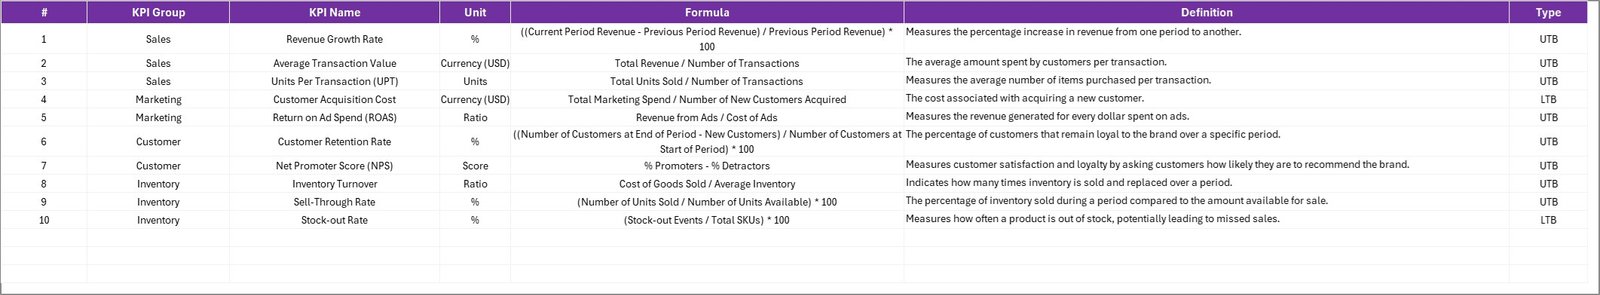
This sheet is your reference library — ensuring all KPIs are clearly defined and standardized across departments.
It includes:
-
KPI Name & Group: Categorizes each KPI (e.g., Sales, Quality, Design, or Supply Chain).
-
Unit: Defines measurement units such as %, USD, or Units Sold.
-
Formula & Definition: Explains how each KPI is calculated.
This structure ensures everyone — from production supervisors to merchandisers — interprets performance metrics consistently.
🧵 Why Is a KPI Scorecard Important in Fashion?
The fashion business operates at lightning speed. Trends shift overnight, supply chains stretch across continents, and customers expect quality and sustainability. A KPI Scorecard helps navigate this complexity through data-driven control.
Here’s why it matters:
-
Transparency: Everyone can see how their department is performing.
-
Speed: Quick insights replace time-consuming manual reports.
-
Accountability: Each KPI links directly to a responsible department.
-
Efficiency: Track which areas deliver maximum output for minimum cost.
-
Continuous Improvement: Analyze trends to identify long-term improvements.
👠 Common KPIs in Fashion Industry Scorecards
To make your Fashion KPI Scorecard in Excel effective, include metrics from different business areas:
1. Sales & Retail KPIs
-
Total Sales (USD)
-
Gross Profit Margin (%)
-
Conversion Rate (%)
-
Average Order Value (AOV)
-
Return Rate (%)
2. Production & Quality KPIs
-
On-Time Delivery (%)
-
Production Efficiency (%)
-
Defect Rate (%)
-
Rework Hours (hrs)
-
Sample Approval Rate (%)
3. Inventory & Supply Chain KPIs
-
Inventory Turnover Ratio
-
Order Fulfillment Time (days)
-
Raw Material Wastage (%)
-
Supplier On-Time Performance (%)
4. Design & Merchandising KPIs
-
New Collection Launch Rate (%)
-
Design-to-Market Time (days)
-
Trend Forecast Accuracy (%)
-
Sampling Cost per Style (USD)
5. Sustainability & CSR KPIs
-
Fabric Waste Reduction (%)
-
Sustainable Material Usage (%)
-
Carbon Footprint Reduction (%)
-
Ethical Supplier Ratio (%)
These KPIs create a complete performance picture — from the sketchboard to the storefront.
🧵 How to Use the Fashion KPI Scorecard in Excel
Follow these steps to make the most of this tool:
-
Set Up KPI Definitions:
Start by listing all KPIs with clear formulas and units in the KPI Definition Sheet. -
Input Monthly Data:
Enter Actual and Target values for each KPI in the Input Data Sheet. -
Analyze the Scorecard Sheet:
Use dropdowns to switch between months or MTD/YTD data and review visual indicators. -
Study Trends:
Go to the KPI Trend Sheet to identify monthly or yearly changes in performance. -
Review & Act:
Discuss results in management meetings and take corrective actions wherever performance falls short.
✨ Advantages of Fashion KPI Scorecard in Excel
The benefits of using this scorecard extend across departments — from production to marketing.
✅ 1. Real-Time Monitoring
You can instantly see how KPIs are performing across teams and time periods.
✅ 2. Visual Performance Insights
Color-coded visuals and charts make understanding data easy — even for non-analysts.
✅ 3. Easy Customization
You can add or modify KPIs, formulas, and visuals without needing technical expertise.
✅ 4. Cost-Effective Solution
Unlike costly BI tools, Excel offers a budget-friendly yet powerful performance management option.
✅ 5. Enhanced Collaboration
Teams can share and update data simultaneously through cloud storage.
✅ 6. Improved Decision-Making
The scorecard provides actionable insights that lead to faster, data-backed business decisions.
Click to Purchases Fashion KPI Scorecard in Excel
🧷 Opportunities for Improvement
Even though this Excel-based scorecard is powerful, it can always evolve further:
-
🧩 Automation: Add VBA scripts or macros for auto-refresh and dynamic chart updates.
-
🪶 Integration: Connect with external systems (ERP, POS) for live data imports.
-
💎 Advanced Visualization: Link your data to Power BI for deeper insights and professional visuals.
-
🪡 Data Validation: Use dropdowns and formulas to reduce data entry errors.
-
📈 Scalability: Expand the scorecard as your brand grows or as new KPIs emerge.
👚 Best Practices for Using the Fashion KPI Scorecard
Follow these proven practices to maximize the effectiveness of your KPI Scorecard:
🧵 1. Set Clear Goals
Always start with well-defined business goals. KPIs should align directly with these objectives.
🧵 2. Use SMART KPIs
Each KPI must be Specific, Measurable, Achievable, Relevant, and Time-bound.
🧵 3. Standardize Data Entry
Maintain consistent data formats and units to prevent calculation errors.
🧵 4. Review Monthly
Hold regular KPI review meetings to track progress and set new targets.
🧵 5. Highlight Key Metrics
Use charts, icons, or colors to bring critical KPIs into focus.
🧵 6. Encourage Cross-Department Collaboration
Involve all stakeholders — from designers to finance teams — in KPI review sessions.
🧵 7. Maintain Data Security
Protect your Excel workbook with passwords and maintain backup copies regularly.
👜 Example: Using the Scorecard in a Fashion Brand
Imagine a mid-sized fashion retailer tracking On-Time Delivery and Return Rate through the KPI Scorecard.
In one quarter, the Return Rate (%) rises from 4% to 9%. The KPI Trend Sheet shows that returns peak right after the summer sale. The KPI Definition Sheet reveals that most returns are due to size inconsistencies.
Based on these insights, the production team reviews measurement standards, introduces a new size chart, and by next quarter, returns drop to 5%.
This example shows how real-time tracking and analysis using Excel can drive meaningful improvement.
Click to Purchases Fashion KPI Scorecard in Excel
👗 Conclusion
The Fashion KPI Scorecard in Excel is more than just a spreadsheet — it’s a performance compass for your fashion business. By centralizing key metrics across production, sales, quality, and sustainability, it empowers decision-makers to act quickly and confidently.
This tool helps you stay competitive in a fast-changing industry where precision, creativity, and timing matter most. With its dynamic charts, easy updates, and affordable setup, the Fashion KPI Scorecard bridges the gap between intuition and intelligence — helping you build a stronger, more efficient fashion operation.
🧵 Frequently Asked Questions (FAQs)
1. What is a Fashion KPI Scorecard?
It’s a data-driven Excel template that tracks the key performance indicators of a fashion business, such as sales, quality, and production.
2. Can I customize the KPIs?
Yes. You can add or remove KPIs based on your brand’s operations, such as e-commerce, retail, or manufacturing.
3. Does it require advanced Excel knowledge?
No. It’s designed with simple formulas, dropdowns, and charts, making it easy for anyone to use.
4. Can I view month-wise and year-wise data?
Yes. The Scorecard Sheet allows you to switch between Month-to-Date (MTD) and Year-to-Date (YTD) metrics.
5. How is the trend analysis done?
The KPI Trend Sheet shows charts comparing Actual, Target, and Previous Year (PY) performance.
6. Can I share the scorecard with my team?
Yes. You can store it on OneDrive or Google Drive for shared access and collaboration.
7. What are the common KPIs used in fashion?
Examples include On-Time Delivery, Sales Growth, Production Efficiency, Defect Rate, and Customer Return Rate.
8. How often should I update the scorecard?
You should update it monthly or after each production cycle for accuracy.
9. Can this scorecard handle multiple stores or locations?
Yes. You can add filters or separate sheets for each branch or region.
10. Is this scorecard suitable for small brands?
Absolutely! It’s flexible, affordable, and scales easily as your business grows.
Click to Purchases Fashion KPI Scorecard in Excel
Visit our YouTube channel to learn step-by-step video tutorials