In today’s fast-moving retail industry, fast fashion brands must monitor performance metrics in real time to stay competitive. From analyzing sales trends and discount strategies to tracking customer satisfaction, every data point helps brands make better business decisions.
To simplify this process, the Fast Fashion Brands Dashboard in Excel offers a ready-to-use, data-driven solution that transforms complex fashion analytics into clear, actionable insights.
This dashboard empowers retail managers, analysts, and brand strategists to visualize business performance, monitor profitability, and identify improvement areas—all within Microsoft Excel.
Click to Purchases Fast Fashion Brands Dashboard in Excel
🪄 What Is a Fast Fashion Brands Dashboard in Excel?
A Fast Fashion Brands Dashboard in Excel is a dynamic and interactive performance analysis tool designed specifically for fashion retailers. It brings together key performance indicators (KPIs) related to orders, payments, profits, customer ratings, and discounts.
By consolidating all data in one Excel file, this dashboard provides a clear, visual overview of how a fashion brand—or multiple brands—is performing across different seasons, payment modes, and sales channels.
It eliminates manual reporting and provides instant visibility into trends like:
-
📈 Monthly order values and customer ratings
-
💵 Profit margins across regions and brands
-
💳 Payment mode performance
-
🧥 Seasonal discount impact on profitability
In short, it’s an intelligent Excel template that converts raw sales and customer data into interactive charts and decision-ready visuals.
🌍 Why Fast Fashion Brands Need an Excel Dashboard
The fashion industry thrives on speed and adaptability. As consumer trends shift rapidly, brand managers must analyze sales and operational performance quickly. A well-structured dashboard bridges this gap by providing real-time insights into what’s driving sales and what’s not.
Without such a system, businesses may face:
-
Inefficient tracking of multi-brand sales
-
Delayed decision-making
-
Inconsistent reporting between regions or departments
-
Missed opportunities due to lack of trend visibility
The Fast Fashion Brands Dashboard in Excel solves all these challenges by simplifying performance analytics into one unified interface.
Click to Purchases Fast Fashion Brands Dashboard in Excel
🧭 Structure of the Fast Fashion Brands Dashboard in Excel
The dashboard consists of five analytical pages and two support sheets, ensuring that every business dimension—sales, payment, seasonality, and brand performance—is covered.
🗂️ Page Navigator
Located on the left side, the Page Navigator enables seamless movement between different analysis pages. With just one click, you can switch from “Brand Analysis” to “Season Analysis” or “Monthly Trends,” making exploration smooth and intuitive.
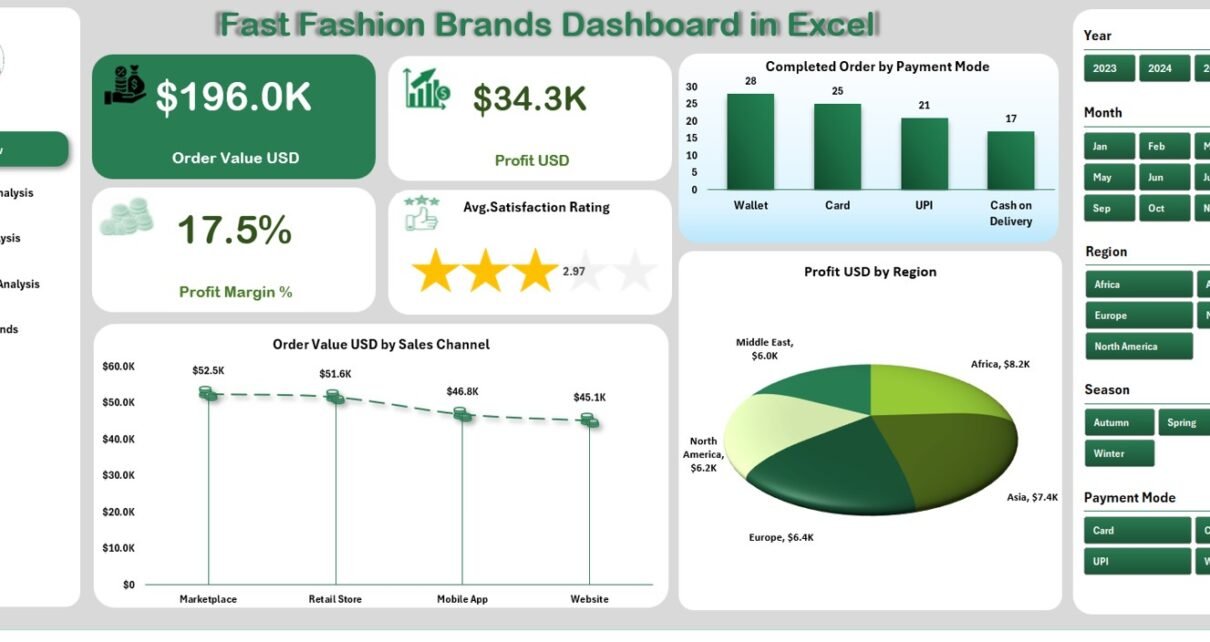
1️⃣ Overview Page
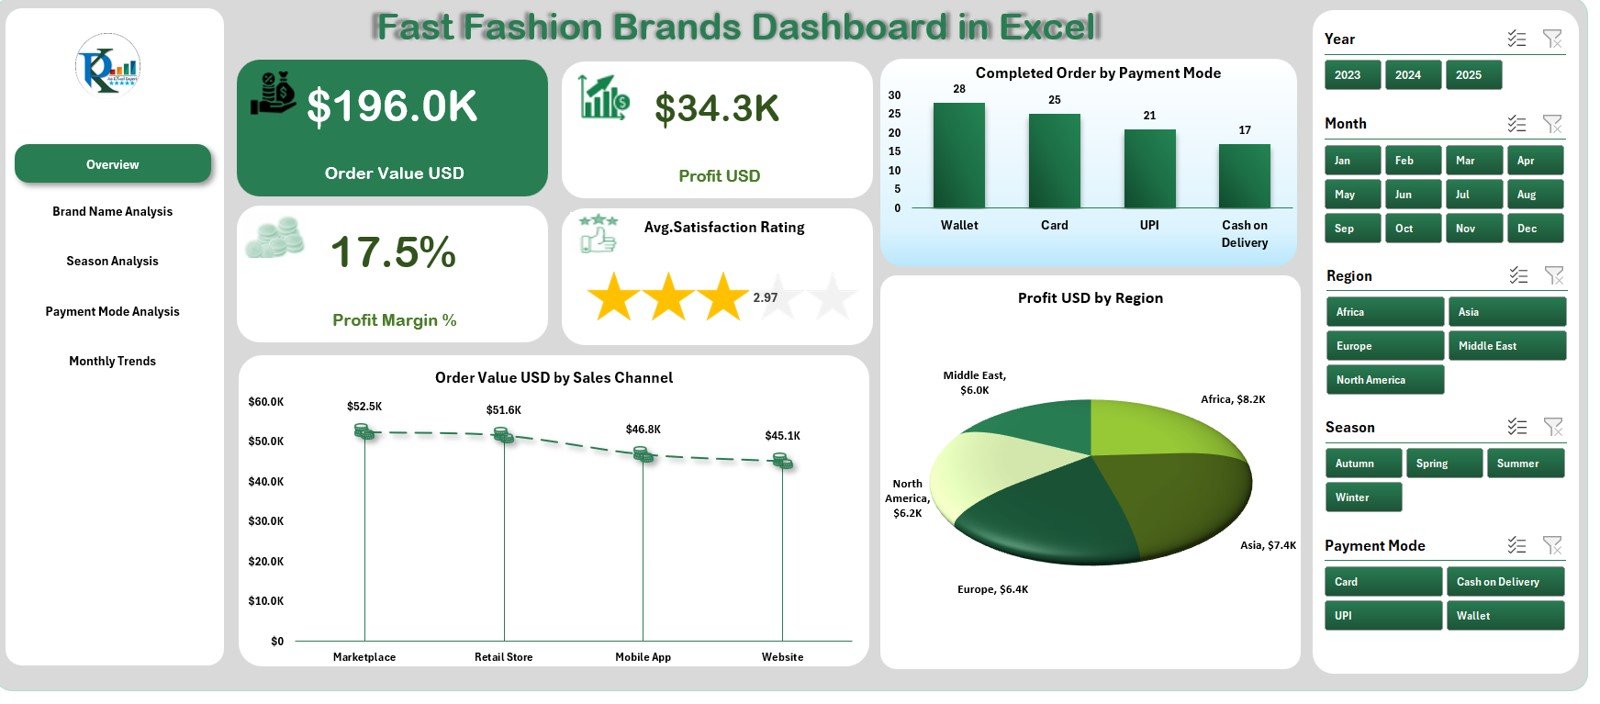
The Overview Page serves as the central summary view of the dashboard. It offers a quick glance at essential KPIs, allowing decision-makers to understand business performance instantly.
Key elements include:
-
4 KPI Cards:
Display metrics like total orders, total revenue (USD), average profit margin, and customer satisfaction rating. -
3 Dynamic Charts:
-
Completed Orders by Payment Mode – See which payment options are most popular.
-
Order Value (USD) by Sales Channel – Analyze performance across online, in-store, or marketplace channels.
-
Profit (USD) by Region – Evaluate geographical profitability.
-
This page is designed to offer a bird’s-eye view of brand health—ideal for executives and senior management.
2️⃣ Brand Name Analysis
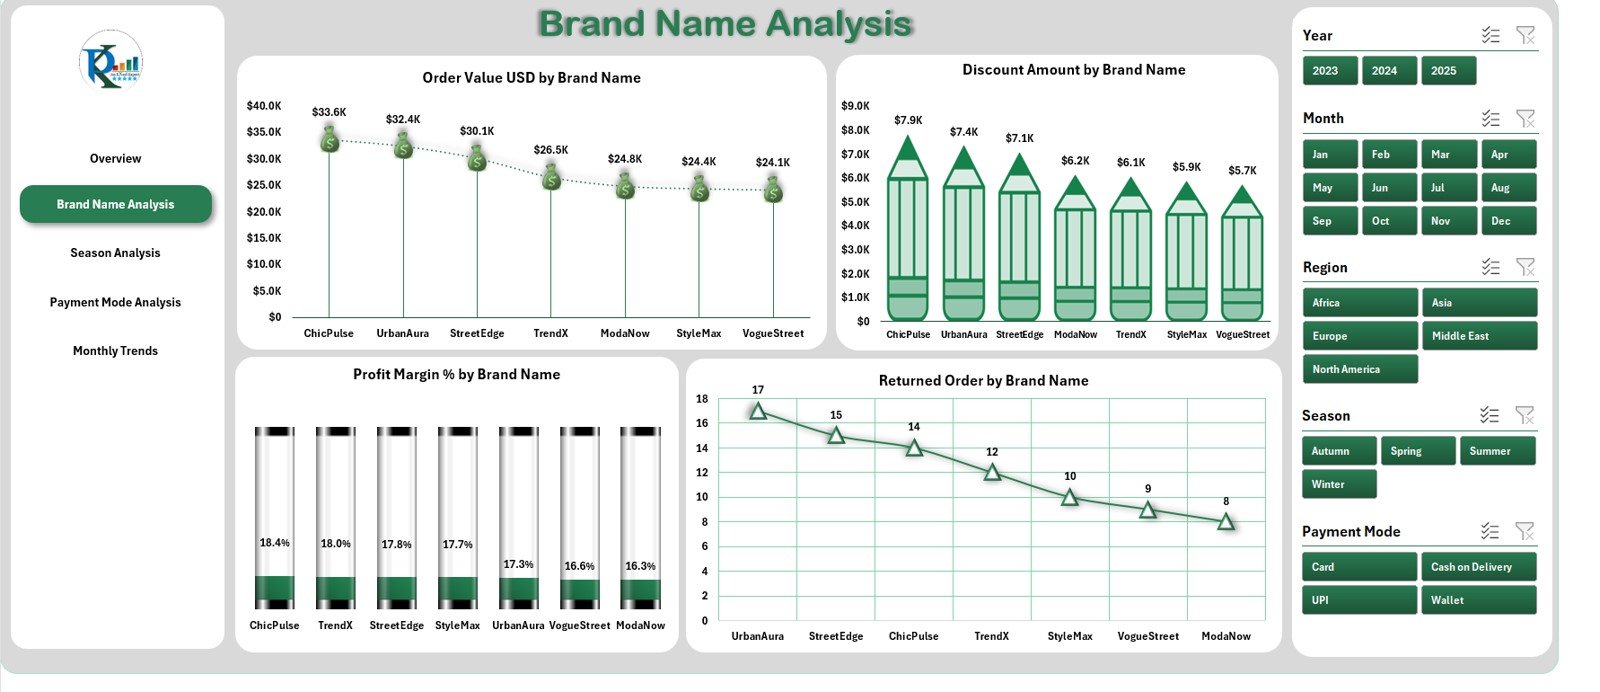
This page focuses on brand-wise performance analysis, ideal for multi-brand fashion retailers or conglomerates.
Main components include:
-
Order Value (USD) by Brand Name: Quickly spot top-selling brands.
-
Discount Amount by Brand Name: Understand discount strategies and their impact.
-
Profit Margin (%) by Brand Name: Evaluate profitability per brand.
-
Returned Orders by Brand Name: Monitor product return trends and identify quality or sizing issues.
By comparing multiple brands side by side, you can easily identify which ones drive the most value and which need marketing or operational attention.
3️⃣ Season Analysis
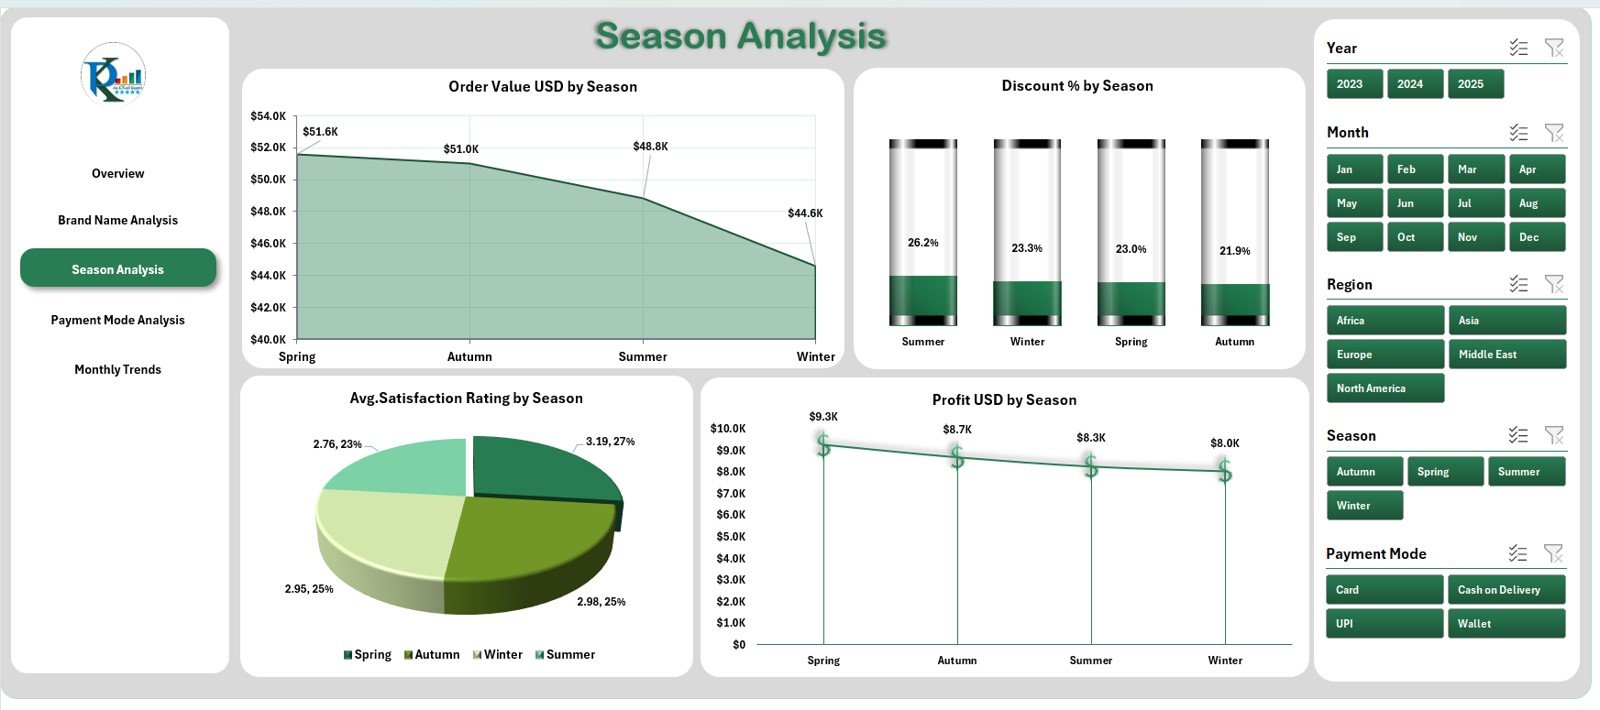
Fashion trends often depend on seasonal variations—what sells in summer may not perform in winter.
The Season Analysis page captures this trend visually. It includes:
-
Order Value (USD) by Season: Compare sales volume across Spring, Summer, Fall, and Winter.
-
Discount % by Season: Measure how seasonal promotions influence buying behavior.
-
Average Satisfaction Rating by Season: Gauge customer sentiment across seasons.
-
Profit (USD) by Season: Understand which time of year yields the best profits.
This section empowers teams to plan seasonal campaigns, manage stock more efficiently, and tailor discounts strategically.
4️⃣ Payment Mode Analysis
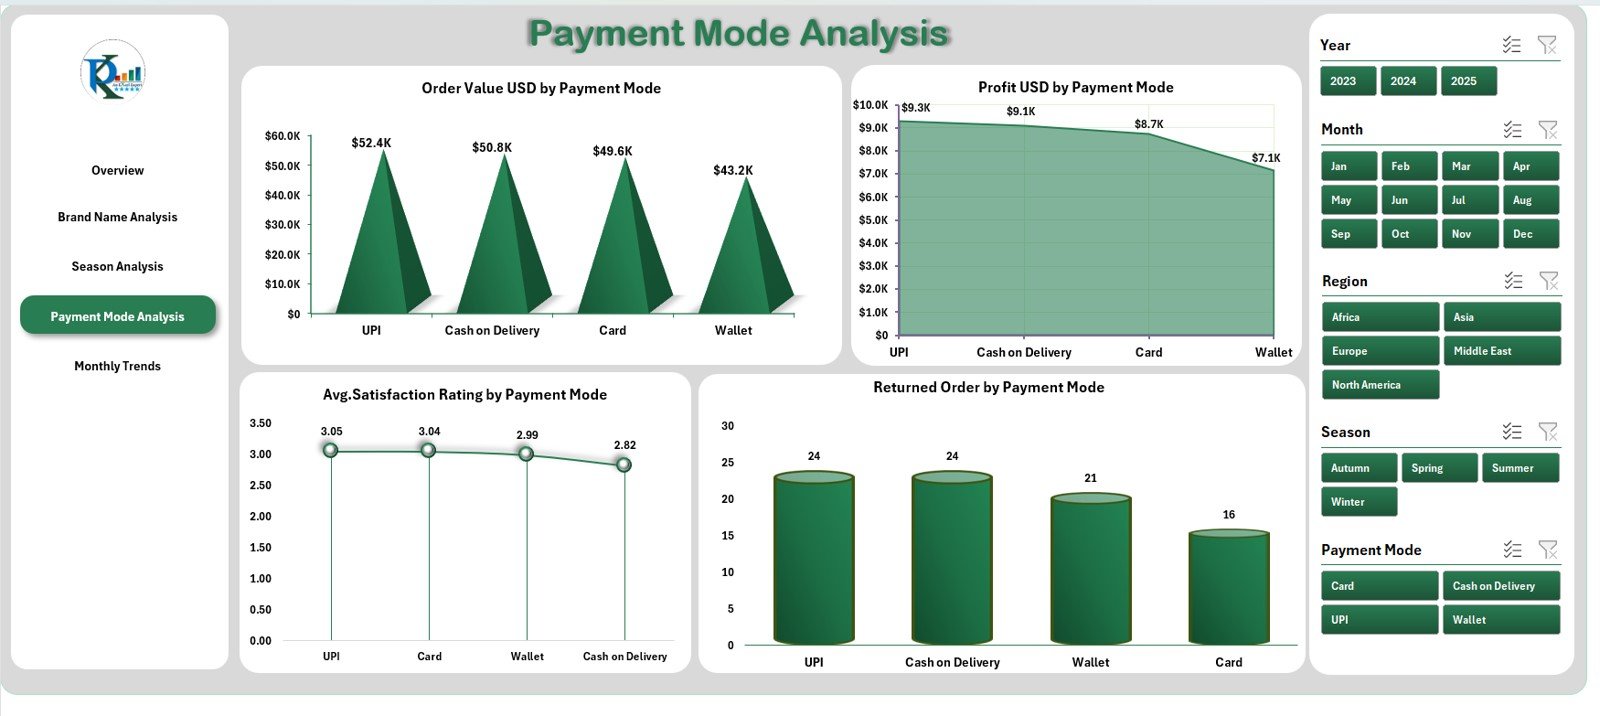
Understanding which payment options customers prefer helps streamline transactions and minimize friction.
Charts included:
-
Order Value (USD) by Payment Mode – Reveals the revenue share from modes like credit cards, PayPal, UPI, or cash on delivery.
-
Profit (USD) by Payment Mode – Identifies the most profitable payment options.
-
Average Satisfaction Rating by Payment Mode – Highlights customer comfort and reliability per payment type.
-
Returned Orders by Payment Mode – Detects whether certain payment methods correlate with higher returns.
Retailers can use these insights to optimize checkout experiences, reduce transaction failures, and improve satisfaction.
5️⃣ Monthly Trends
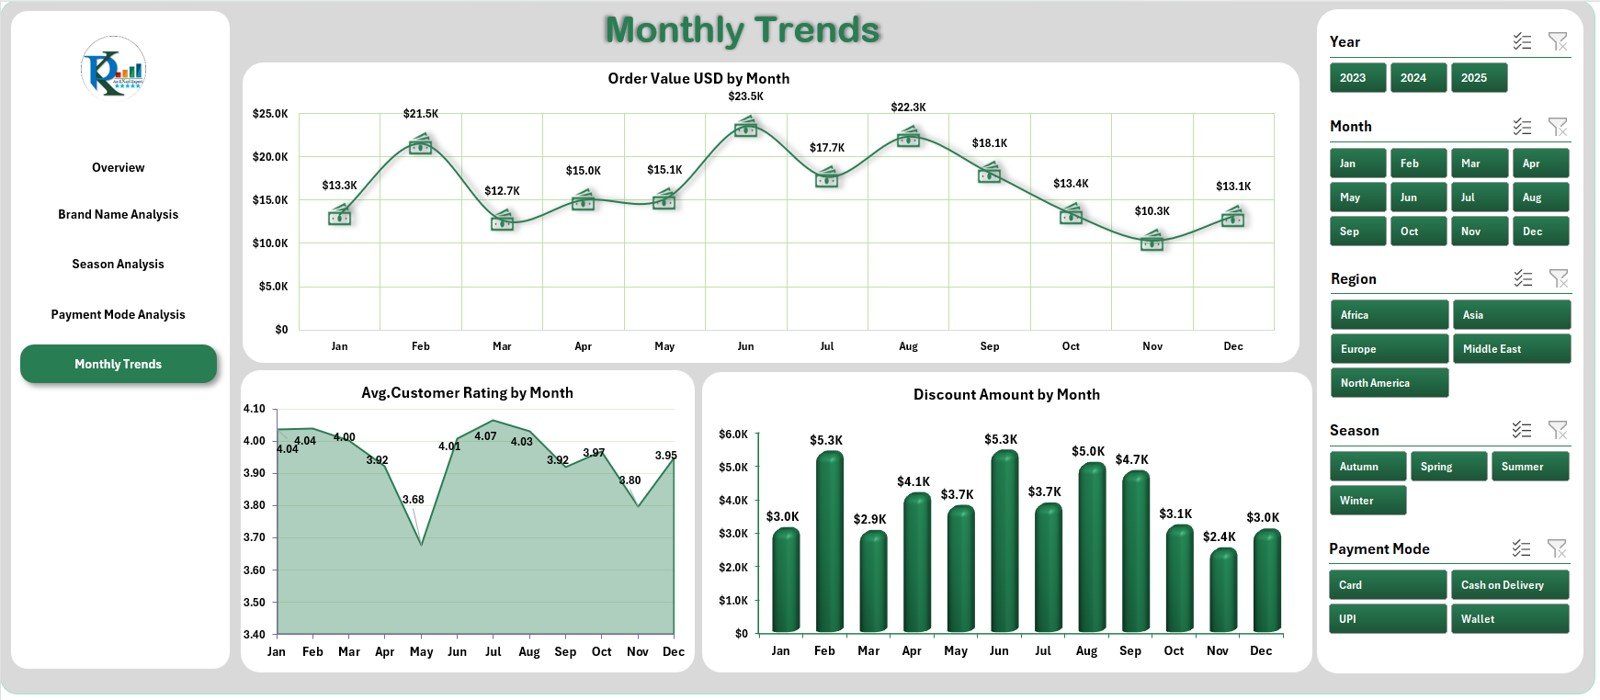
This page provides a time-based view of performance across the year.
Visuals displayed:
-
Order Value (USD) by Month: Tracks monthly sales growth or dips.
-
Average Customer Rating by Month: Monitors satisfaction consistency.
-
Discount Amount by Month: Measures how monthly promotions affect profitability.
With these trends, analysts can detect seasonality, identify performance peaks, and plan production or marketing campaigns accordingly.
📊 Support Sheet
The Support Sheet stores lookup values, dropdown lists, and references used throughout the workbook—ensuring smooth automation.
📈 Data Sheet
The Data Sheet contains all raw data for orders, payments, discounts, and customer ratings. It acts as the backbone of the dashboard, feeding live metrics to every page through pivot tables and formulas.
Click to Purchases Fast Fashion Brands Dashboard in Excel
💎 Advantages of the Fast Fashion Brands Dashboard in Excel
Implementing this dashboard offers both operational and strategic benefits for fashion retailers.
📍 1. Real-Time Performance Visibility
Get instant updates on sales, returns, and profits across multiple brands, helping you make faster, data-backed decisions.
💰 2. Centralized Data Management
Consolidate all brand, region, and season data in one Excel file—no need for multiple spreadsheets or manual reporting.
🧮 3. Enhanced Financial Tracking
Monitor metrics like profit margin %, discount amount, and order value (USD) to understand cost efficiency and profit contributors.
📦 4. Better Inventory and Discount Planning
By analyzing trends per season and brand, you can adjust stock levels, pricing, and promotional offers intelligently.
🧭 5. Easy Navigation and Customization
With the page navigator and modular structure, users can easily expand or modify the dashboard to match their business needs.
📊 6. Visual and Interactive Insights
Engage with your data through pivot charts, conditional formatting, and dynamic slicers—all within Excel’s familiar interface.
💡 7. Zero Coding or Add-ons Required
No VBA or macros needed. Everything runs natively in Excel, making it user-friendly and accessible to all team members.
🧠 How to Use the Fast Fashion Brands Dashboard in Excel
-
Input Data:
Enter or paste your fashion sales data into the Data Sheet (including order ID, brand, region, payment mode, profit, discount, and rating). -
Refresh Pivots:
Update pivot tables to ensure the visuals reflect new information. -
Select Slicers:
Use filters like Month, Brand, or Region to customize your view. -
Navigate Pages:
Use the left-side navigator to switch between Overview, Brand, Season, and other analytical pages. -
Interpret Charts:
Review key KPIs, identify top-performing brands, and strategize improvements.
Within minutes, you can uncover patterns and make smarter, faster business decisions.
🧵 Best Practices for the Fast Fashion Brands Dashboard in Excel
To make the most of this dashboard, follow these industry-proven best practices:
1️⃣ Maintain Data Consistency
Ensure that data entries (like brand names or payment modes) remain consistent across all records. Use dropdown lists to minimize spelling errors.
2️⃣ Refresh Pivots Regularly
Whenever you update data, refresh all pivot tables to keep metrics accurate and up to date.
3️⃣ Use Clear Naming Conventions
Label months, regions, and brands clearly. This ensures charts and slicers remain easy to interpret.
4️⃣ Track Key KPIs Monthly
Focus on key metrics—such as profit margin, return rate, and discount percentage—every month to spot anomalies early.
5️⃣ Leverage Conditional Formatting
Apply visual cues like color scales or icons to highlight best and worst performers instantly.
6️⃣ Back Up Data Periodically
Store monthly backups of the Data Sheet to analyze year-over-year trends later.
7️⃣ Customize Dashboard Layout
If your business focuses on certain KPIs more than others, adjust chart types and layouts accordingly.
📘 Example Use Cases
🛍️ Retail Brand Management
A global fashion retailer uses this dashboard to compare sales across multiple brands, identifying top performers and struggling labels.
🏬 Franchise Performance Tracking
Franchise owners use it to evaluate which stores deliver the highest order values and customer satisfaction scores.
📦 Supply Chain Planning
Operations teams analyze monthly demand to align production schedules with high-selling seasons.
📈 Marketing and Discount Optimization
Marketing teams assess discount effectiveness and adjust promotional budgets accordingly.
🧩 Why Excel Is Ideal for Fast Fashion Analytics
While tools like Power BI and Tableau are excellent, Excel remains the most accessible platform for small to mid-sized fashion businesses. It provides:
-
Easy customization
-
Offline access
-
Familiar formulas and pivot tables
-
Compatibility with other systems
The Fast Fashion Brands Dashboard leverages these strengths, offering enterprise-level insights within a tool everyone already knows.
🧠 Key Insights You Can Derive
-
Which brand contributes the most revenue?
-
Which payment mode yields the highest customer satisfaction?
-
How do discount strategies impact profitability?
-
What’s the seasonal trend in returns or satisfaction ratings?
-
Which months perform best in terms of sales and margin?
These insights can shape future campaigns, pricing models, and inventory planning.
🔚 Conclusion
The Fast Fashion Brands Dashboard in Excel is more than a reporting tool—it’s a complete performance management system.
It transforms fashion retail data into intuitive visuals that reveal patterns, highlight issues, and support data-driven growth. Whether you manage multiple brands, track seasonal trends, or analyze payment behaviors, this dashboard helps you stay one step ahead in the ever-evolving fashion world.
By adopting this Excel-based solution, fashion businesses can enhance decision-making, optimize marketing spend, and maintain consistent profitability—all with a single file.
Click to Purchases Fast Fashion Brands Dashboard in Excel
❓ Frequently Asked Questions (FAQs)
1️⃣ What is the purpose of a Fast Fashion Brands Dashboard in Excel?
It centralizes brand performance data—such as orders, discounts, profits, and satisfaction ratings—into visual charts for easier decision-making.
2️⃣ Can I use this dashboard for multiple brands?
Yes, you can analyze multiple brands side by side using slicers and filters for comparative insights.
3️⃣ Do I need advanced Excel skills to use this dashboard?
No, it’s fully beginner-friendly. You only need to update the data and refresh the pivots.
4️⃣ Can I customize the charts and pages?
Absolutely. You can modify chart types, add new KPIs, or change the color scheme to match your brand identity.
5️⃣ How often should I update the data?
Ideally, refresh data weekly or monthly to maintain accurate and up-to-date analytics.
6️⃣ Is this dashboard compatible with older Excel versions?
Yes, it works with Excel 2016 and above, including Office 365.
Click to Purchases Fast Fashion Brands Dashboard in Excel
Visit our YouTube channel to learn step-by-step video tutorials