Fast fashion brands operate in one of the most competitive and fastest-moving industries in the world. Trends change weekly, customer preferences shift quickly, and profit margins stay under constant pressure. Because of this, fashion companies must track sales, profit, discounts, returns, customer satisfaction, and seasonal performance in real time. However, managing all this information across multiple spreadsheets creates confusion and delays.
This is exactly where the Fast Fashion Brands Dashboard in Power BI delivers massive value.
A Fast Fashion Brands Dashboard in Power BI converts raw sales and customer data into powerful, interactive, and easy-to-understand visual insights. As a result, brand managers, merchandising teams, marketing leaders, and operations teams can make faster and smarter decisions.
In this detailed guide, you will learn what a Fast Fashion Brands Dashboard in Power BI is, how it works, which pages it includes, its advantages, best practices, and frequently asked questions. Moreover, you will understand why this dashboard plays a critical role in modern fashion analytics.
Click to Purchases Fast Fashion Brands Dashboard in Power BI
What Is a Fast Fashion Brands Dashboard in Power BI?
A Fast Fashion Brands Dashboard in Power BI is a ready-to-use analytics solution designed to track and analyze key business metrics for fast fashion companies. It brings together sales performance, profitability, discount trends, return behavior, customer satisfaction, and seasonal insights in one centralized dashboard.
Instead of reviewing multiple reports, teams can view all critical brand performance metrics on interactive Power BI pages. Because Power BI supports slicers, filters, and drill-downs, users can analyze data by brand, region, season, payment mode, or month instantly.
As a result, decision-makers gain clarity, visibility, and control over fast-moving business operations.
Why Do Fast Fashion Brands Need a Power BI Dashboard?
Fast fashion businesses handle high transaction volumes, frequent promotions, and dynamic product lines. Therefore, data complexity increases daily. Without a proper dashboard, teams face delays, missed insights, and poor decisions.
A Fast Fashion Brands Dashboard in Power BI solves these challenges by:
-
Centralizing all sales and customer data
-
Providing real-time performance visibility
-
Highlighting profitability and discount impact
-
Identifying high return rates early
-
Tracking customer satisfaction trends
-
Supporting faster merchandising and pricing decisions
Because Power BI dashboards update automatically, teams always work with the latest data.
Click to Purchases Fast Fashion Brands Dashboard in Power BI
Key Features of the Fast Fashion Brands Dashboard in Power BI
This Fast Fashion Brands Dashboard in Power BI includes 5 interactive pages inside the Power BI Desktop application. Each page focuses on a specific performance area, while slicers allow users to filter data dynamically.
Let’s explore each page in detail.
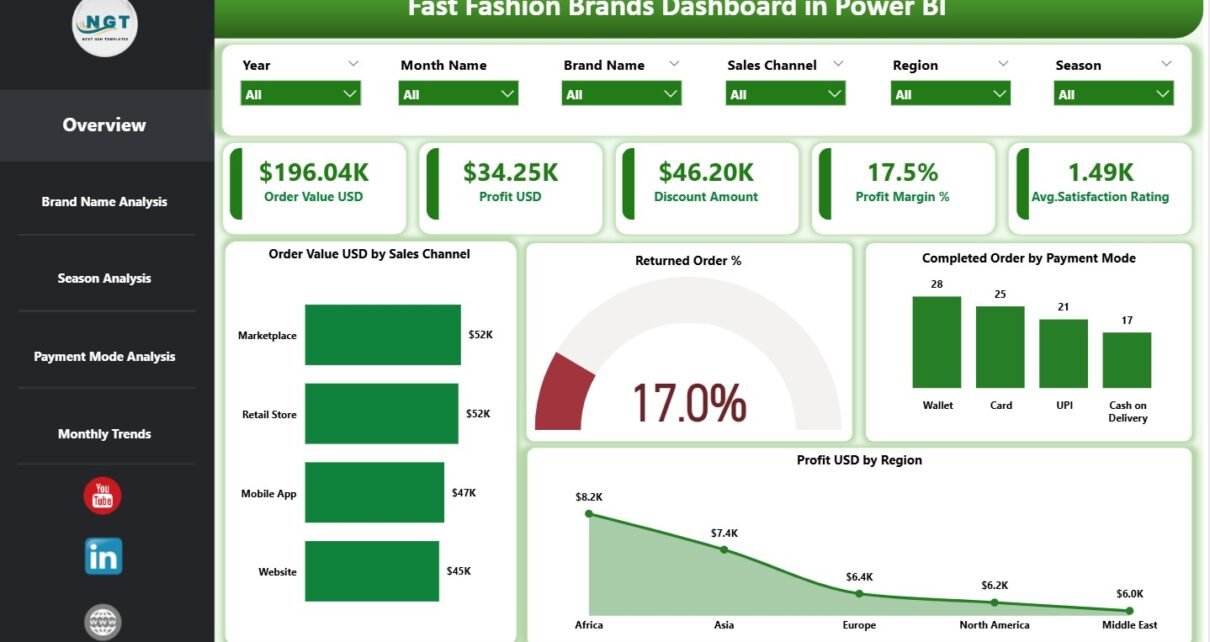
1. Overview Page Show
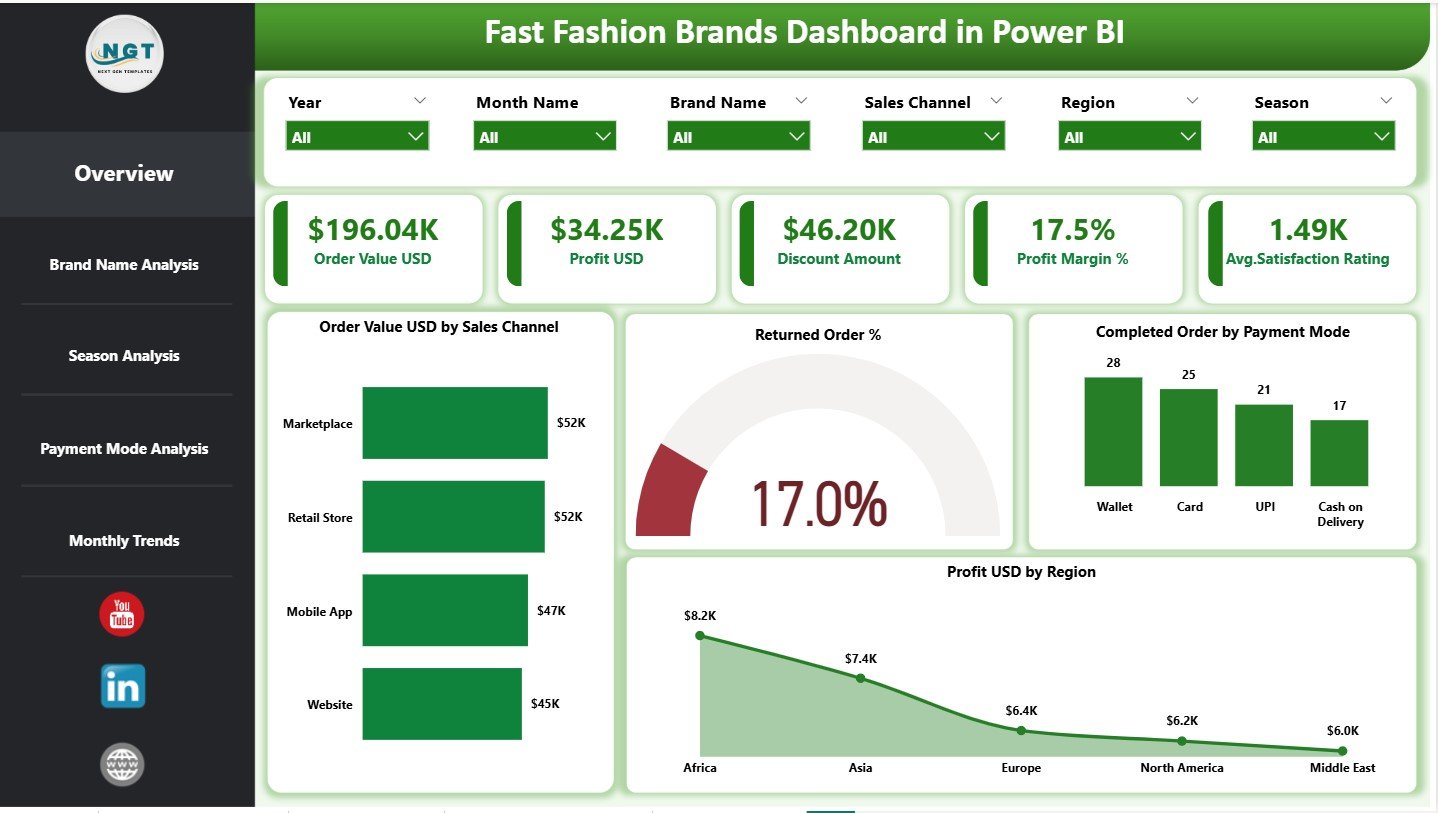
The Overview Page works as the main entry point of the dashboard. It provides a high-level snapshot of overall business performance.
Key Slicers on the Overview Page
-
Date
-
Brand Name
-
Region
-
Sales Channel
These slicers allow users to analyze performance instantly based on selected criteria.
Key Cards on the Overview Page
The dashboard includes 5 KPI cards that highlight critical metrics:
-
Order Value USD – Total revenue generated
-
Profit USD – Net profit achieved
-
Discount Amount – Total discounts offered
-
Profit Margin % – Overall profitability efficiency
-
Average Satisfaction Rating – Customer experience score
These cards help leadership teams understand business health at a glance.
Charts on the Overview Page
In addition, the Overview Page includes 4 insightful charts:
-
Order Value USD by Sales Channel – Identifies top-performing channels
-
Returned Order % – Highlights return behavior
-
Completed Orders by Payment Mode – Shows customer payment preferences
-
Profit USD by Region – Reveals profitable markets
Together, these visuals create a complete performance summary.
2. Brand Name Analysis Page
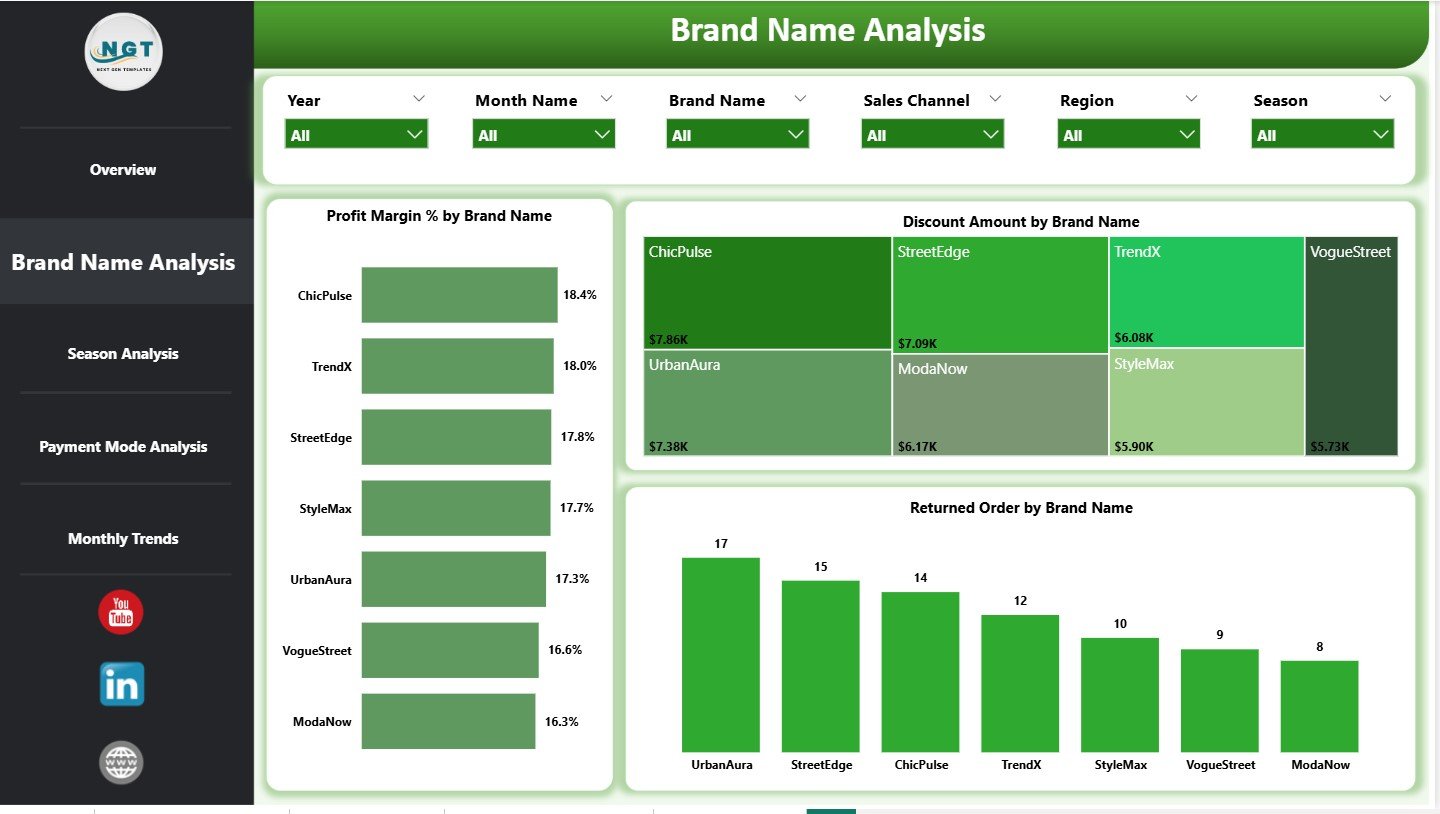
The Brand Name Analysis Page focuses on individual brand performance. This page helps companies compare multiple brands under one portfolio.
Key Insights from the Brand Name Analysis Page
This page includes 3 interactive charts:
-
Profit Margin % by Brand Name – Compares brand profitability
-
Discount Amount by Brand Name – Tracks discount dependency
-
Returned Orders by Brand Name – Identifies brands with high returns
Because this page supports slicers, users can quickly identify top-performing brands and underperforming ones. As a result, teams can optimize pricing, promotions, and inventory decisions.
3. Season Analysis Page
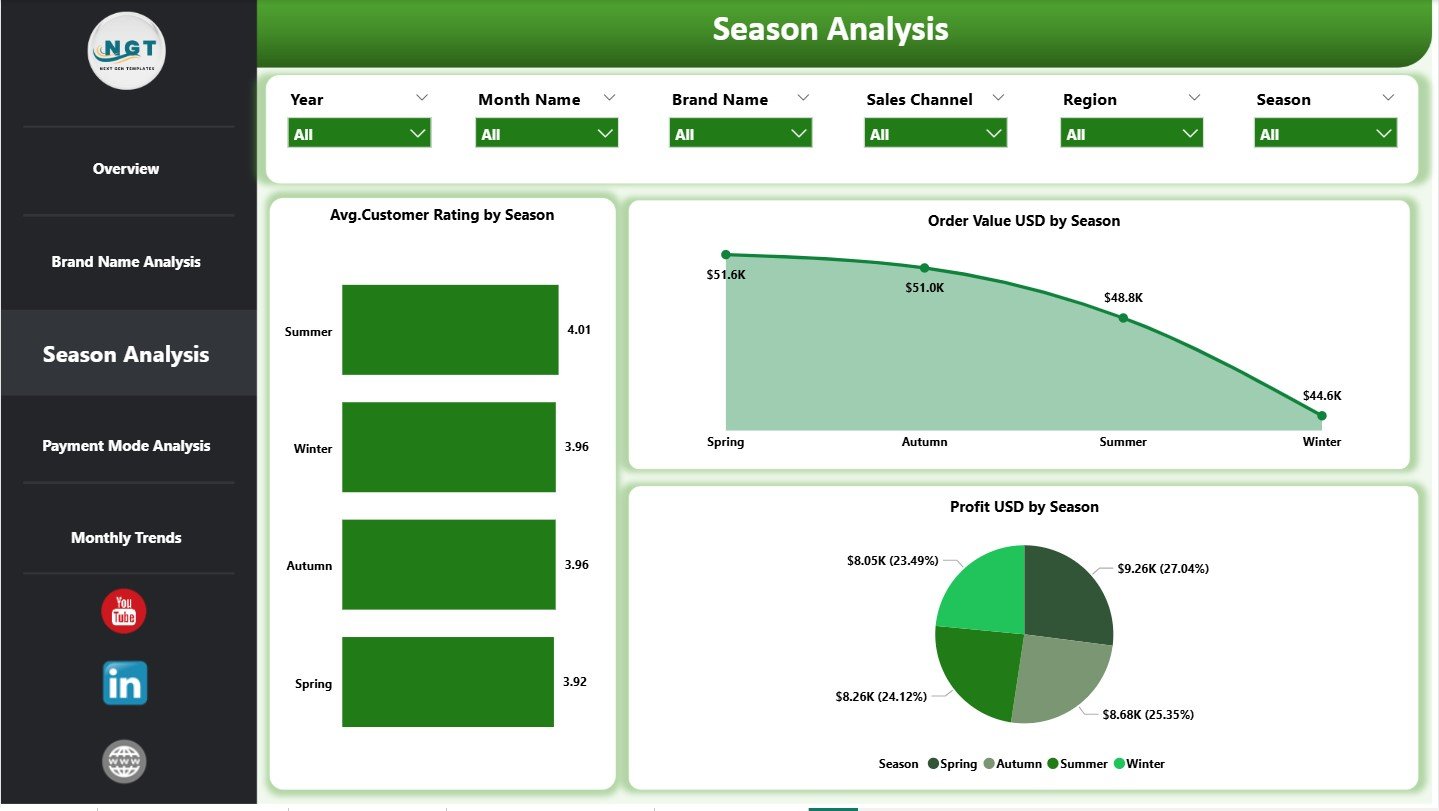
Fast fashion brands depend heavily on seasons such as Spring, Summer, Fall, and Winter. Customer preferences and buying behavior change significantly with seasons.
The Season Analysis Page provides clear insights into seasonal performance.
Charts on the Season Analysis Page
This page includes 3 focused charts:
-
Average Customer Rating by Season – Measures satisfaction trends
-
Order Value USD by Season – Tracks revenue trends across seasons
-
Profit USD by Season – Identifies profitable seasons
Using this page, teams can plan seasonal collections more effectively and align inventory with demand.
4. Payment Mode Analysis Page
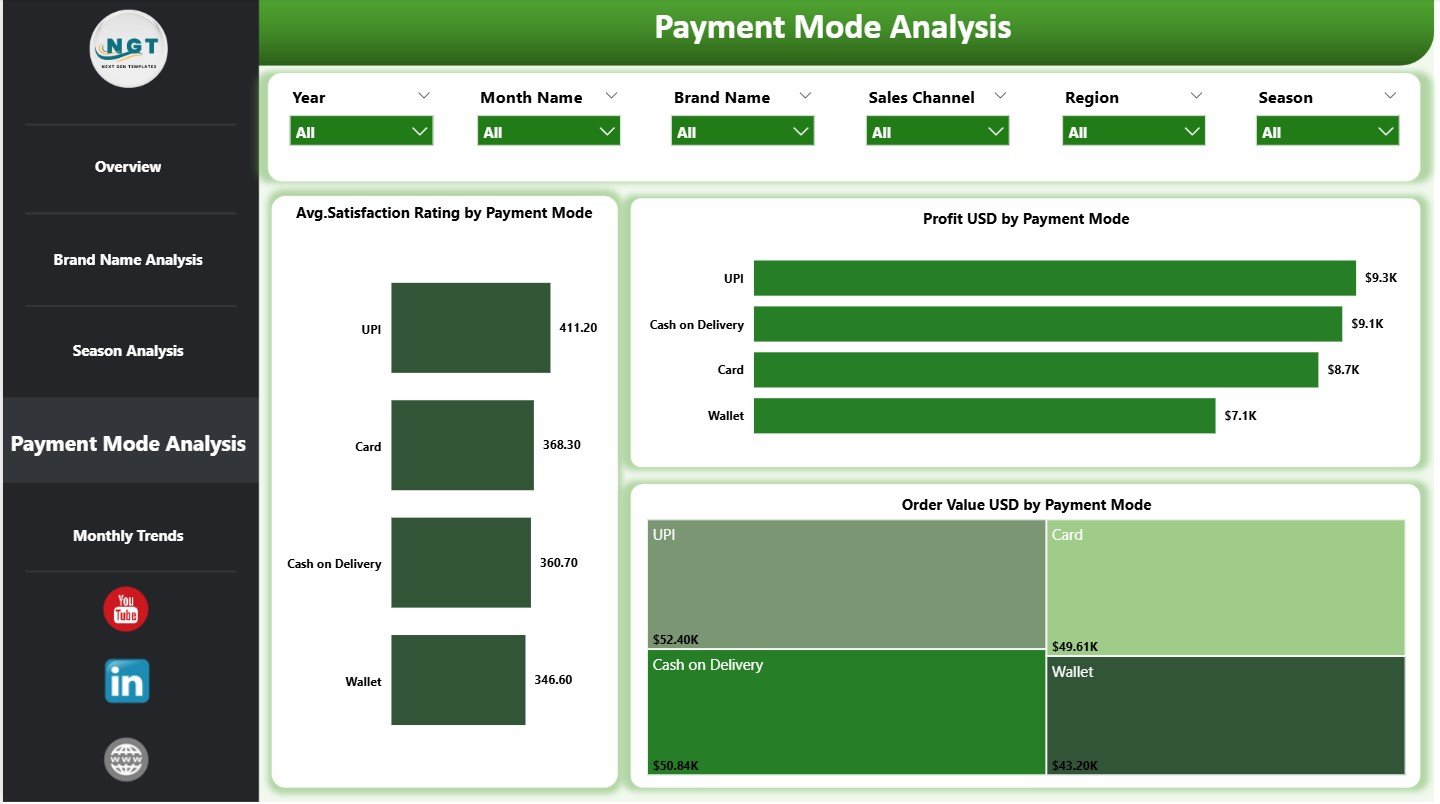
The Payment Mode Analysis Page evaluates how customers pay for their orders and how it affects performance.
Key Charts on the Payment Mode Analysis Page
This page includes 3 interactive visuals:
-
Average Satisfaction Rating by Payment Mode – Measures payment experience
-
Profit USD by Payment Mode – Identifies profitable payment options
-
Order Value USD by Payment Mode – Highlights preferred methods
Because payment experience impacts customer satisfaction directly, this page helps teams optimize checkout options and reduce friction.
Click to Purchases Fast Fashion Brands Dashboard in Power BI
5. Monthly Trends Page
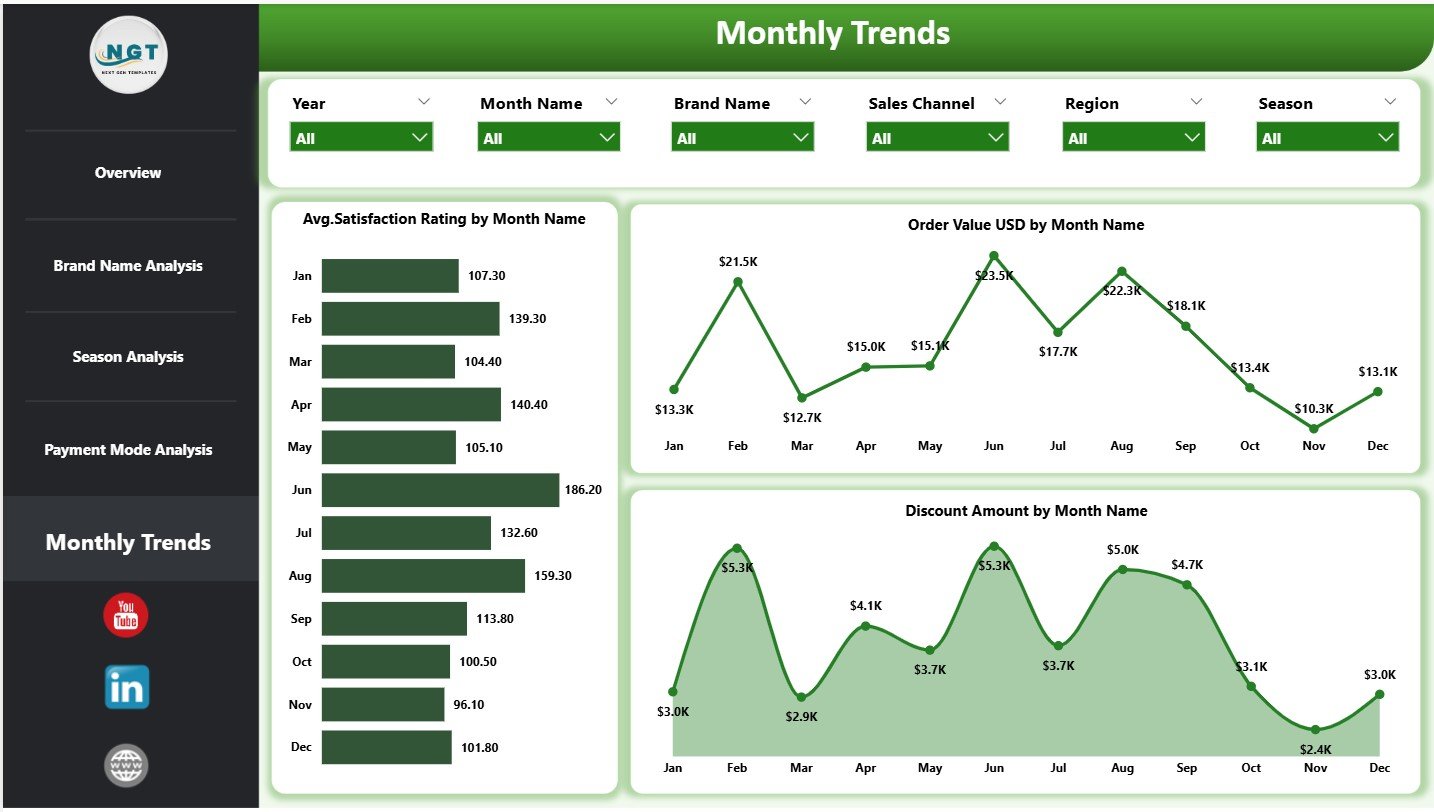
Fast fashion brands experience sharp monthly sales fluctuations due to campaigns, launches, and trends. Therefore, tracking monthly trends becomes essential.
The Monthly Trends Page focuses on time-based performance analysis.
Charts on the Monthly Trends Page
This page includes 3 monthly trend charts:
-
Average Satisfaction Rating by Month
-
Order Value USD by Month
-
Discount Amount by Month Name
By reviewing these trends, teams can forecast demand better and fine-tune promotional strategies.
How Does Data Flow into the Dashboard?
The Fast Fashion Brands Dashboard in Power BI connects to structured sales and customer data sources such as:
-
Excel files
-
CSV files
-
Databases
-
Cloud platforms
Once data loads into Power BI, measures and visuals update automatically. Therefore, users never need to refresh manual reports again.
Advantages of the Fast Fashion Brands Dashboard in Power BI
Using a Fast Fashion Brands Dashboard in Power BI offers multiple benefits.
✅ Centralized Performance Tracking
All KPIs stay available in one location, which eliminates confusion.
✅ Faster Decision Making
Because insights update in real time, teams respond quickly.
✅ Improved Profitability Analysis
Profit margin and discount tracking improve pricing strategies.
✅ Enhanced Customer Experience Insights
Customer satisfaction ratings highlight service gaps.
✅ Better Seasonal Planning
Seasonal trends support smarter merchandising plans.
✅ Scalable Analytics Solution
The dashboard grows easily with business expansion.
Who Should Use This Dashboard?
This dashboard fits perfectly for:
-
Fast fashion brand owners
-
Retail analytics managers
-
Merchandising teams
-
Marketing teams
-
E-commerce managers
-
Financial analysts
Because the dashboard remains intuitive, both technical and non-technical users can use it comfortably.
Click to Purchases Fast Fashion Brands Dashboard in Power BI
Best Practices for the Fast Fashion Brands Dashboard in Power BI
To get maximum value from the dashboard, follow these best practices.
🔹 Keep Data Clean and Updated
Accurate data ensures reliable insights.
🔹 Use Slicers Effectively
Apply slicers to explore deeper insights during reviews.
🔹 Track Return Rates Regularly
High returns often indicate product or sizing issues.
🔹 Monitor Discounts Closely
Over-discounting reduces profit margins quickly.
🔹 Review Customer Ratings Monthly
Customer feedback helps improve experience rapidly.
🔹 Share Insights Across Teams
Collaborative insights drive better decisions.
How Does This Dashboard Support Business Growth?
Because fast fashion relies on speed and accuracy, this dashboard plays a vital role in scaling operations. It enables brands to:
-
Identify high-performing regions
-
Optimize payment experiences
-
Reduce losses from returns
-
Improve customer satisfaction
-
Increase profit margins
As a result, brands stay competitive in a fast-changing market.
Conclusion
The Fast Fashion Brands Dashboard in Power BI acts as a powerful analytical engine for modern fashion businesses. It transforms scattered sales and customer data into actionable insights across five structured pages. Because it covers revenue, profit, discounts, returns, satisfaction, seasons, payment modes, and trends, the dashboard supports smarter decisions at every level.
In today’s fast-moving fashion industry, data clarity creates a competitive advantage. With this Power BI dashboard, fast fashion brands gain visibility, control, and confidence to grow sustainably.
Click to Purchases Fast Fashion Brands Dashboard in Power BI
Frequently Asked Questions (FAQs)
What is a Fast Fashion Brands Dashboard in Power BI?
A Fast Fashion Brands Dashboard in Power BI is an interactive analytics tool that tracks sales, profit, discounts, returns, customer satisfaction, and trends across fashion brands.
Who can use this Power BI dashboard?
Brand owners, managers, analysts, marketers, and e-commerce teams can use it easily.
Does this dashboard support seasonal analysis?
Yes, it includes a dedicated Season Analysis page to track performance by season.
Can I analyze individual brands separately?
Yes, the Brand Name Analysis page allows detailed brand-wise insights.
Does it track customer satisfaction?
Yes, the dashboard includes average customer satisfaction ratings across pages.
Can I customize this dashboard?
Absolutely. You can add new KPIs, filters, or visuals as needed.
Is Power BI required to use this dashboard?
Yes, you need Power BI Desktop or Power BI Service to access and share the dashboard.
Click to Purchases Fast Fashion Brands Dashboard in Power BI
Visit our YouTube channel to learn step-by-step video tutorials