The film and television industry thrives on creativity, but success always depends on performance measurement. Whether it is box office earnings, audience ratings, production costs, or advertising revenue, executives and managers need accurate data to make informed decisions. However, with scattered data sources and multiple teams involved, tracking all performance indicators often becomes challenging.
This is where a Film and Television KPI Dashboard in Excel becomes a powerful solution. It provides a centralized, easy-to-use, and fully customizable platform to monitor key performance indicators (KPIs) that drive success in both film and television projects.
In this guide, you will discover everything about the Film and Television KPI Dashboard in Excel—its structure, features, advantages, opportunities for improvement, best practices, and answers to frequently asked questions.
Click to Purchases Film and Television KPI Dashboard in Excel
What Is a Film and Television KPI Dashboard?
A Film and Television KPI Dashboard is a pre-built Excel template designed to track and analyze the most important performance metrics for media production companies, broadcasters, streaming platforms, and studios. Instead of juggling between complex business intelligence tools or raw spreadsheets, this dashboard organizes KPIs into structured visuals, charts, and reports.
It offers managers a clear view of:
-
Financial performance (budget vs. actual spend, advertising revenue).
-
Audience engagement (viewer ratings, subscription growth, social media buzz).
-
Production efficiency (timeline adherence, crew utilization, cost overruns).
-
Comparative insights (current year vs. previous year performance).
With one click, teams can review progress, identify gaps, and make data-driven decisions.
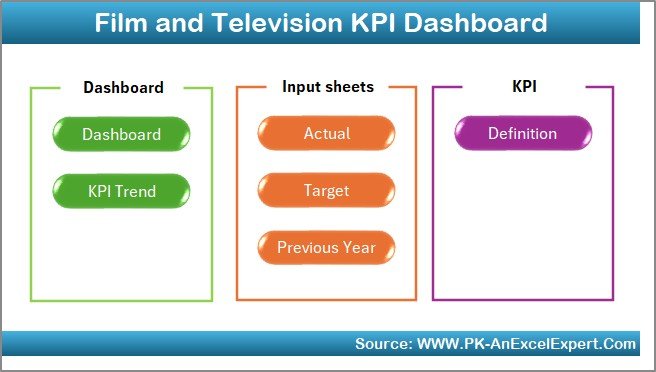
Structure of the Dashboard
This KPI Dashboard comes with 7 well-structured worksheets, each serving a unique purpose. Let’s explore them in detail.
Home Sheet
The Home sheet is the starting point of the dashboard. It acts as a simple index page, where users can see navigation buttons that directly link to other sheets.
-
There are six interactive buttons on this page.
-
Each button takes you to a specific section of the dashboard (Dashboard, KPI Trend, Actual Numbers, Target, Previous Year, and KPI Definition).
-
This setup reduces the need to scroll and helps teams quickly access the data they want.
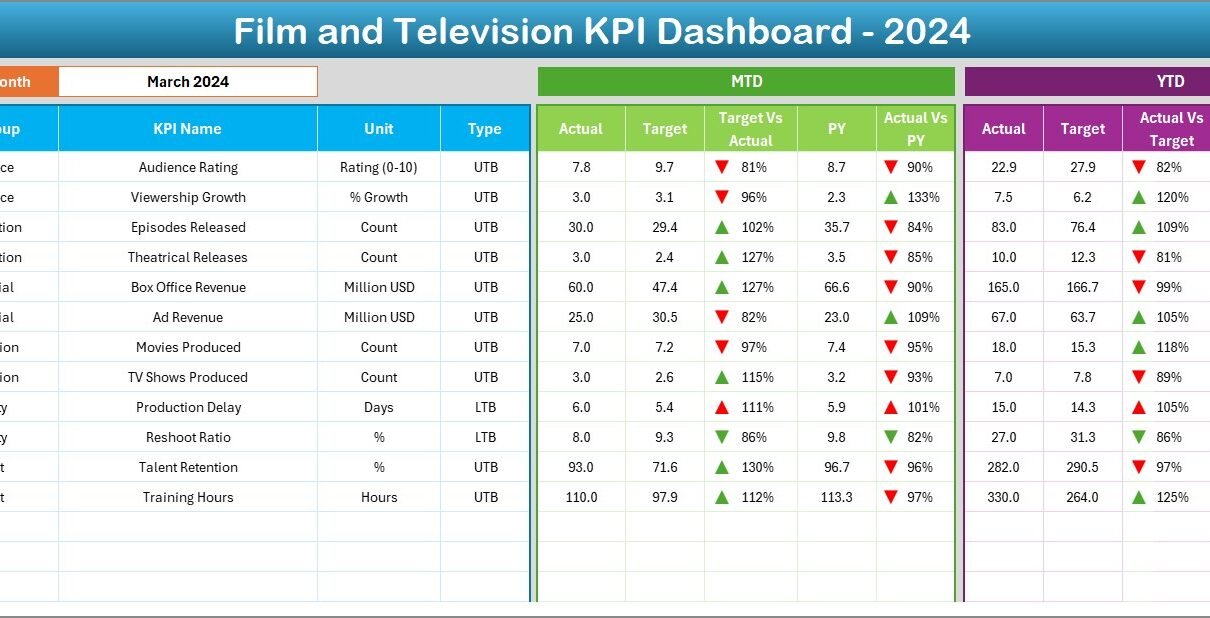
Dashboard Sheet
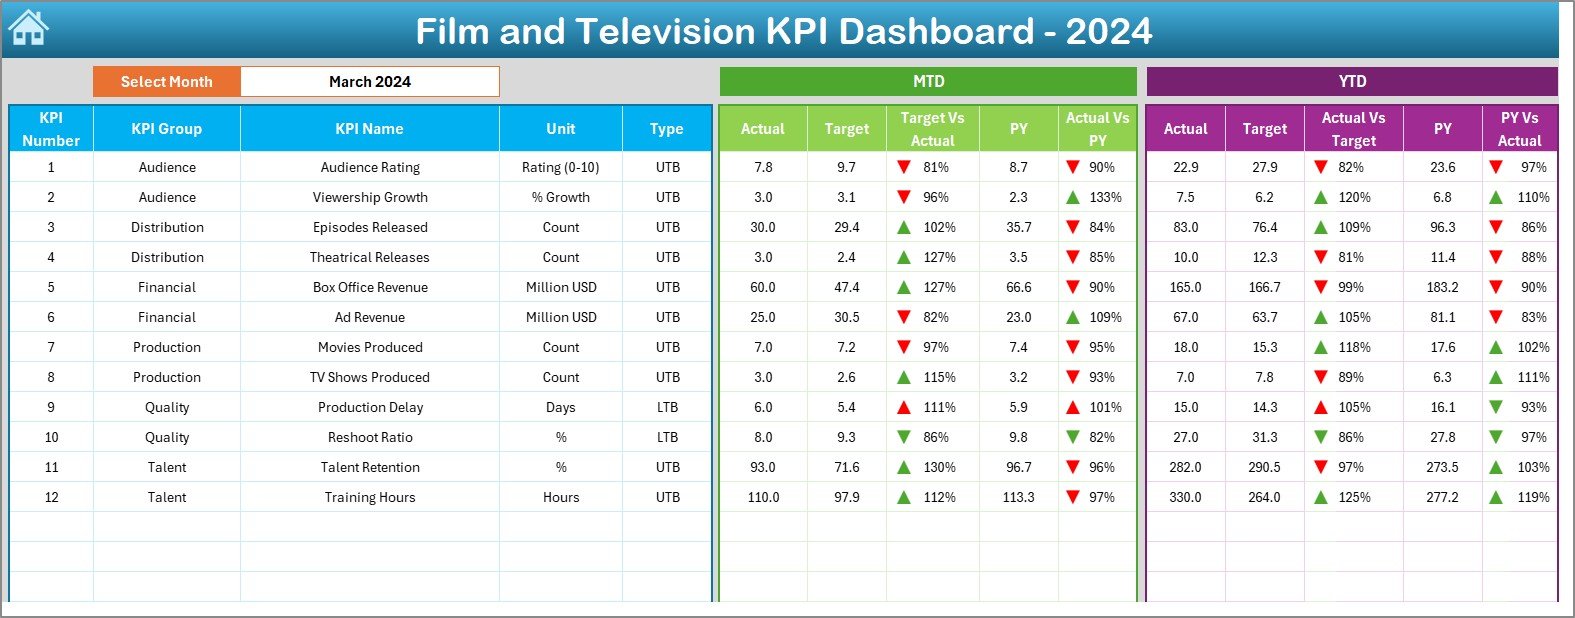
The Dashboard sheet is the core of the system.
-
At the top, you can choose the Month from a drop-down list (located at cell D3).
-
Once selected, all metrics update automatically for that specific month.
-
KPIs are displayed with MTD (Month-to-Date) and YTD (Year-to-Date) values.
-
Each KPI shows Actual, Target, and Previous Year numbers side by side.
Conditional formatting with up and down arrows helps visualize performance:
- ✅ Green arrow: Achievement better than target or previous year.
- ❌ Red arrow: Performance falling short.
This sheet essentially provides a snapshot of organizational health for any chosen month.
Click to Purchases Film and Television KPI Dashboard in Excel
KPI Trend Sheet
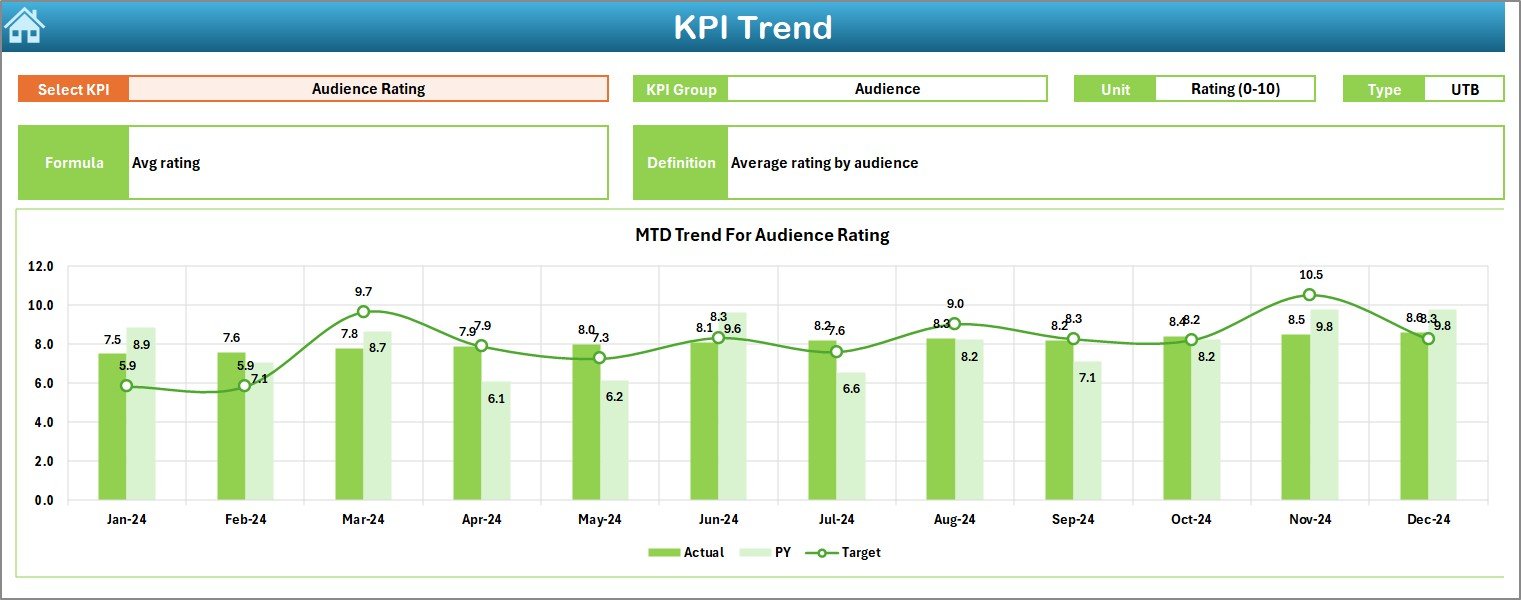
The KPI Trend sheet allows detailed analysis of individual KPIs.
-
A drop-down in C3 lets you select a KPI to analyze.
The sheet displays:
- KPI Group (e.g., Audience, Financial, Production).
- KPI Unit (e.g., % rating, revenue in $).
- KPI Type (LTB: Lower the Better or UTB: Upper the Better).
- Formula (how the KPI is calculated).
- Definition (short description).
-
The sheet includes trend charts that compare Actual, Target, and Previous Year numbers for both MTD and YTD.
For example, if you select Audience Rating, you can see how monthly ratings performed compared to targets and how they evolved over the year.
Actual Numbers Input Sheet
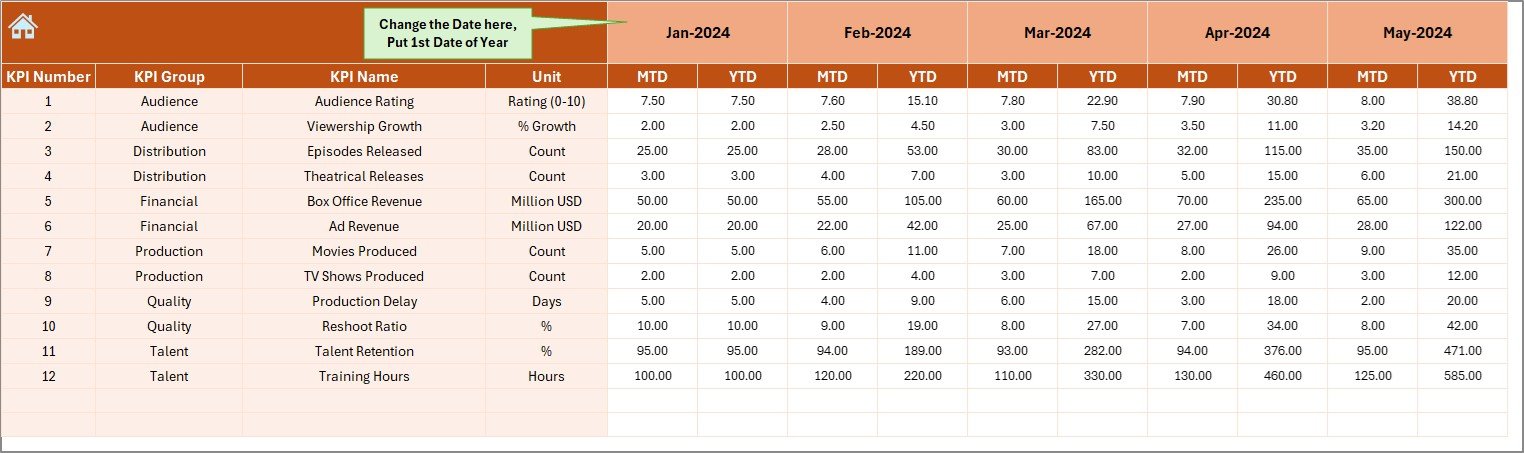
This sheet is where users enter real data.
-
It captures monthly performance for both MTD and YTD.
-
Users can adjust the first month of the year in cell E1, which updates the calendar.
-
Data entered here automatically feeds into the Dashboard and Trend charts.
This ensures that the dashboard remains dynamic and always up to date.
Target Sheet
Targets define the benchmarks for success.
-
In this sheet, users input monthly targets for all KPIs.
-
Both MTD and YTD targets can be set.
-
The dashboard uses these numbers for comparison against actual results.
For example, if the advertising revenue target for March is $2M, the system will highlight whether the actual revenue met or missed this goal.
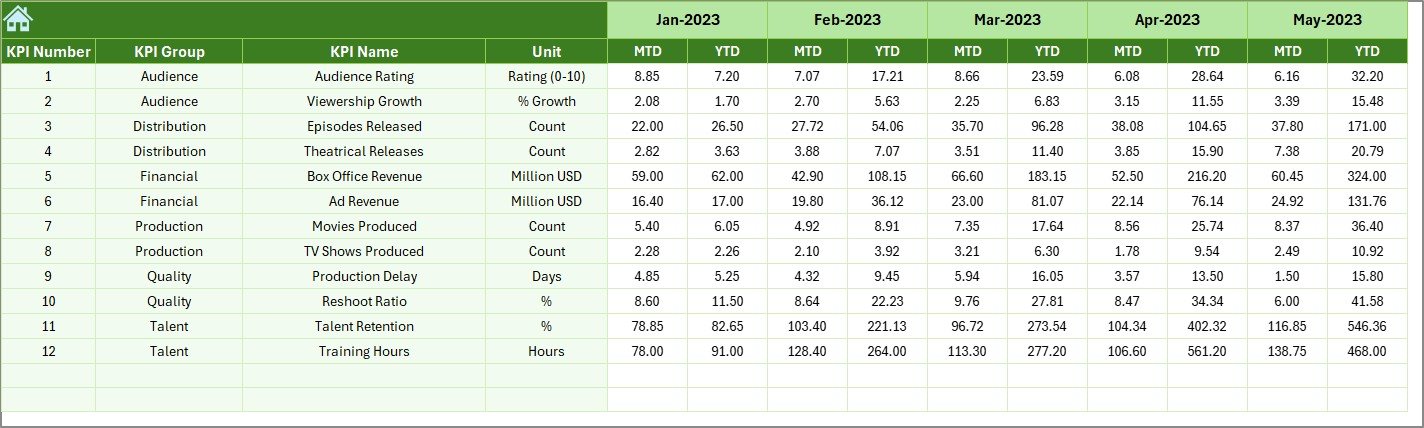
Previous Year Numbers Sheet
Comparisons are vital in performance analysis.
-
This sheet stores historical data from the previous year.
-
Just like Actual and Target sheets, numbers are entered month by month.
-
The dashboard then calculates PY vs. Actual variance.
For instance, if last year’s production cost was $1.5M for June, and this year it is $1.8M, the variance is automatically displayed with conditional formatting.
Click to Purchases Film and Television KPI Dashboard in Excel
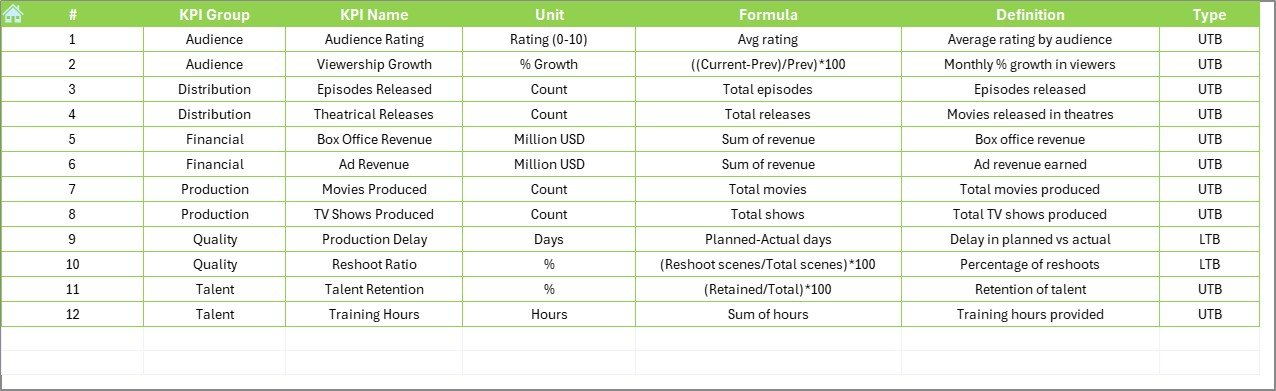
KPI Definition Sheet
The KPI Definition sheet acts as the knowledge base of the dashboard.
-
It contains each KPI’s Name, Group, Unit, Formula, and Definition.
-
This ensures clarity across teams and eliminates confusion.
-
New KPIs can be added here, and they will become part of the dashboard structure.
This sheet is particularly useful for new team members who may not be familiar with the calculations.
Advantages of the Film and Television KPI Dashboard
Using this dashboard provides several benefits to film and television organizations:
📊 Centralized Data – All KPIs are in one place, reducing scattered spreadsheets.
⏳ Time Savings – Automated calculations eliminate manual report preparation.
🎯 Clear Visibility – Instant insight into monthly and yearly performance.
📈 Improved Decision Making – Managers can identify gaps and act faster.
🔄 Comparative Analysis – Easy comparison between Actual, Target, and Previous Year.
🎥 Industry-Specific Relevance – KPIs tailored for film and TV production, broadcasting, and streaming.
🖥️ User-Friendly – Simple Excel-based solution with no extra software required.
Opportunities for Improvement
Although powerful, this Excel-based system has room for growth:
🔧 Automation with VBA – Macros can reduce repetitive manual entries.
☁️ Cloud Integration – Linking with Google Sheets or OneDrive for real-time collaboration.
📡 Data Import – Direct connections with ticketing systems, streaming platforms, or financial tools.
🎨 Enhanced Visualization – Adding Power BI or Tableau integrations for richer charts.
🔒 Security Features – Password protection for sensitive financial or production data.
Best Practices for Using the Film and Television KPI Dashboard
To get maximum value, follow these best practices:
✅ Update Regularly – Enter Actual and Target data at the start of each month.
✅ Standardize KPI Definitions – Ensure all departments follow the same formulas.
✅ Use Historical Data – Compare at least three years for accurate trends.
✅ Keep It Simple – Avoid unnecessary KPIs that complicate decision making.
✅ Review Monthly – Hold monthly review meetings based on dashboard insights.
✅ Combine with Qualitative Insights – Balance numerical data with audience feedback.
Conclusion
The Film and Television KPI Dashboard in Excel empowers production houses, TV networks, and streaming platforms to monitor their performance with accuracy and speed. By consolidating KPIs such as ratings, revenues, costs, and timelines, it provides a holistic view of business health.
For organizations seeking a cost-effective yet powerful performance tracking tool, this dashboard serves as an ideal choice. It not only simplifies reporting but also enables smarter, data-driven strategies that align with industry goals.
Frequently Asked Questions (FAQs)
1. Who can use the Film and Television KPI Dashboard?
This dashboard is ideal for film production houses, television networks, streaming platforms, marketing teams, and independent producers.
2. What type of KPIs can be tracked?
You can track financial KPIs (budget, revenue), audience KPIs (ratings, subscribers), and production KPIs (timeline, cost per project).
3. Do I need advanced Excel skills to use it?
No. The dashboard is beginner-friendly. You only need to input data in specific sheets, and the dashboard updates automatically.
4. Can I customize the KPIs?
Yes. You can add new KPIs in the KPI Definition sheet and adjust formulas as needed.
5. How does this help in decision-making?
It highlights whether performance is meeting targets and compares results with last year, making it easier to plan future actions.
6. Is it better than using expensive software?
For small and medium organizations, yes. It is cost-effective, simple to use, and highly customizable without heavy investment.
Visit our YouTube channel to learn step-by-step video tutorials