The film industry thrives on creativity, but behind every successful movie lies precise planning, financial discipline, and performance tracking. Whether it’s managing production budgets, crew efficiency, or marketing performance, having a Film Production KPI Scorecard in Excel helps studios and production houses stay on track and make data-driven decisions.
In this article, we will explore what this KPI scorecard is, how it works, what it includes, and how it can transform your film project management. You’ll also discover its advantages, best practices, and answers to frequently asked questions at the end.
Click to Purchases Film Production KPI Scorecard in Excel
🎯 What Is a Film Production KPI Scorecard in Excel?
A Film Production KPI Scorecard in Excel is a structured performance management tool designed to track, monitor, and visualize key performance indicators (KPIs) related to film projects.
It helps production managers, producers, and studio executives measure progress across different areas — including pre-production, shooting, post-production, marketing, and distribution.
Instead of relying on multiple spreadsheets or manual reporting, this Excel-based scorecard consolidates all critical data into one interactive dashboard.
The scorecard offers real-time insights into how well each department performs, enabling quick decisions on cost management, efficiency, and quality.
Click to Purchases Film Production KPI Scorecard in Excel
🧩 Structure of the Film Production KPI Scorecard Template
This ready-to-use Excel template contains four main worksheets — each built for a specific purpose.
Let’s explore them one by one:
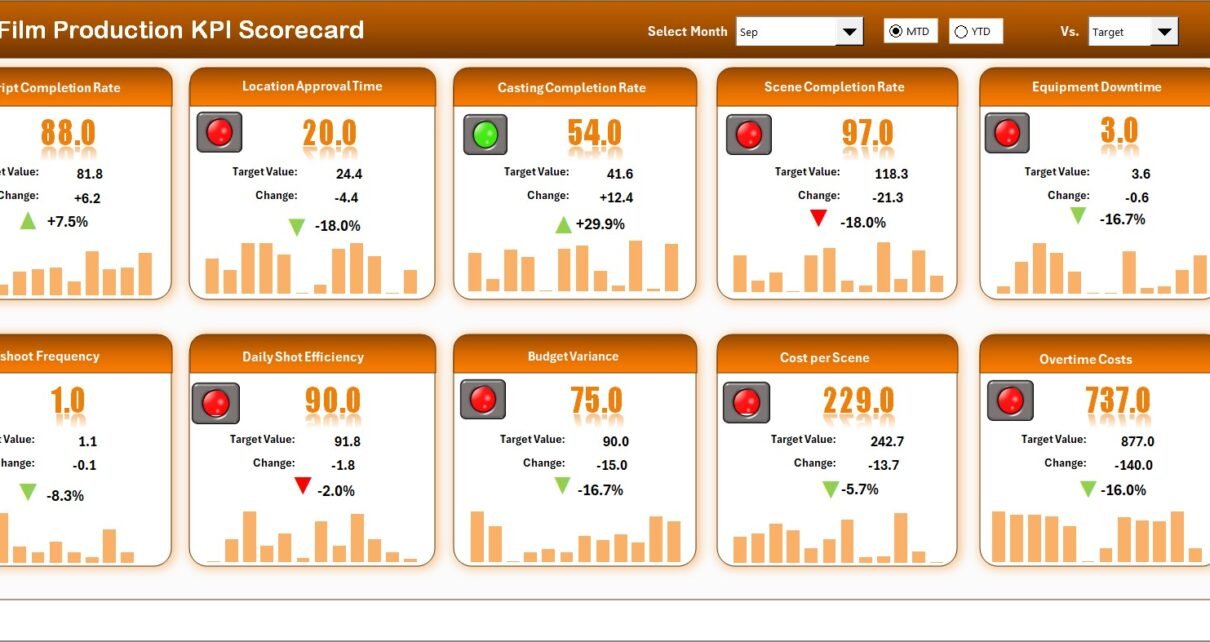
1️⃣ Scorecard Sheet — Your Main Performance Dashboard
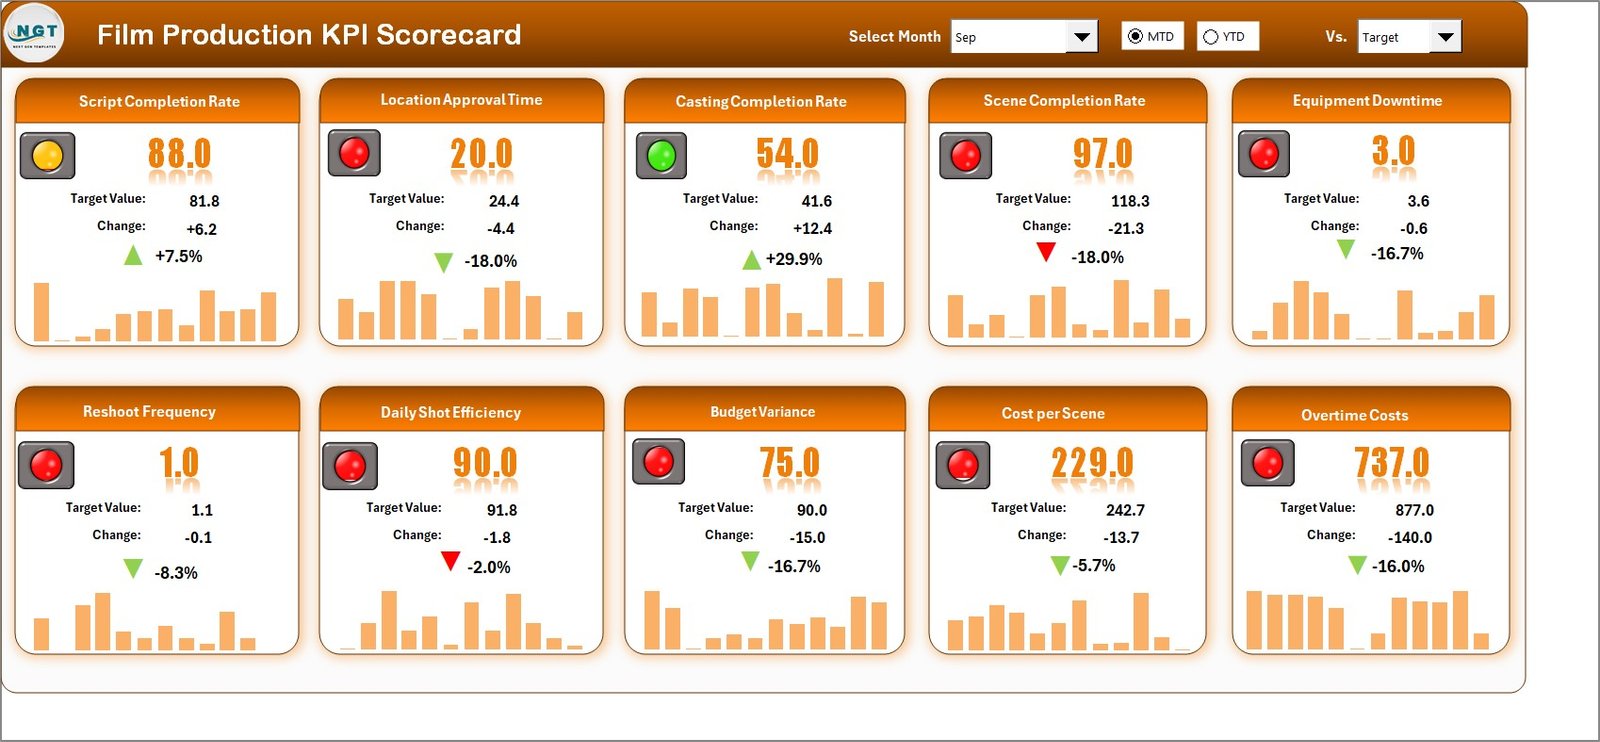
The Scorecard Sheet acts as the control center of the entire file. It summarizes all your KPIs and provides a clear snapshot of performance trends.
Key Features:
-
🎚 Dropdown Menus:
Choose between Month, MTD (Month-to-Date), or YTD (Year-to-Date) views to focus on short-term or long-term performance. -
📊 Actual vs Target Comparison:
Compare actual results with the targets to instantly spot areas that are performing well and those that need improvement. -
🟢 Visual Indicators:
Conditional formatting and color-coded visuals show whether each KPI is performing above or below expectations. -
🧠 Comprehensive KPI Overview:
See all KPIs — including their actual values, targets, and trends — in one consolidated view.
The sheet gives producers and project managers a visual, data-driven way to evaluate performance without digging into complex formulas.
2️⃣ KPI Trend Sheet — Track Progress Over Time
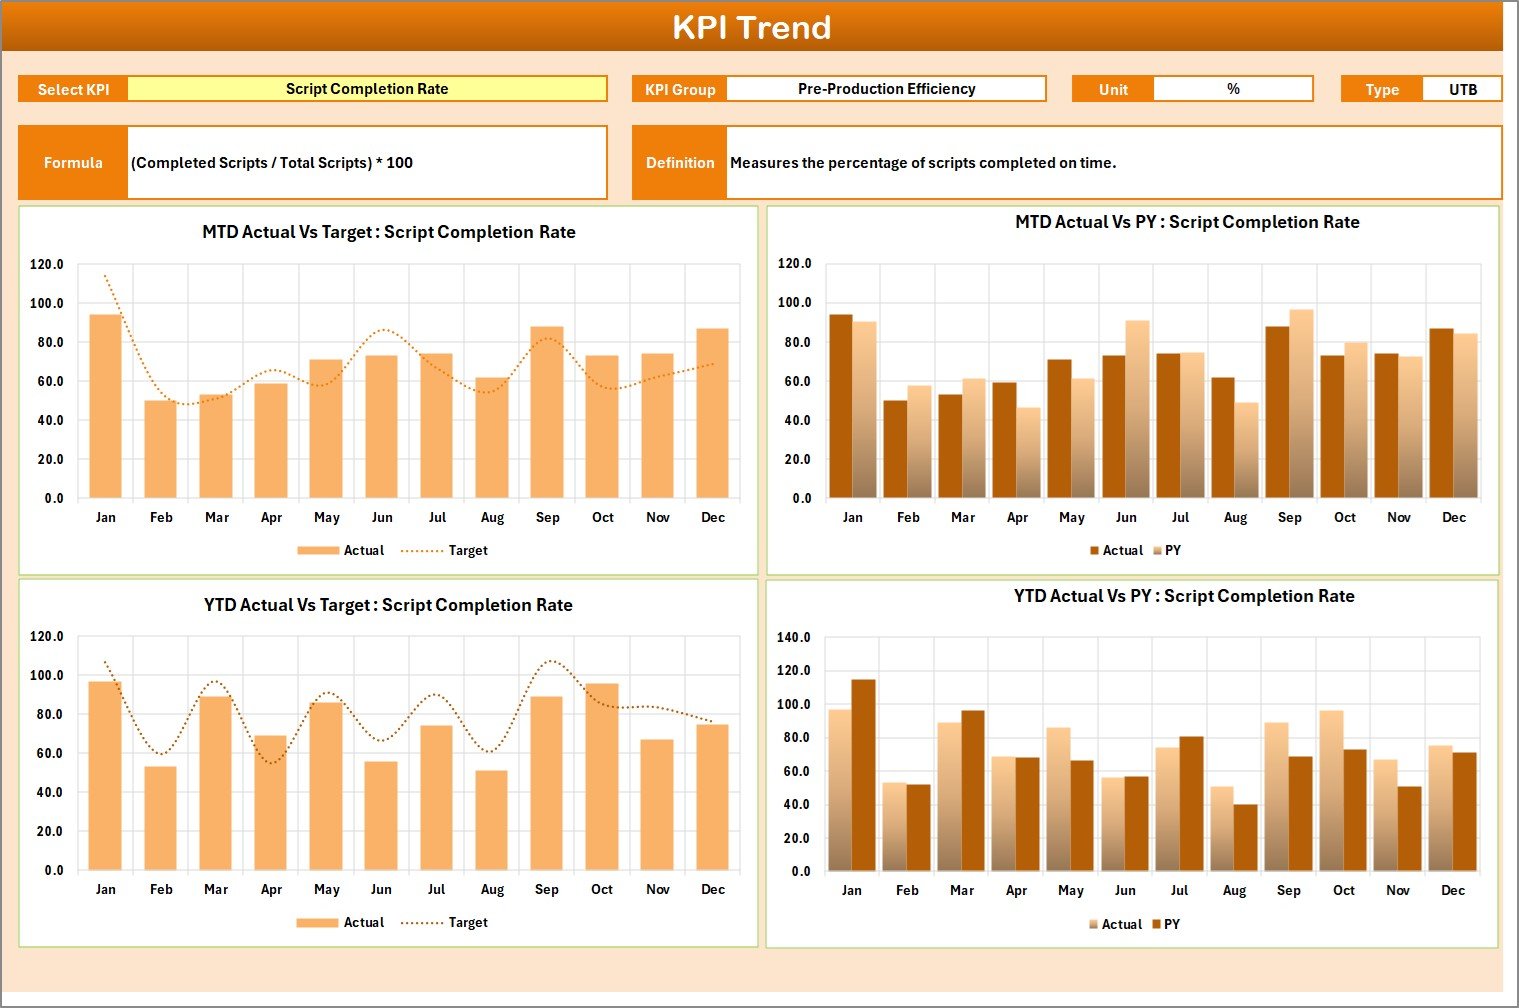
The KPI Trend Sheet provides a dynamic, visual analysis of how each KPI evolves throughout the project or across months.
Key Features:
-
📋 KPI Selection:
Choose any KPI from the dropdown in cell C3 to view its detailed information. -
⚙️ KPI Details Display:
The sheet displays crucial information such as KPI Group, Unit of Measurement, Type (UTB or LTB), Formula, and Definition. -
📈 Trend Charts:
Visualize MTD and YTD trends using line and column charts that show Actual, Target, and Previous Year (PY) comparisons.
This page helps you monitor the ongoing health of your production processes. You can identify seasonal patterns, performance dips, or growth areas to make timely adjustments.
3️⃣ Input Data Sheet — The Data Foundation
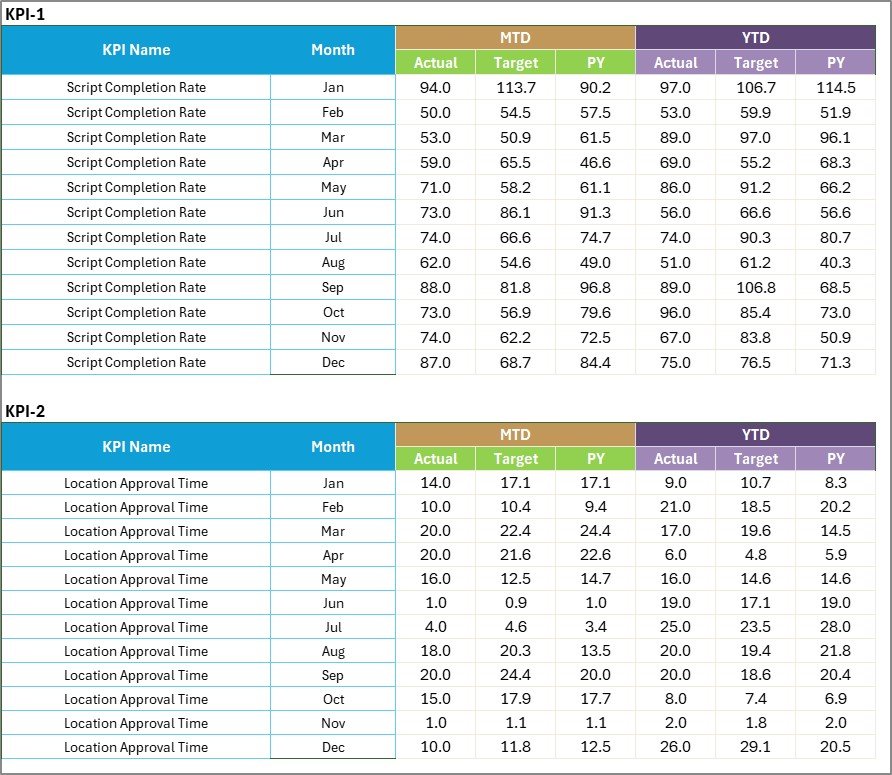
The Input Data Sheet serves as the backbone of the scorecard. It’s where you input or import actual performance data and targets.
Key Features:
-
🧾 Data Entry Section:
Record monthly performance figures for each KPI, including Actuals, Targets, and Previous Year (PY) values. -
🔄 Flexibility:
Easily update data as the project progresses. The moment you enter new data, the entire scorecard updates automatically. -
💡 Accuracy:
Because the data drives every visual and calculation in the dashboard, accuracy here ensures credible insights.
This makes the Excel tool reliable for tracking ongoing projects, budget updates, or any KPI fluctuations across departments like production, editing, or promotions.
4️⃣ KPI Definition Sheet — The Knowledge Base
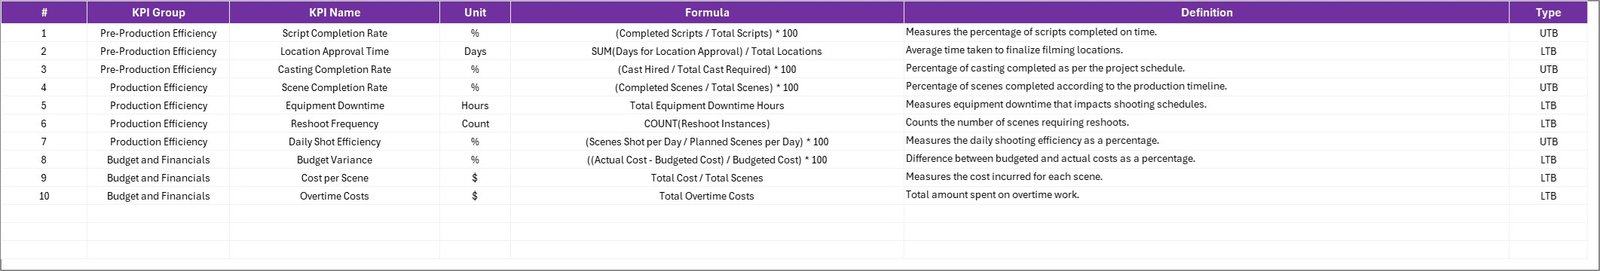
The KPI Definition Sheet is where you document the logic behind each metric. It ensures transparency and consistency across the entire team.
Key Features:
-
🏷 KPI Name and Group:
Define what each KPI measures and which department it belongs to (e.g., Production Efficiency, Marketing Performance, Budget Management). -
⚖️ Unit and Formula:
Mention how the KPI is calculated and which units (e.g., %, hours, USD) it uses. -
📘 Definition:
Describe what the KPI represents and why it matters.
This sheet acts as your in-house reference manual for all metrics, ensuring everyone interprets results the same way.
🎬 Why Film Production Needs KPI Tracking
Film production involves hundreds of moving parts — from script development and casting to shooting schedules, editing, marketing, and release management. Without a unified performance system, it’s easy to lose control.
A Film Production KPI Scorecard bridges that gap by:
-
📆 Tracking deadlines and production timelines
-
💰 Controlling costs and comparing budgets
-
🎥 Monitoring shoot efficiency and daily output
-
👥 Managing team productivity and resource allocation
-
🪜 Measuring ROI across different production stages
It turns chaos into clarity and supports data-backed decision-making — something every modern production team needs.
💡 How the Film Production KPI Scorecard Helps You
Using a Film Production KPI Scorecard in Excel offers numerous benefits for filmmakers, producers, and studios alike.
Let’s explore how it helps you in practical terms:
🎯 1. Enhances Financial Control
Budgets in film production are dynamic. The scorecard helps monitor spending patterns and spot early deviations before they become serious financial issues.
⏱ 2. Improves Scheduling Efficiency
Keep your shoots, editing, and promotions on track by monitoring MTD and YTD progress. This ensures the project stays aligned with its release timeline.
📊 3. Enables Data-Driven Decisions
Instead of assumptions, use real-time visuals to decide where to allocate resources or cut costs.
👥 4. Promotes Team Accountability
With clear KPI ownership, each department knows its responsibilities and can focus on measurable goals.
🌎 5. Facilitates Transparency
When everyone uses the same data source, communication between directors, producers, and investors becomes smoother and more transparent.
⚙️ Advantages of Film Production KPI Scorecard in Excel
Here are the major advantages of using this scorecard:
-
✅ Easy to use — no need for specialized software.
-
📈 Real-time updates whenever data changes.
-
🎨 Visual indicators and conditional formatting for quick understanding.
-
💼 Suitable for both small studios and large-scale productions.
-
🧮 Customizable to fit specific production KPIs.
-
💬 Promotes collaboration across departments.
Unlike complex BI tools, Excel provides simplicity, flexibility, and speed, making it ideal for film production houses that want actionable insights without high costs.
Click to Purchases Film Production KPI Scorecard in Excel
🔍 How to Use the Film Production KPI Scorecard Effectively
Here’s a quick step-by-step process to get started:
-
Open the Excel file and go to the Input Data Sheet.
-
Enter all actual and target values for each KPI (monthly or quarterly).
-
Review the KPI Definition Sheet to ensure your metrics are correctly defined.
-
Go to the Scorecard Sheet to view summary insights.
-
Switch between Month, MTD, and YTD views using the dropdown menu.
-
Use the KPI Trend Sheet to track progress over time.
-
Analyze gaps and take corrective actions based on insights.
By following these steps, you’ll get a full 360° view of your film project performance.
🧭 Best Practices for the Film Production KPI Scorecard in Excel
Follow these best practices to get the most from your scorecard:
🎯 Set Clear KPI Targets: Define achievable and measurable targets for every KPI.
🧩 Maintain Data Accuracy: Regularly update the data to avoid misleading visuals.
📅 Review Weekly: Monitor both short-term (MTD) and long-term (YTD) performance.
🔍 Use Visual Indicators Wisely: Keep color codes simple — e.g., green for achieved, red for below target.
📊 Automate Where Possible: Use Excel formulas and data validation to reduce manual errors.
💬 Encourage Departmental Input: Involve every team in defining their KPIs for better engagement.
🧠 Keep It Simple: Avoid cluttered dashboards — clarity leads to faster decisions.
📈 Potential Analyses You Can Perform
With this scorecard, you can perform various insightful analyses such as:
-
Budget vs Actual Analysis: Identify where production spending exceeds or saves money.
-
Efficiency Tracking: Measure how well departments perform against timelines.
-
Trend Analysis: Observe improvement or decline across months.
-
Performance Benchmarking: Compare current projects against previous ones.
-
Return on Investment (ROI): Evaluate marketing and distribution effectiveness post-release.
Each analysis provides actionable intelligence that can improve your next production.
💬 Common Mistakes to Avoid
While using the KPI scorecard, avoid these errors:
❌ Ignoring KPI definitions — inconsistent calculations cause confusion.
❌ Overcomplicating the template — simplicity ensures usability.
❌ Delayed data updates — outdated numbers lead to poor decisions.
❌ Using too many KPIs — focus on the top 10–15 that truly matter.
❌ Ignoring visualization — visuals communicate faster than numbers alone.
🧮 Real-World Example of Usage
Imagine you’re managing a mid-budget film project.
-
Your target shoot duration is 45 days, but due to weather, it extends to 52 days.
-
The scorecard instantly shows 115% of planned days used, alerting you to adjust future schedules.
-
Simultaneously, marketing spend is tracking at only 80% of plan, highlighting a potential underutilization of funds.
-
With just a few clicks, you can make decisions to rebalance your resources.
This practical insight ensures your project stays on budget and on time — all powered by a simple Excel file.
🏁 Conclusion — Turn Data into Direction for Every Film Project
In today’s film industry, where competition and production costs keep rising, relying on intuition alone isn’t enough. A Film Production KPI Scorecard in Excel brings order to complexity.
It transforms everyday operational data into clear visuals and insights, allowing teams to work smarter, faster, and more efficiently.
Whether you’re producing a short film, documentary, or full-scale feature, this Excel scorecard helps you stay aligned with timelines, budgets, and performance goals — ensuring your creative vision translates into successful execution.
Click to Purchases Film Production KPI Scorecard in Excel
❓ Frequently Asked Questions (FAQs)
1️⃣ What is a Film Production KPI Scorecard?
It’s an Excel-based tool that tracks the key performance indicators of film production, such as costs, efficiency, and scheduling adherence.
2️⃣ Who can use this scorecard?
Producers, production managers, directors, and studio heads — basically anyone involved in film project management.
3️⃣ How many KPIs should I track?
Start with around 10–15 core KPIs across budget, production, marketing, and post-production areas. Expand only if needed.
4️⃣ Can this scorecard be customized?
Yes, absolutely. You can add or remove KPIs, change visuals, or modify formulas to match your production requirements.
5️⃣ Does it support automation?
Yes. With Excel formulas, dropdowns, and conditional formatting, most calculations and visuals update automatically.
6️⃣ Is it suitable for small studios or independent filmmakers?
Yes, it’s perfect for small teams who want professional performance management without investing in expensive software.
7️⃣ Can I use this scorecard for multiple projects?
Definitely. You can duplicate the template for each film project and maintain separate records.
8️⃣ What kind of charts does it include?
The KPI Trend Sheet includes line and column charts for visualizing monthly and yearly trends in Actual, Target, and PY data.
Click to Purchases Film Production KPI Scorecard in Excel
Visit our YouTube channel to learn step-by-step video tutorials