Managing finances across multiple tools and spreadsheets can be chaotic and time-consuming. The Finance & Accounting Command Center solves this problem by bringing together 8 premium finance templates in one powerful bundle — spanning Excel dashboards, Power BI analytics, and Google Sheets trackers. Instead of purchasing each template separately for $147.92, you can get the entire collection for just $79.99 — saving an incredible 46% ($67.93).
🎯 Finance & Accounting Command Center
8 Premium Templates | $147.92 → $79.99 | Save 46%
✨ Key Features of the Finance & Accounting Command Center
This bundle is not just a collection of files — it is a complete financial management ecosystem. The Finance & Accounting Command Center provides real-time visibility into your organization’s financial performance through automated dashboards, interactive KPI cards, and dynamic charts. Every template in this bundle uses built-in formulas that automatically calculate totals, variances, profit margins, and trends — eliminating manual work and reducing errors.
The multi-platform approach means you get the best tool for every scenario: Excel for detailed financial modeling, Power BI for interactive enterprise analytics, and Google Sheets for cloud-based collaboration. With slicers, pivot charts, waterfall visualizations, and department-level drill-downs, every financial question has a clear, data-driven answer at your fingertips.
From tracking daily expenses to forecasting annual budgets, from monitoring cash flow liquidity to analyzing revenue by region and sales channel, this bundle covers every critical aspect of financial management that CFOs, controllers, and finance teams need.
📦 What’s Included in the Bundle
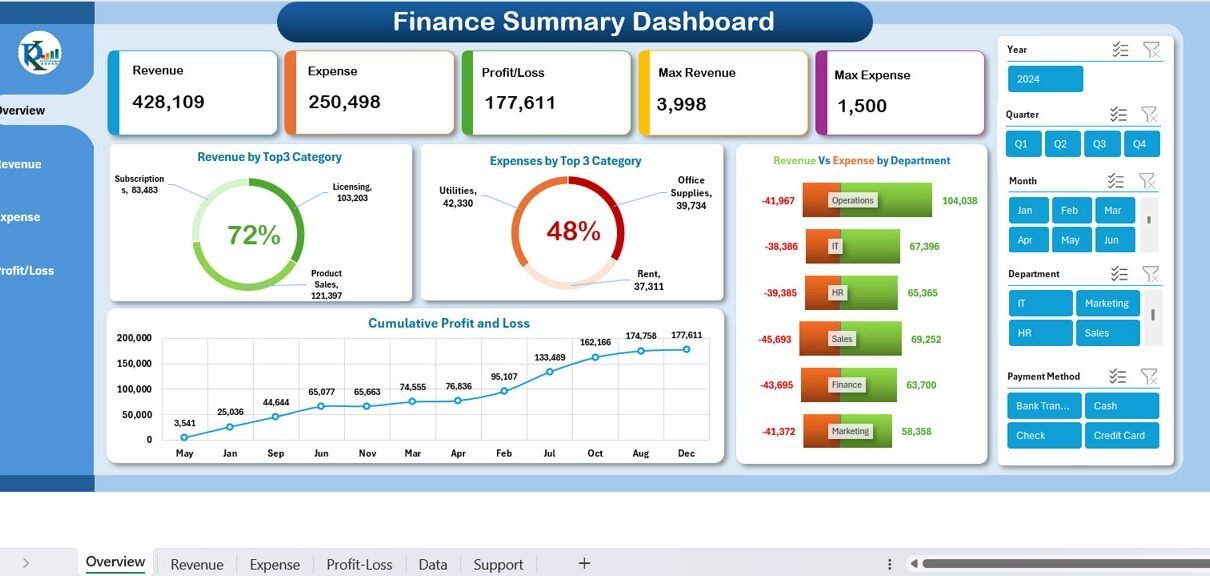
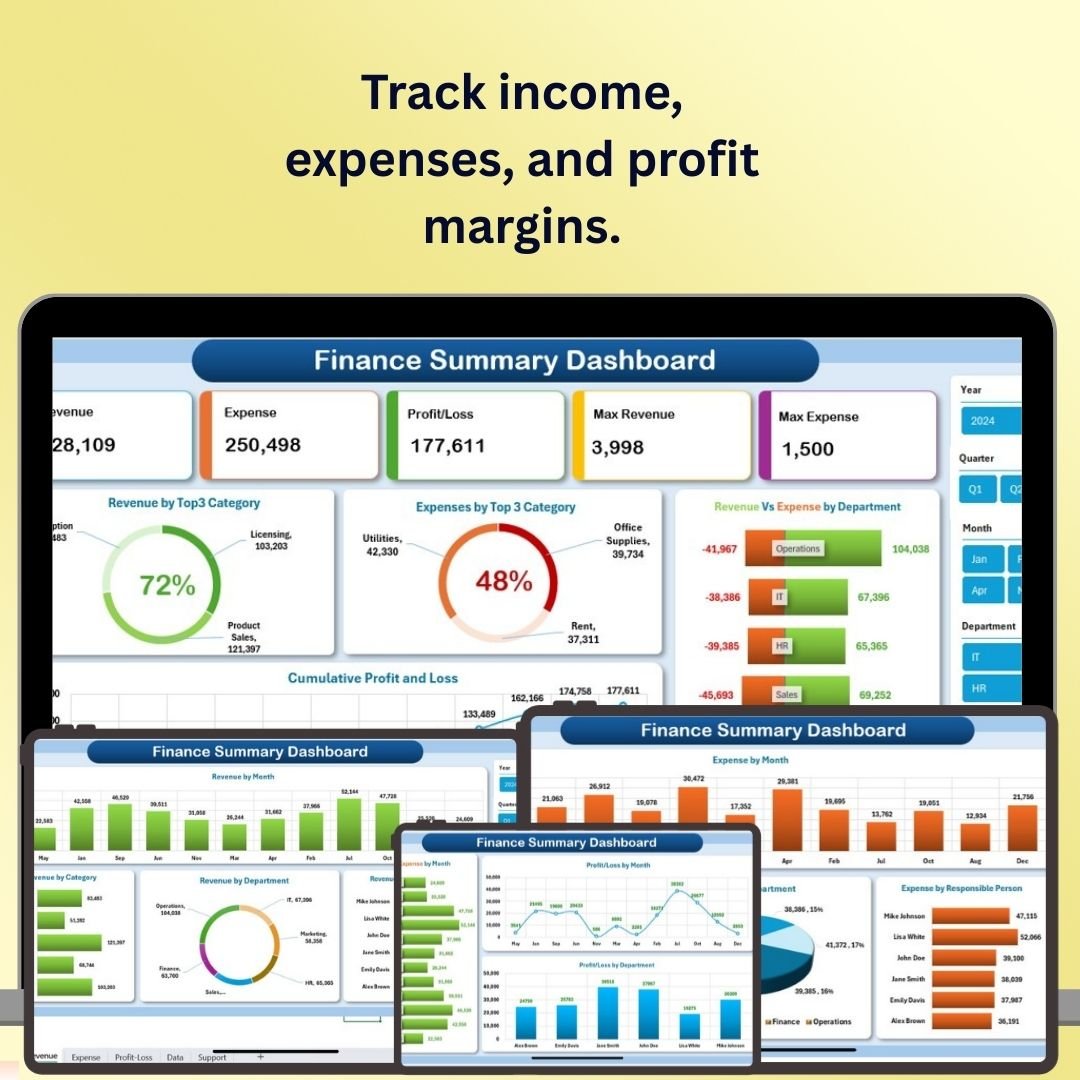
1. Finance Summary Dashboard in Excel
Your central financial hub for monitoring income, expenses, profit margins, and cash flow. This Excel dashboard features interactive charts, real-time KPI tracking, and customizable financial categories. Ideal for getting a comprehensive snapshot of your business’s financial health at any given moment.
 Finance Summary Dashboard in Excel
2. Expense Tracking Dashboard in Power BI
A multi-page Power BI dashboard for deep expense analysis. Includes overview page with CY vs PY comparisons, expense trend analysis by payment method, department and employee spending breakdowns, and category-wise vendor analysis. Dynamic filtering makes it easy to focus on specific departments, months, or categories.
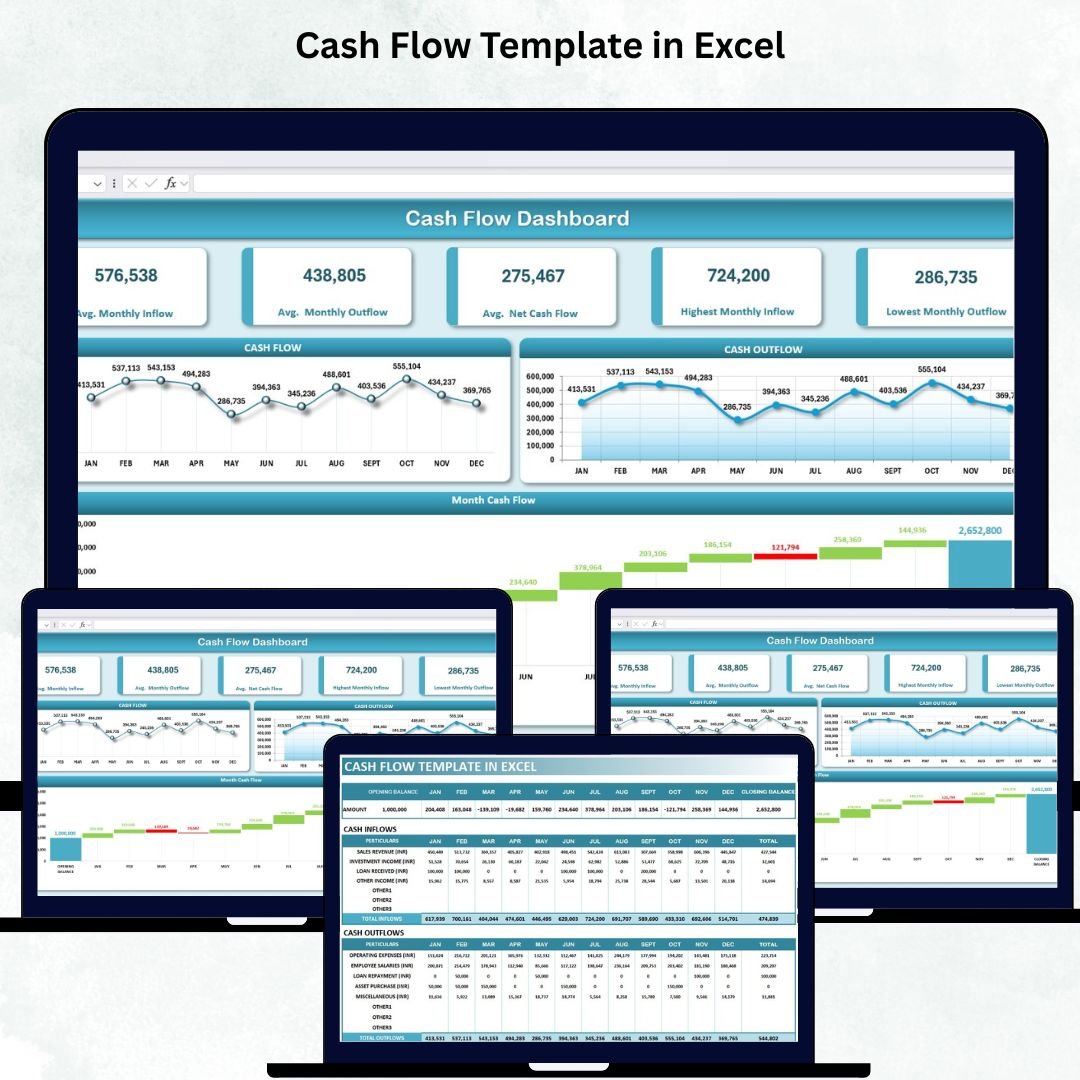
3. Cash Flow Template in Excel
Monitor monthly cash inflows and outflows with automatic net cash and closing balance calculations. Features a professional dashboard with average monthly KPIs and a waterfall chart that visually illustrates how your cash position changes from opening to closing balance throughout the year.
 Cash Flow Template in Excel
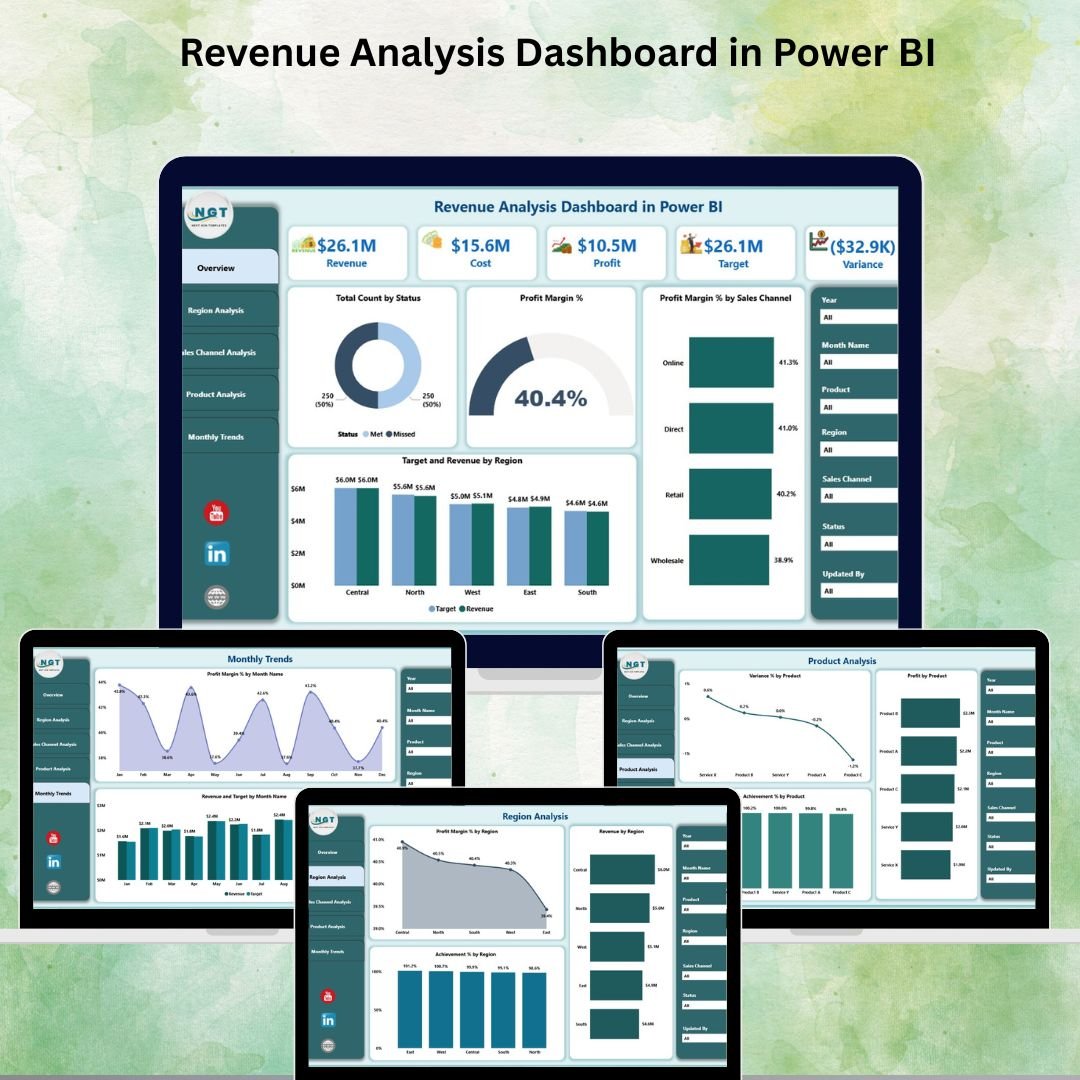
4. Revenue Analysis Dashboard in Power BI
A comprehensive 5-page Power BI dashboard covering overview, regional performance, sales channel comparison, product-level analysis, and monthly trends. With 7 interactive slicers and 5 KPI cards tracking Total Revenue, Profit Margin %, and Target Achievement, this template transforms raw revenue data into actionable insights.
 Revenue Analysis Dashboard in Power BI
5. Income and Expense Dashboard in Google Sheets
A cloud-based financial tracker with automated calculations, customizable income and expense categories, real-time data entry, and color-coded visual charts. Perfect for teams that need collaborative access to financial data from anywhere without requiring Excel or Power BI installations.
 Income and Expense Dashboard in Google Sheets
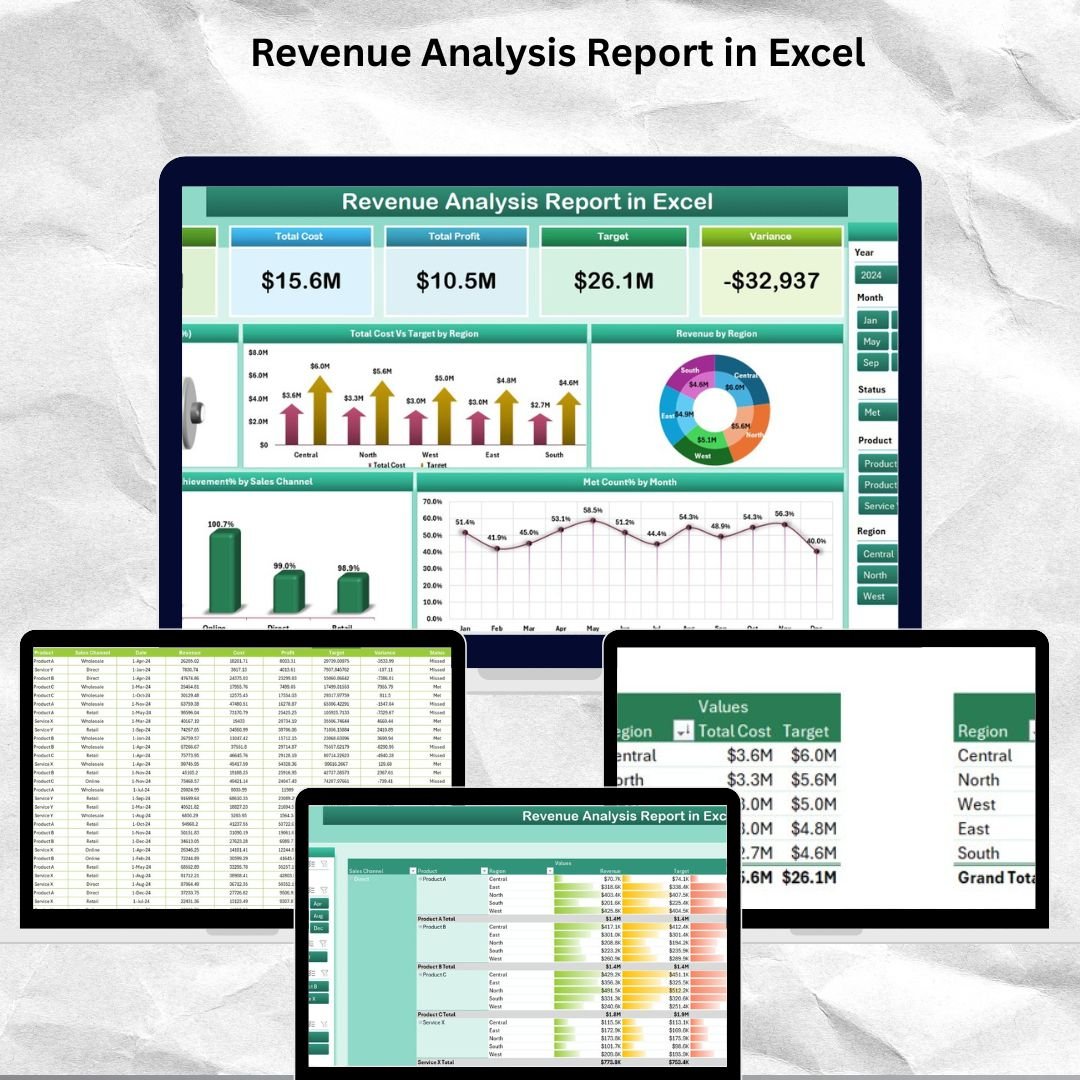
6. Revenue Analysis Report in Excel
A dynamic Excel report with 5 KPI cards, interactive slicers, and 5 visual charts for tracking revenue performance by region, sales channel, and month. Includes a detailed report page with sortable information tables showing revenue, cost, target, variance, and profit margin data.
 Revenue Analysis Report in Excel
7. Monthly Budget Tracker in Microsoft Excel
Track income, expenses, and savings with automated calculations, dynamic pie charts and bar graphs, and interactive slicers for daily and category-wise analysis. Features customizable expense categories like home credit, groceries, utilities, and dining out for detailed personal or business budget tracking.
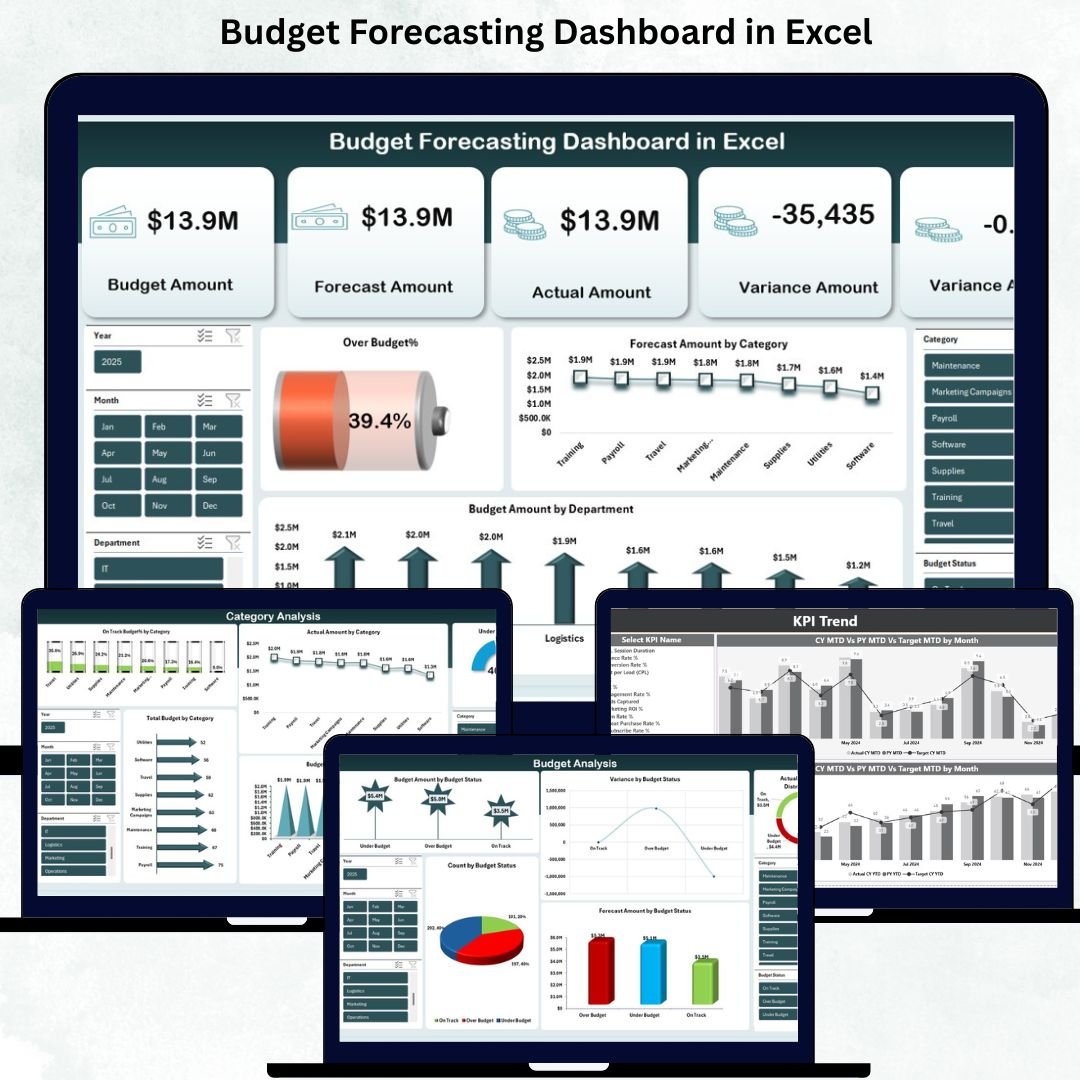
8. Budget Forecasting Dashboard in Excel
A complete budget management tool with KPI cards for total cost, forecast amount, variance percentage, and over-budget tracking. Includes 5 sheets: overview, department analysis, category analysis, budget status tracking, and monthly trends — all interconnected with formulas for seamless financial analysis.
 Budget Forecasting Dashboard in Excel
💡 Smart Comparison — Individual vs Bundle
| # | Product Name | Platform | Individual Price |
|---|---|---|---|
| 1 | Finance Summary Dashboard in Excel | Excel | $17.99 |
| 2 | Expense Tracking Dashboard in Power BI | Power BI | $21.99 |
| 3 | Cash Flow Template in Excel | Excel | $9.99 |
| 4 | Revenue Analysis Dashboard in Power BI | Power BI | $21.99 |
| 5 | Income & Expense Dashboard in Google Sheets | Google Sheets | $17.99 |
| 6 | Revenue Analysis Report in Excel | Excel | $9.99 |
| 7 | Monthly Budget Tracker in Microsoft Excel | Excel | $9.99 |
| 8 | Budget Forecasting Dashboard in Excel | Excel | $17.99 |
| Total Individual Price | |||
| 🏆 Bundle Price (Save 46%) | $79.99 | ||
🚀 Advantages of Buying the Bundle
Purchasing the Finance & Accounting Command Center as a bundle offers significant strategic advantages over buying individual templates. You save nearly half the total cost while getting a complete financial toolkit that works together cohesively. Each template complements the others — the cash flow template feeds into your overall finance summary, the expense tracker aligns with your budget forecasting, and the revenue analysis dashboards give you the income side of the equation.
This integrated approach means you can build a full financial reporting system from day one without gaps in coverage. You also get multi-platform flexibility, which means different team members can use the tool that best fits their expertise — Excel for accountants, Power BI for analysts, and Google Sheets for collaborative teams.
📋 Best Practices for Deploying This Bundle
Start by identifying your most urgent financial tracking need — whether it is expense management, cash flow visibility, or revenue analysis. Deploy that template first and populate it with your actual data. Once comfortable, expand to the remaining templates one at a time. Use the budget forecasting dashboard as your planning tool and the expense tracker as your monitoring system. Review the revenue analysis dashboards monthly during financial meetings to keep stakeholders informed.
🔍 Explore More Templates
Browse our full collection of professional dashboard templates:
📊 Power BI Dashboard Templates
📊 Google Sheets Dashboard Templates
❓ Frequently Asked Questions
What platforms are included in this bundle?
The Finance & Accounting Command Center includes templates for Microsoft Excel, Power BI Desktop, and Google Sheets — giving you maximum flexibility to work on the platform you prefer.
Do I need advanced Excel or Power BI skills?
No! All templates are designed to be beginner-friendly with plug-and-play setup. Simply enter your data into the input sheets and the dashboards update automatically using built-in formulas.
Can I customize the categories and layouts?
Yes, every template is fully customizable. You can modify income categories, expense types, department names, and chart layouts to match your specific business requirements.
How do I receive the files after purchase?
After completing your purchase, you will receive an instant download link containing a ZIP file with all 8 templates organized by platform type.
Is this a one-time purchase or subscription?
This is a one-time purchase with lifetime access. You can download and use the templates as many times as you need with no recurring fees.
Who is this bundle best suited for?
This bundle is ideal for CFOs, financial controllers, finance managers, accountants, business owners, and anyone responsible for tracking financial performance, budgets, expenses, and revenue.
🎯 Conclusion
The Finance & Accounting Command Center gives you everything you need to take full control of your organization’s finances. With 8 premium templates spanning Excel, Power BI, and Google Sheets, you get comprehensive coverage of every critical financial function — from daily expense tracking to annual budget forecasting. At just $79.99 (saving 46% compared to individual purchases), this bundle represents exceptional value for finance professionals at any level.
🚀 Take Control of Your Finances Today!
8 Premium Templates | Was $147.92 → Now $79.99 | Save $67.93
Visit our YouTube channel to learn step-by-step video tutorials
Youtube.com/@PKAnExcelExpert