Managing finance and accounting performance requires accuracy, clarity, and speed. However, many finance teams still rely on scattered Excel files, manual reports, and time-consuming reconciliations. As a result, decision-making often becomes slow and reactive.
That is exactly why a Finance and Accounting KPI Dashboard in Excel plays a crucial role in modern organizations. This dashboard brings all critical financial KPIs into one structured, interactive, and easy-to-use Excel file. Moreover, it allows finance professionals to track performance, compare targets, analyze trends, and identify risks in real time.
In this detailed and SEO-friendly article, you will learn what a Finance and Accounting KPI Dashboard in Excel is, why it matters, how it works, its complete worksheet-wise structure, key advantages, best practices, challenges, and frequently asked questions. The language remains simple, practical, and business-focused so you can apply these concepts immediately.
Click to Purchases Finance and Accounting KPI Dashboard in Excel
What Is a Finance and Accounting KPI Dashboard in Excel?
A Finance and Accounting KPI Dashboard in Excel is a ready-to-use analytical system that tracks, monitors, and visualizes key financial performance indicators in one place. Instead of reviewing multiple spreadsheets, finance teams can evaluate all important metrics through interactive charts, tables, and KPI indicators.
Moreover, this dashboard focuses on both short-term performance (MTD – Month-to-Date) and long-term performance (YTD – Year-to-Date). As a result, users can quickly understand financial health, spot deviations, and take corrective actions on time.
Most importantly, Excel remains a familiar and flexible tool. Therefore, teams do not need expensive software or advanced technical skills to implement this dashboard.
Why Do Finance Teams Need a KPI Dashboard in Excel?
Finance and accounting teams handle large volumes of data every month. However, raw data alone does not support decisions. Instead, teams need structured insights.
A Finance and Accounting KPI Dashboard in Excel helps because:
-
It consolidates data into a single source of truth
-
It reduces manual reporting effort
-
It improves visibility into financial performance
-
It supports faster and more confident decisions
-
It enhances accountability across departments
Consequently, organizations move from reactive reporting to proactive financial management.
How Does a Finance and Accounting KPI Dashboard in Excel Work?
The dashboard works on a simple yet powerful concept. First, users enter actual, target, and previous year numbers in dedicated input sheets. Then, Excel formulas and pivot-based logic calculate KPI values. Finally, the dashboard displays results using charts, tables, and indicators.
Because of this structured flow, users can update monthly data in minutes while the dashboard automatically refreshes all insights.
Click to Purchases Finance and Accounting KPI Dashboard in Excel
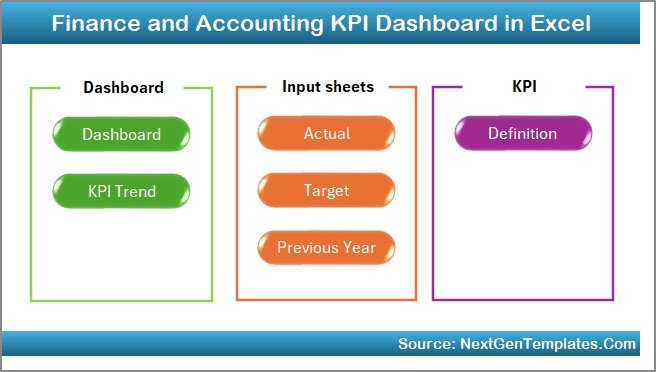
Overall Structure of the Finance and Accounting KPI Dashboard in Excel
This ready-to-use dashboard contains 7 well-designed worksheets, each serving a specific purpose. Together, they create a complete financial performance tracking system.
Let us understand each worksheet in detail.
1. Home Sheet – The Navigation Hub
The Home sheet acts as the index page of the dashboard. Instead of scrolling through tabs, users can jump directly to the required section.
Key Highlights of the Home Sheet
-
Clean and professional layout
-
6 navigation buttons to access major sheets
-
Easy user experience for both beginners and executives
Because of this design, users save time and navigate the dashboard effortlessly.
2. Dashboard Sheet – The Main Performance View
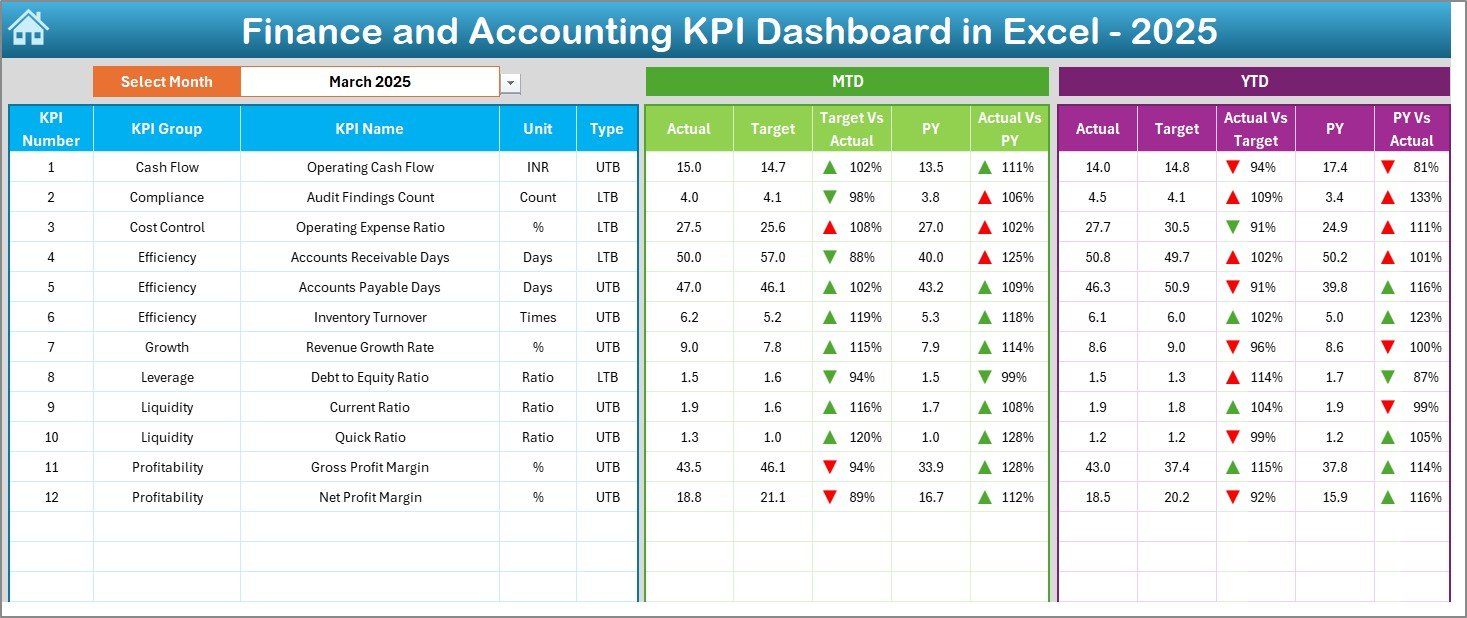
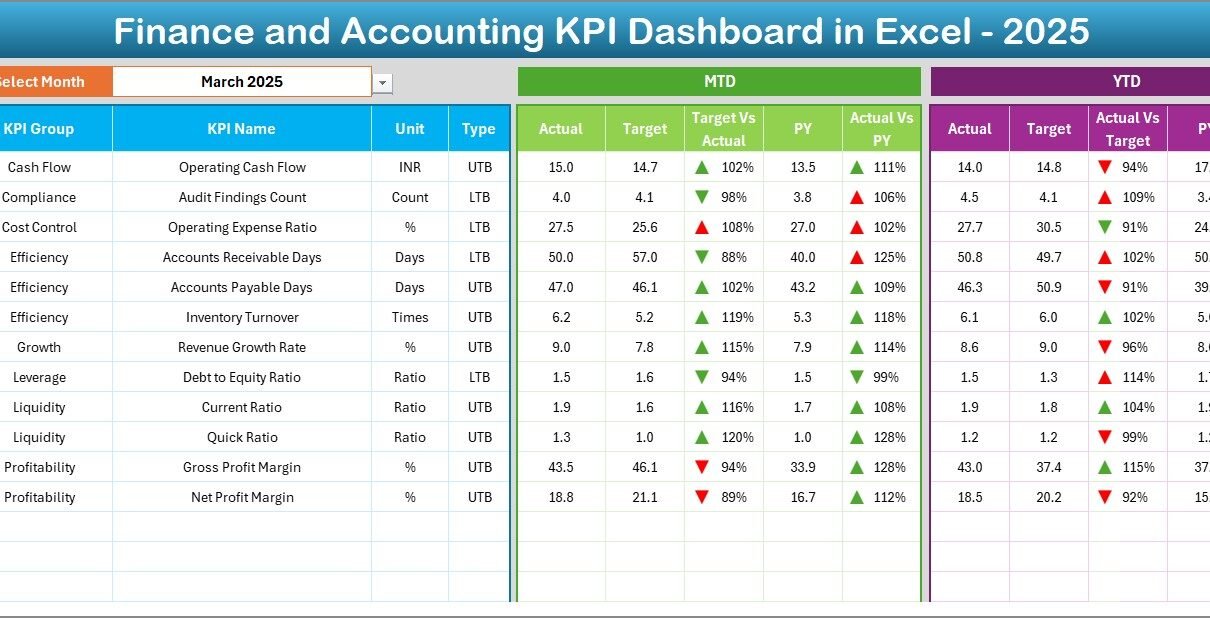
The Dashboard sheet is the heart of the Finance and Accounting KPI Dashboard in Excel. This sheet displays all key KPIs in one consolidated view.
Interactive Month Selection
-
A Month drop-down is available at cell D3
-
When users change the month, the entire dashboard updates instantly
As a result, month-wise analysis becomes fast and accurate.
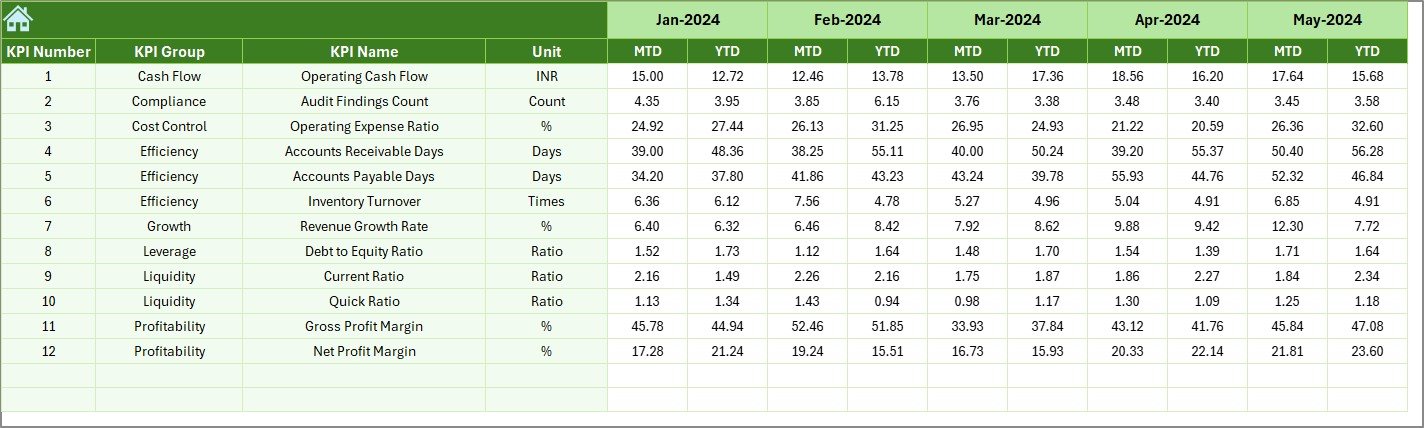
KPIs Displayed on the Dashboard
The dashboard shows both MTD and YTD values for each KPI:
MTD Section
-
Actual
-
Target
-
Previous Year
-
Target vs Actual (with up/down arrows)
-
Previous Year vs Actual (with up/down arrows)
YTD Section
-
Actual
-
Target
-
Previous Year
-
Target vs Actual (with up/down arrows)
-
Previous Year vs Actual (with up/down arrows)
Because of conditional formatting arrows, users can instantly identify whether performance improves or declines.
Click to Purchases Finance and Accounting KPI Dashboard in Excel
3. KPI Trend Sheet – Deep-Dive Analysis
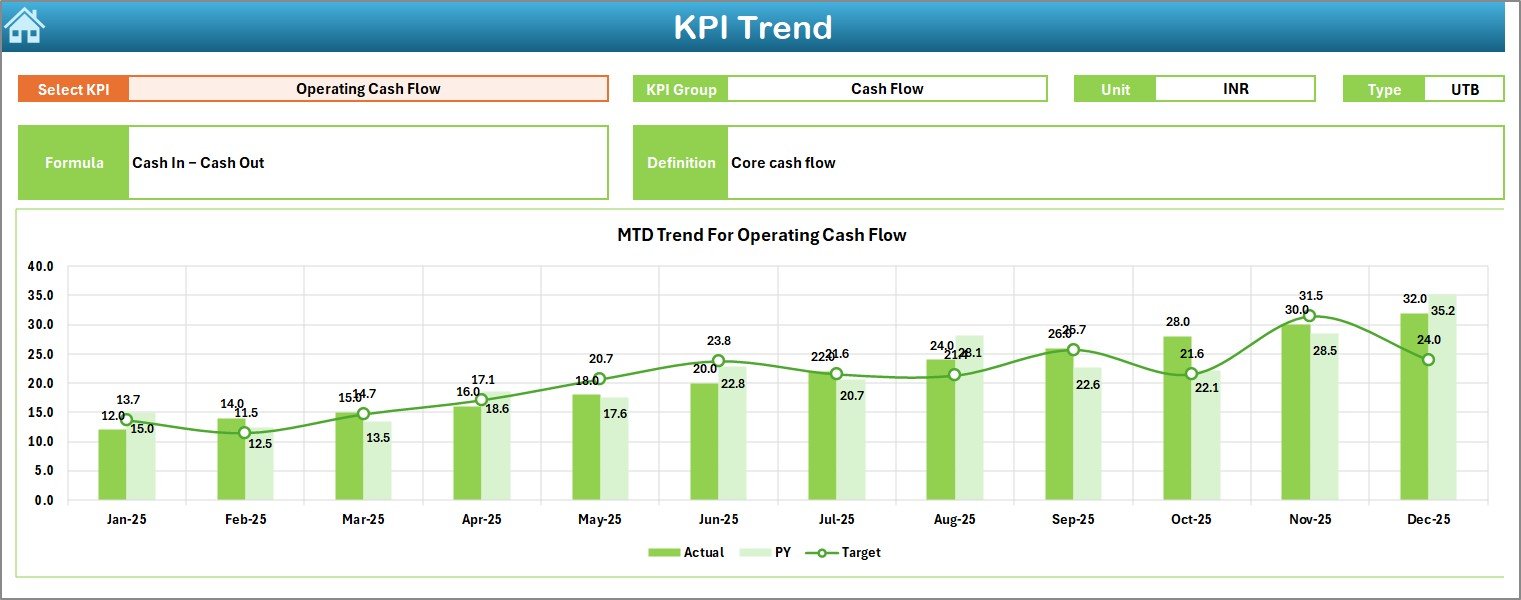
The KPI Trend sheet supports detailed analysis of individual KPIs. Instead of viewing all KPIs together, users can focus on one KPI at a time.
KPI Selection and Details
-
KPI Name selection available at cell C3
-
Displays:
-
KPI Group
-
Unit of KPI
-
KPI Type (Lower the Better / Upper the Better)
-
KPI Formula
-
KPI Definition
-
Trend Analysis Charts
This sheet shows MTD and YTD trend charts for:
-
Actual values
-
Target values
-
Previous Year values
Because of this setup, users can easily analyze performance patterns and seasonality.
4. Actual Numbers Input Sheet – Data Entry Made Simple
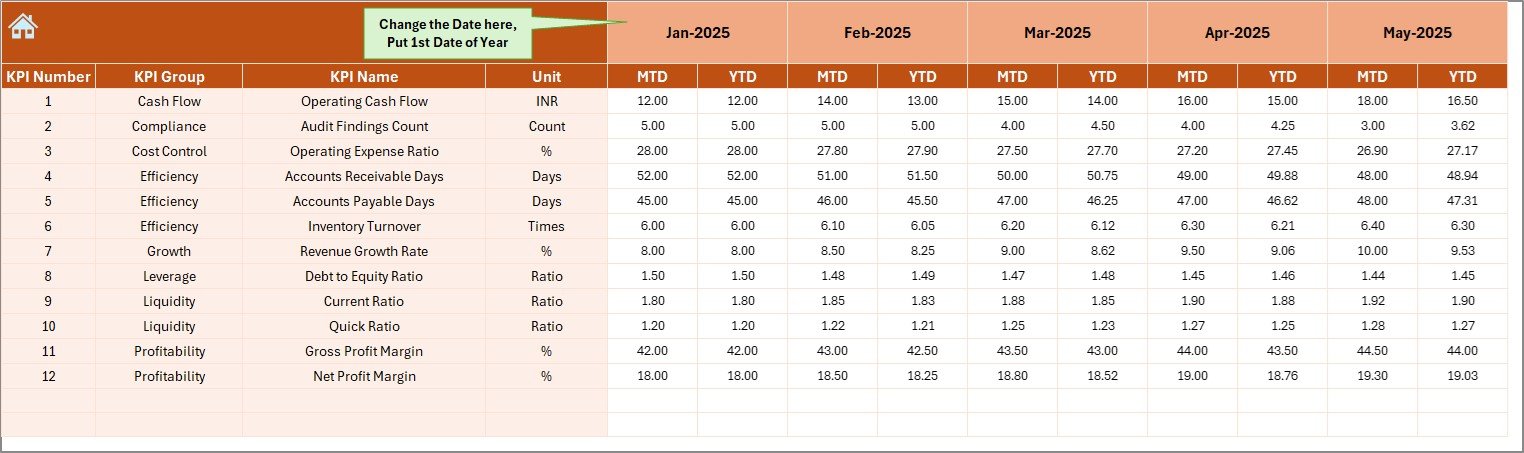
The Actual Numbers Input sheet allows users to enter real performance numbers.
How Data Entry Works
-
Enter the first month of the year in cell E1
-
Select or change the month from cell E1
-
Input MTD and YTD actual numbers for each KPI
This structured approach ensures data consistency across months.
5. Target Sheet – Planned Performance Tracking
The Target Sheet stores planned or expected values for each KPI.
What Users Enter Here
-
Monthly MTD target values
-
Cumulative YTD target values
By maintaining targets separately, users can compare planned vs actual performance accurately.
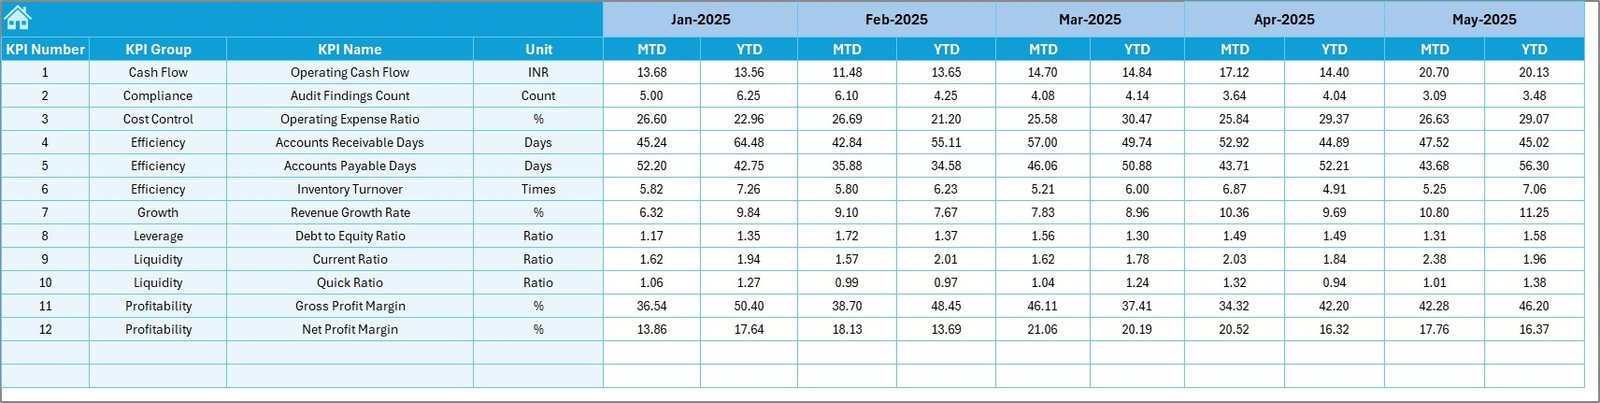
6. Previous Year Number Sheet – Historical Comparison
The Previous Year Number sheet stores last year’s financial data.
Why This Sheet Matters
-
Enables year-over-year comparison
-
Highlights growth, decline, or stability
-
Supports trend-based decision-making
Users enter data in the same format as the current year, ensuring fair comparison.
Click to Purchases Finance and Accounting KPI Dashboard in Excel
7. KPI Definition Sheet – KPI Governance and Clarity
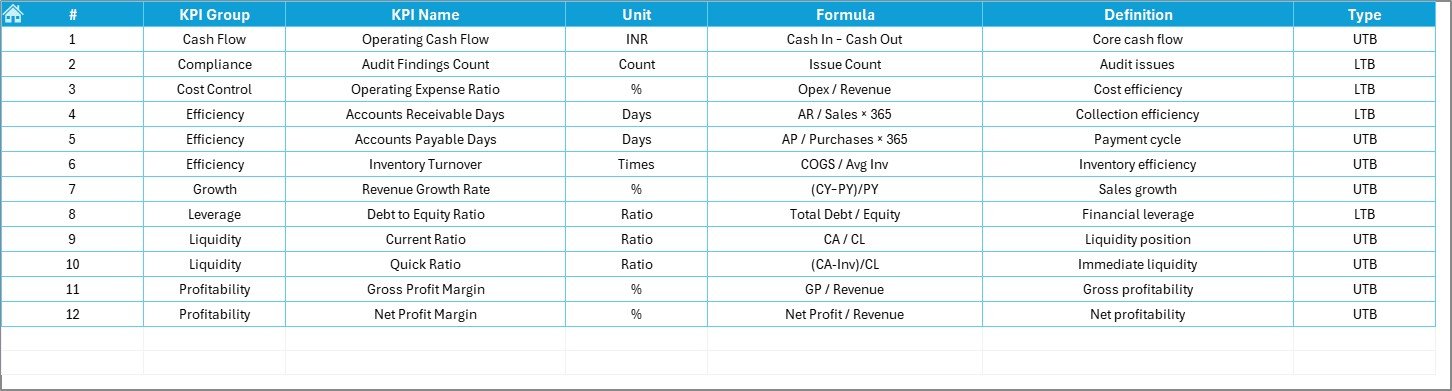
The KPI Definition sheet defines the logic behind each metric.
Information Stored in This Sheet
-
KPI Name
-
KPI Group
-
Unit
-
Formula
-
KPI Definition
Because of this sheet, all stakeholders clearly understand what each KPI measures and how calculations work.
What Types of KPIs Can Be Tracked in This Dashboard?
A Finance and Accounting KPI Dashboard in Excel can track a wide range of financial metrics, such as:
-
Revenue Growth
-
Operating Profit Margin
-
Net Profit Margin
-
Cost Variance
-
Expense Ratio
-
Working Capital
-
Cash Flow
-
Accounts Receivable Turnover
-
Accounts Payable Days
-
Budget Utilization
Because the structure remains flexible, organizations can customize KPIs as needed.
Advantages of Finance and Accounting KPI Dashboard in Excel
Using a Finance and Accounting KPI Dashboard in Excel delivers several strong benefits.
Key Advantages
-
✅ Centralized financial reporting
-
✅ Faster month-end reviews
-
✅ Clear visibility into MTD and YTD performance
-
✅ Easy comparison with targets and previous year
-
✅ No dependency on costly BI tools
-
✅ Fully customizable KPIs
-
✅ Improved accountability across teams
As a result, finance leaders gain control and confidence in their data.
How Does This Dashboard Improve Decision-Making?
This dashboard turns raw numbers into insights. For example:
-
If expenses exceed targets, managers can take immediate cost-control actions
-
If revenue growth slows down, leadership can adjust strategies
-
If cash flow trends decline, teams can improve collections
Therefore, decisions become data-driven instead of assumption-based.
Common Challenges in Finance Reporting Without a Dashboard
Without a structured dashboard, finance teams often face:
-
Manual errors in calculations
-
Delayed reporting cycles
-
Lack of KPI ownership
-
Poor visibility into trends
-
Difficulty comparing periods
However, a Finance and Accounting KPI Dashboard in Excel eliminates most of these challenges.
Click to Purchases Finance and Accounting KPI Dashboard in Excel
Best Practices for the Finance and Accounting KPI Dashboard in Excel
To get maximum value, teams should follow these best practices:
Best Practices
-
✔️ Define KPIs clearly in the KPI Definition sheet
-
✔️ Keep KPI formulas simple and consistent
-
✔️ Update actual data on a fixed monthly schedule
-
✔️ Review MTD and YTD results together
-
✔️ Use trend charts for better forecasting
-
✔️ Limit KPIs to what truly matters
-
✔️ Validate data before monthly reviews
By following these practices, organizations ensure accuracy and long-term usability.
Click to Purchases Finance and Accounting KPI Dashboard in Excel
Who Can Use a Finance and Accounting KPI Dashboard in Excel?
This dashboard suits multiple roles, including:
-
Finance Managers
-
Accounting Teams
-
CFOs and Controllers
-
Business Owners
-
Auditors
-
Financial Analysts
Because Excel remains widely used, adoption becomes easy across departments.
Why Choose Excel for Finance KPI Dashboards?
Excel offers unmatched flexibility. Moreover, it allows:
-
Custom formulas
-
Pivot-based analysis
-
Conditional formatting
-
Easy sharing
-
Offline access
Therefore, Excel remains a practical choice for finance dashboards.
Conclusion
A Finance and Accounting KPI Dashboard in Excel is not just a reporting tool. Instead, it is a complete performance management solution. It brings structure, clarity, and speed to financial analysis. Moreover, it helps organizations monitor KPIs, compare performance, identify risks, and plan corrective actions effectively.
By using a well-designed 7-sheet dashboard structure, finance teams can move from manual reporting to strategic financial insights. When implemented correctly, this dashboard becomes an essential asset for sustainable business growth.
Click to Purchases Finance and Accounting KPI Dashboard in Excel
Frequently Asked Questions (FAQs)
What is the main purpose of a Finance and Accounting KPI Dashboard in Excel?
The main purpose is to track financial performance using KPIs, compare actual results with targets and previous year data, and support faster decision-making.
Can beginners use this dashboard easily?
Yes, the dashboard uses simple Excel features and a structured layout, making it suitable for beginners and experienced users.
Does this dashboard support MTD and YTD analysis?
Yes, it clearly displays both MTD and YTD values along with comparisons.
Can organizations customize KPIs in this dashboard?
Yes, users can add, remove, or modify KPIs through the KPI Definition sheet.
How often should data be updated?
Ideally, teams should update data monthly after closing books.
Does this dashboard require macros or VBA?
No, the dashboard works with standard Excel formulas and features.
Is this dashboard suitable for small businesses?
Yes, small and medium businesses can use it effectively without additional software costs.
Click to Purchases Finance and Accounting KPI Dashboard in Excel
Visit our YouTube channel to learn step-by-step video tutorials