In today’s fast-changing business world, finance and sales leaders face new challenges every day. Disruptions in supply chains, shifts in customer demand, compliance pressures, and unexpected market changes can impact growth and profitability. To stay resilient, companies need to track, plan, and manage their operations effectively. That is where the Finance Sales Supply Chain Resilience Calendar in Excel comes in.
This ready-to-use Excel calendar template is designed to help businesses organize finance and sales operations, monitor supply chain activities, and plan for resilience. It combines ease of use with powerful features, offering managers and teams a structured way to track events, deadlines, and processes all in one place.
Click to Purchase Finance Sales Supply Chain Resilience Calendar in Excel
In this article, we will explore:
-
What the Finance Sales Supply Chain Resilience Calendar is
-
Key features of the calendar template
-
How each worksheet works in detail
-
Advantages of using this calendar
-
Opportunities for improvement
-
Best practices for making the most of it
-
FAQs with clear answers
Let’s dive in.
What Is the Finance Sales Supply Chain Resilience Calendar in Excel?
The Finance Sales Supply Chain Resilience Calendar is a digital planning and monitoring tool built in Microsoft Excel. It provides a structured calendar system that supports annual, monthly, and daily views. At its core, it helps businesses track important supply chain events, financial deadlines, sales milestones, and resilience strategies in a single workbook.
Unlike paper calendars or basic scheduling tools, this Excel-based calendar is interactive, customizable, and automated. Users can switch themes, highlight important days, add or edit events using simple buttons, and view the impact of activities across different timeframes.
This makes it particularly useful for organizations that need to:
-
Align finance, sales, and supply chain operations
-
Improve visibility of upcoming deadlines and risks
-
Enhance resilience by planning for disruptions and contingencies
-
Collaborate across departments with a centralized digital tool
Key Features of the Calendar
This calendar template is designed with practicality in mind. It contains five main worksheets, each with unique features:
-
Home Sheet Tab
-
Annual View Sheet Tab
-
Monthly View Sheet Tab
-
Daily View Sheet Tab
-
Events Sheet Tab
Let’s go through each sheet in detail.
1. Home Sheet Tab
The Home sheet is the index page of the workbook. It offers quick navigation to other parts of the calendar with four main buttons:
-
Annual View – Takes you to the yearly calendar.
-
Monthly View – Opens a single-month calendar view.
-
Daily View – Displays events for specific date ranges.
-
Events – Jumps to the database where all event records are stored.
This sheet acts as the “control tower” of the workbook. Instead of scrolling through multiple tabs, users can jump directly to the section they need.
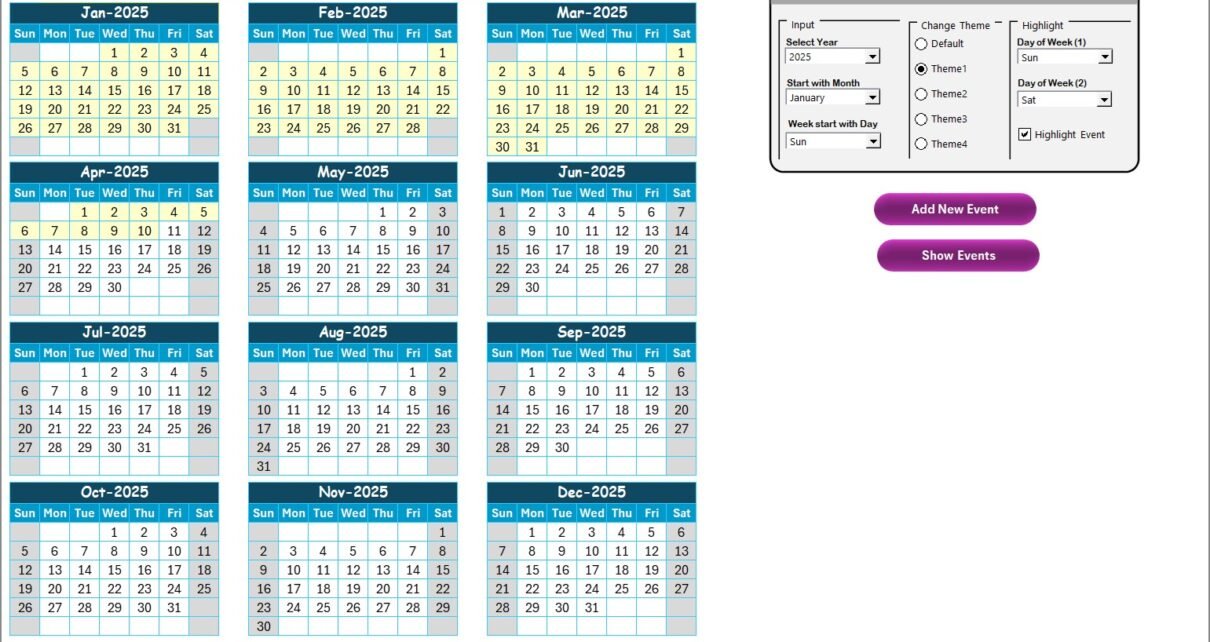
2. Annual View Sheet Tab
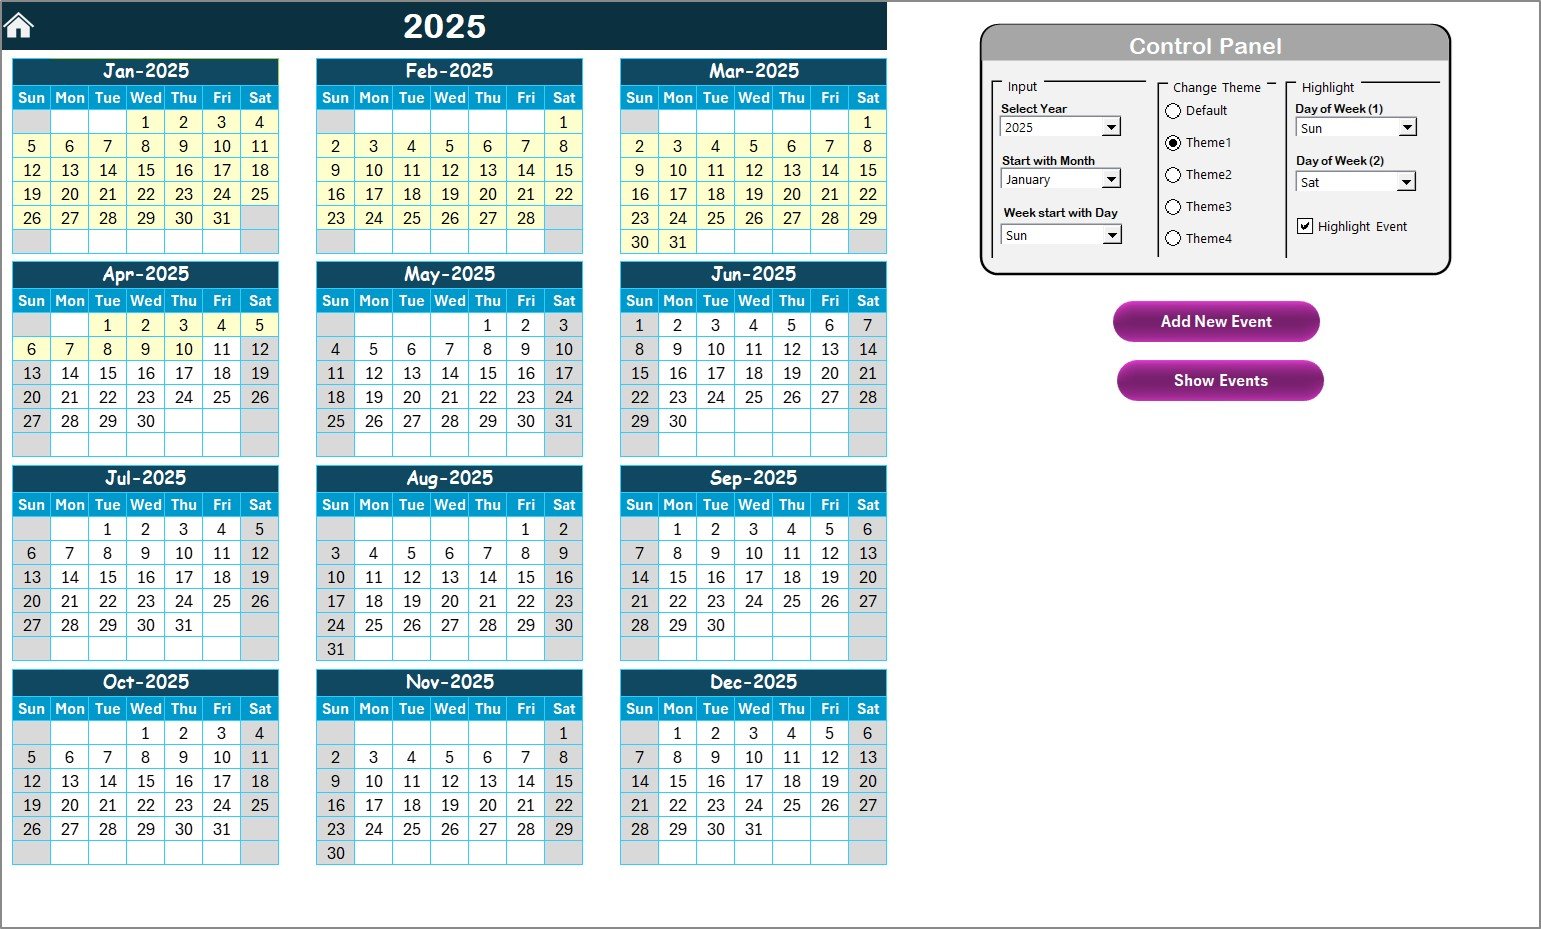
The Annual View provides a 12-month overview of the calendar. It includes a control panel and customization options:
Control Panel Features
-
Input Group
-
Select the year to automatically update the calendar.
-
Change the starting month of the calendar.
-
Adjust the starting day of the week (e.g., Monday vs. Sunday).
-
-
Change Theme Group
-
Choose from five pre-set color themes.
-
Apply the chosen theme across the workbook instantly.
-
-
Highlight Group
-
Highlight up to two days of the week (e.g., Saturday & Sunday).
-
Highlight events in yellow for better visibility.
-
Functional Buttons
-
Add New Event – Click a date, then add an event via a simple form.
-
Show Event – View all events scheduled for the selected date.
This sheet is particularly useful for long-term planning, such as:
-
Tracking financial deadlines (quarterly reports, tax filings)
-
Monitoring supply chain checkpoints (shipment arrivals, audits)
-
Aligning sales campaigns and targets across the year
3. Monthly View Sheet Tab
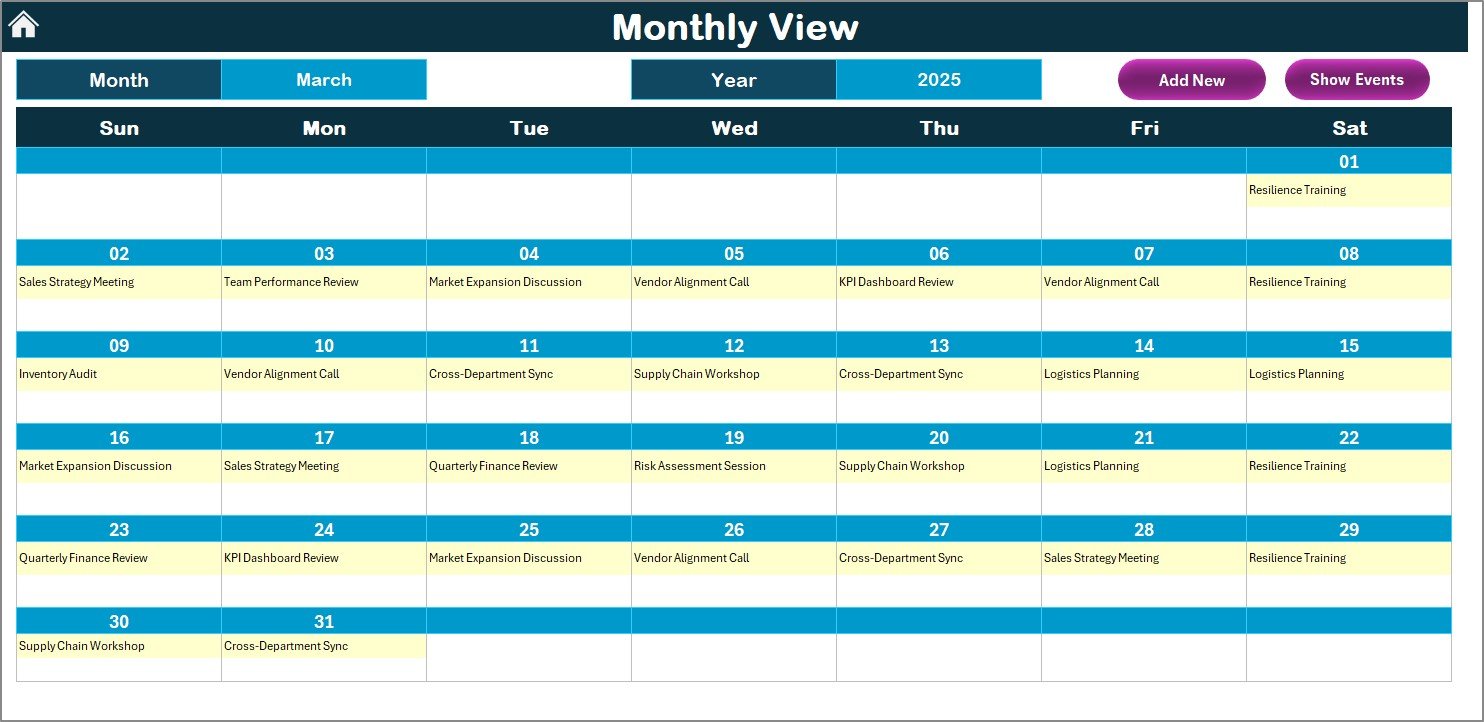
The Monthly View focuses on one month at a time. Users can select both the Month and Year from dropdowns at the top.
Features of the Monthly Calendar
-
Shows all days of the month in a structured calendar grid.
-
Displays one event per date directly.
-
If more than one event exists, it shows “more than 1…” as an indicator.
Functional Buttons
-
Add New Event – Add an event for the selected date.
-
Show Event – View detailed event lists for the chosen date.
This sheet is ideal for tactical planning where managers focus on:
-
Sales targets for the month
-
Supplier deliveries and follow-ups
-
Client meetings and negotiations
-
Compliance deadlines
4. Daily View Sheet Tab
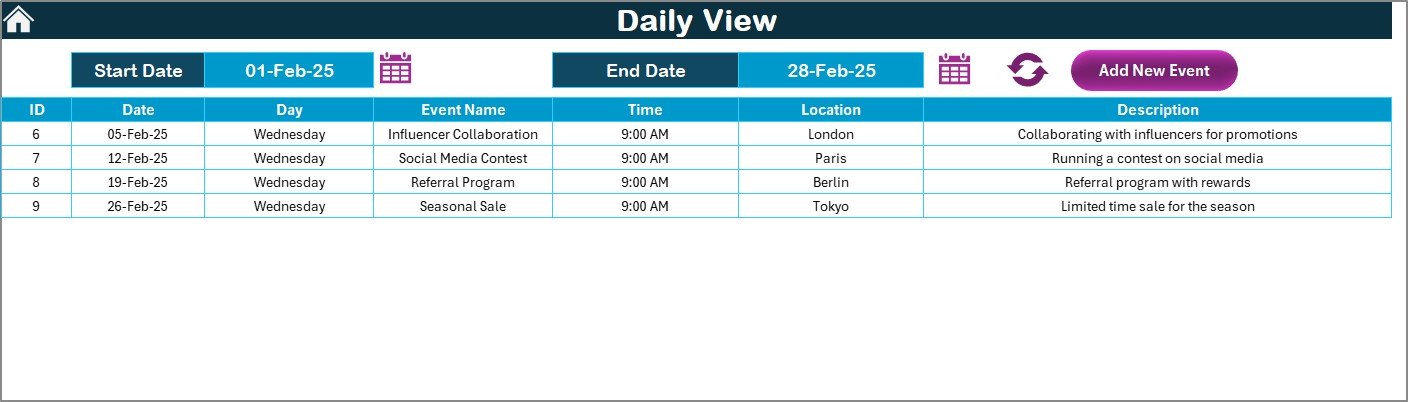
The Daily View provides a detailed list of events within a selected date range.
Features
-
Select Start Date and End Date using the calendar icon.
-
Click Refresh to view events within that range.
-
Add new events directly from the top toolbar.
This sheet is useful for short-term operational management, including:
-
Monitoring daily supply chain activities
-
Scheduling sales calls and meetings
-
Tracking finance tasks like reconciliations or payments
It ensures that no critical daily activity gets overlooked.
5. Events Sheet Tab
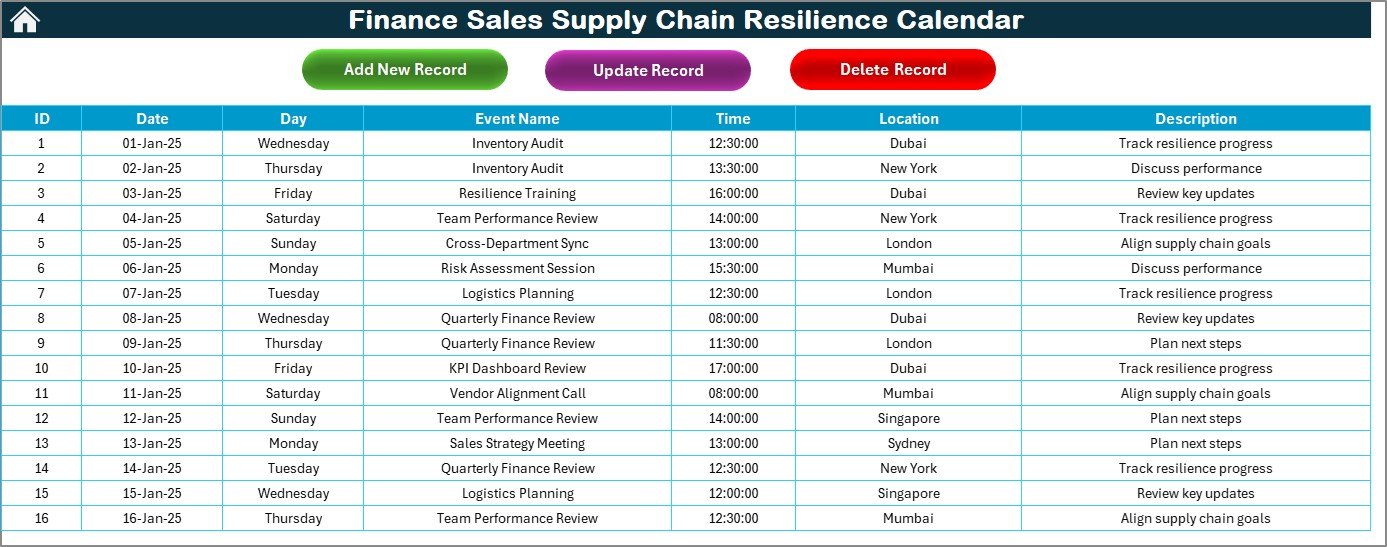
The Events sheet is the database of all records. Every event added across different views gets stored here.
Columns Captured
-
ID – Auto-generated number
-
Date – Date of event
-
Day – Day of the week (e.g., Monday)
-
Event Name – Title of the event
-
Time – Time of the event
-
Location – Where it will take place
-
Description – Short notes about the event
Functional Buttons
-
Add New Record – Add a new event with a simple form.
-
Update Existing Record – Select the event ID, edit, and resubmit.
-
Delete Record – Remove any outdated or incorrect entry.
This sheet acts as the master database and is essential for reporting and tracking historical data.
Advantages of the Finance Sales Supply Chain Resilience Calendar
Using this calendar provides several benefits for businesses:
-
Improved Coordination – Aligns finance, sales, and supply chain activities.
-
Centralized Data – Keeps all events in one Excel file, reducing confusion.
-
Automation – Dropdowns, buttons, and forms reduce manual effort.
-
Flexibility – Works for small businesses as well as large enterprises.
-
Customization – Users can change themes, highlight days, and adjust calendars.
-
Decision Support – Provides visibility into risks, delays, and opportunities.
-
Cost Efficiency – Excel-based, so no need for expensive software.
Opportunities for Improvement
Even though this calendar is powerful, businesses can enhance it further:
-
Integration with Outlook or Google Calendar for email reminders
-
Mobile compatibility for tracking events on the go
-
Automated alerts for overdue tasks
-
KPI dashboards linked to event outcomes (e.g., on-time shipments, missed deadlines)
-
Collaboration features to allow multiple users to update simultaneously
Best Practices for Using the Calendar
To make the most of this tool, consider these best practices:
-
Regular Updates – Ensure events are added and updated on time.
-
Color Coding – Use themes and highlights to separate finance, sales, and supply chain events.
-
Review Weekly – Use the Daily and Monthly views to stay on top of tasks.
-
Leverage the Database – Export the Events sheet for analysis and reporting.
-
Assign Owners – Each event should have a responsible person for accountability.
-
Backup Files – Save versions of the calendar to avoid data loss.
Conclusion
The Finance Sales Supply Chain Resilience Calendar in Excel is more than just a calendar. It is a business resilience tool that helps companies plan, manage, and monitor key activities across finance, sales, and supply chain functions. With its user-friendly interface, automation features, and centralized database, it ensures better decision-making, improved coordination, and stronger resilience in uncertain times.
Whether you are a finance manager, sales director, or supply chain leader, this calendar gives you the clarity and control you need to keep operations running smoothly.
Click to Purchase Finance Sales Supply Chain Resilience Calendar in Excel
Frequently Asked Questions (FAQs)
1. Who can use the Finance Sales Supply Chain Resilience Calendar?
This calendar is useful for finance teams, sales departments, supply chain managers, and business owners who need to track deadlines and events.
2. Can I customize the themes and views?
Yes. The template includes five themes and options to highlight weekends, holidays, or important days.
3. Do I need advanced Excel skills to use this calendar?
No. The template is ready-to-use with simple buttons and dropdowns. Basic Excel knowledge is enough.
4. Can I track multiple events on the same day?
Yes. The Monthly View shows one event directly, but if multiple events exist, it displays “more than 1…” and you can view details with the Show Event button.
5. Is this calendar suitable for small businesses?
Absolutely. Since it is Excel-based, it works well for both small teams and large organizations without requiring extra cost.
6. Can I add new features like reminders or dashboards?
Yes. Advanced users can enhance the template by adding macros, formulas, or Power BI dashboards for extended reporting.
Visit our YouTube channel to learn step-by-step video tutorials
Click to Purchase Finance Sales Supply Chain Resilience Calendar in Excel