In today’s fast-changing business environment, organizations must maintain strong financial controls, ensure regulatory compliance, and monitor operational risks continuously. However, many companies still manage audits using scattered spreadsheets, manual reports, and disconnected systems. As a result, audit teams often struggle to track findings, measure progress, and identify risks quickly.
Therefore, businesses increasingly adopt data-driven audit monitoring tools that simplify analysis and improve decision-making. One powerful solution is the Financial Auditing Dashboard in Excel — a ready-to-use system designed to monitor audit performance, risk findings, corrective actions, and audit efficiency in a structured and visual format.
In this comprehensive guide, you will learn everything about the Financial Auditing Dashboard in Excel, including its structure, features, benefits, implementation methods, best practices, and frequently asked questions.
Click to Purchases Financial Auditing Dashboard in Excel
What Is a Financial Auditing Dashboard in Excel?
A Financial Auditing Dashboard in Excel is an interactive reporting and monitoring tool that helps organizations track audit activities, findings, risks, and performance metrics using visual charts and KPI summaries.
Instead of reviewing multiple audit reports manually, users can monitor all audit information from a centralized dashboard. Consequently, auditors and management teams gain instant visibility into audit progress and compliance status.
Moreover, Excel dashboards provide flexibility, automation, and real-time analysis without requiring expensive software systems.
Why Do Organizations Need an Audit Dashboard?
Organizations face increasing compliance requirements and operational risks. Therefore, they must monitor audits continuously rather than periodically.
An auditing dashboard helps organizations:
-
Track audit progress in real time
-
Monitor high-risk findings
-
Evaluate departmental compliance
-
Measure audit efficiency
-
Improve corrective action management
-
Support strategic decision-making
As a result, leadership teams respond faster to risks and improve governance standards.
Key Features of the Financial Auditing Dashboard in Excel
This ready-to-use Financial Auditing Dashboard in Excel includes structured analytical pages that simplify audit monitoring.
Page Navigator
The dashboard includes a Page Navigator located on the left side, allowing users to move easily between analytical pages. Therefore, users access insights quickly without searching through multiple worksheets.
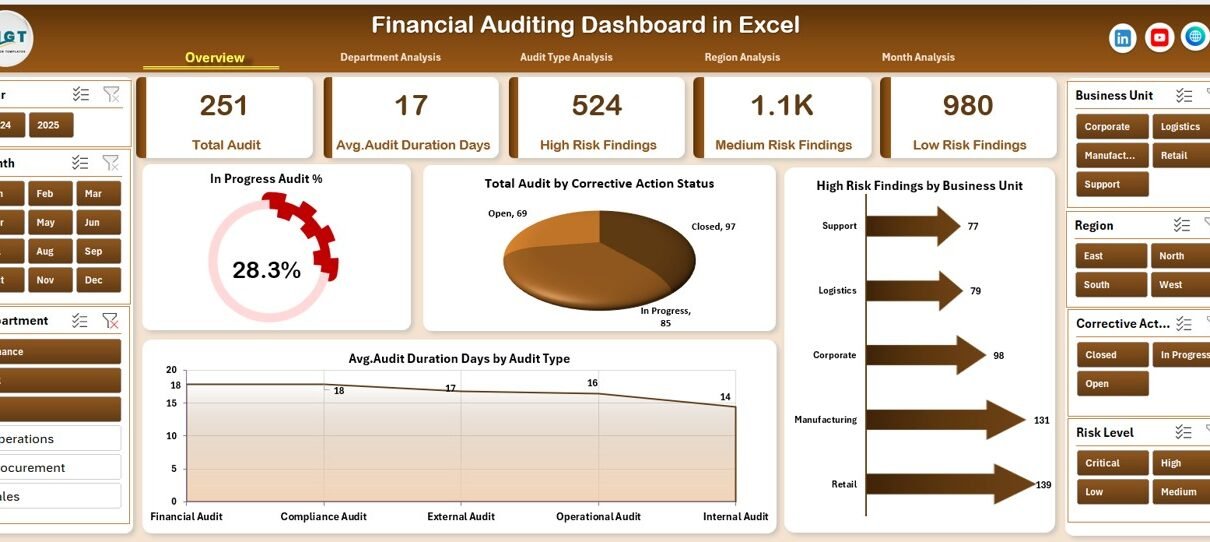
Overview Page – How Does It Provide Executive-Level Insights?
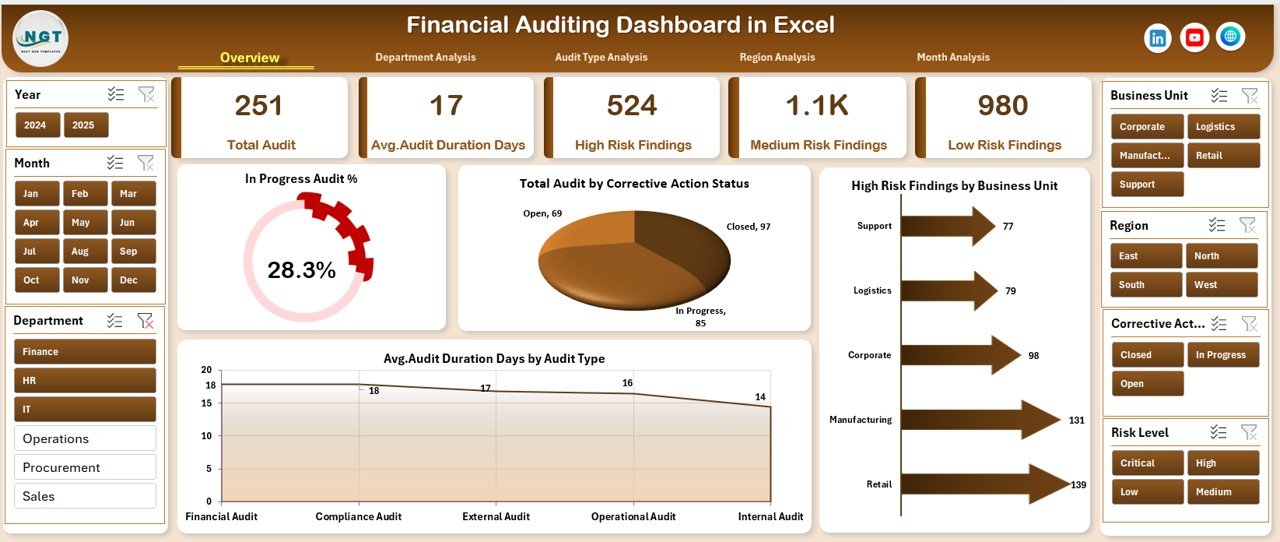
The Overview Page acts as the main control center of the dashboard. It provides a high-level snapshot of audit performance.
Key Components
-
Right-side slicer for filtering data dynamically
-
Four KPI cards showing key audit metrics
-
Visual charts for quick understanding
Charts Included
-
In Progress Audit %
-
Total Audit by Corrective Action Status
-
High Risk Finding by Business Unit
-
Average Audit Duration (Days) by Audit Type
Because this page summarizes overall performance, executives quickly understand audit health without reviewing detailed reports.
Department Analysis – How Can You Compare Audit Performance Across Departments?
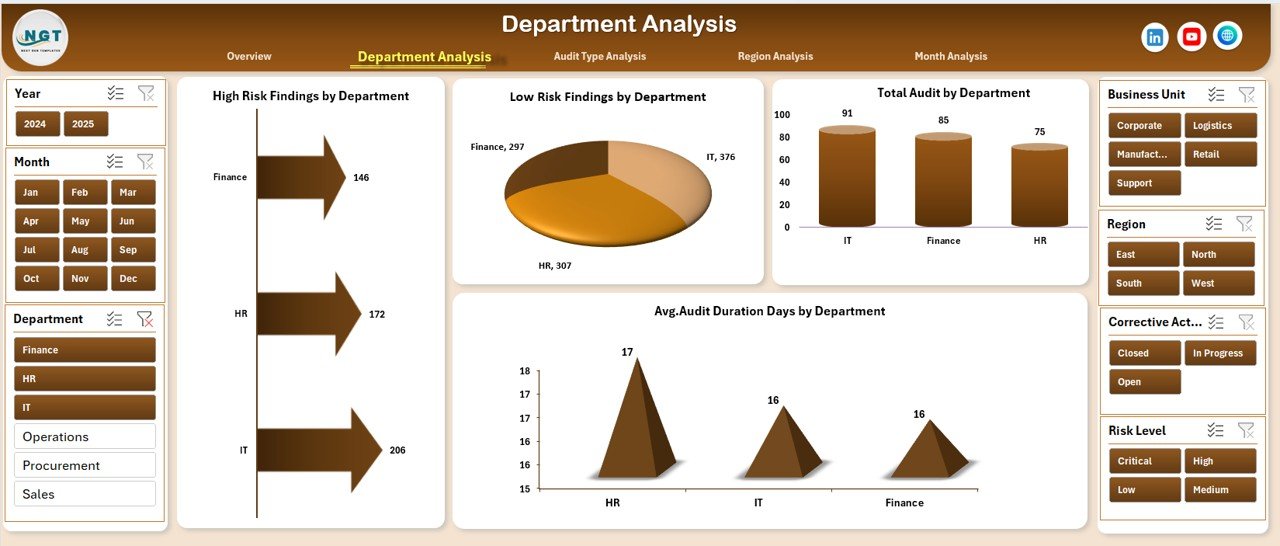
Departments often show different compliance levels. Therefore, analyzing audit findings department-wise becomes essential.
Click to Purchases Financial Auditing Dashboard in Excel
Charts Available
-
High Risk Finding by Department
-
Low Risk Finding by Department
-
Total Audit by Department
-
Average Audit Duration by Department
With these insights, management identifies departments that require immediate corrective action. Additionally, teams can allocate resources more effectively.
Audit Type Analysis – Why Should Audit Types Be Evaluated Separately?
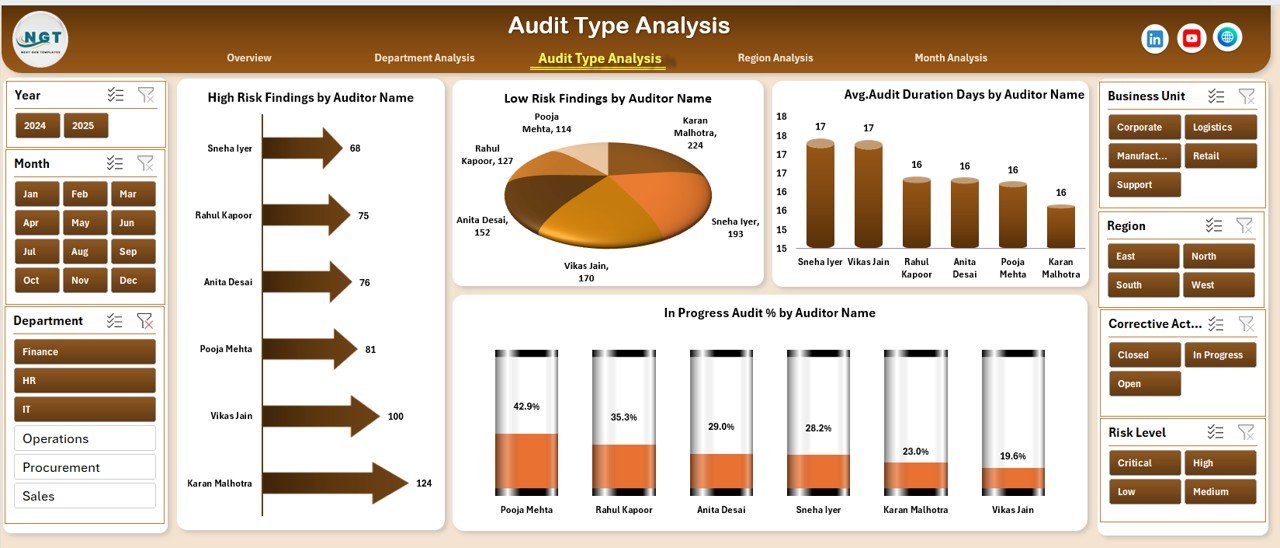
Organizations conduct multiple audit types such as internal audits, compliance audits, operational audits, and financial audits. Each audit type carries unique risks.
Dashboard Visuals
-
High Risk Finding by Audit Name
-
Low Risk Finding by Audit Name
-
In Progress Audit % by Audit Name
-
Average Audit Duration Days by Audit Name
Because audit types differ in complexity, this analysis helps organizations understand which audits consume more time or generate higher risks.
Region Analysis – How Does Geographic Analysis Improve Compliance?
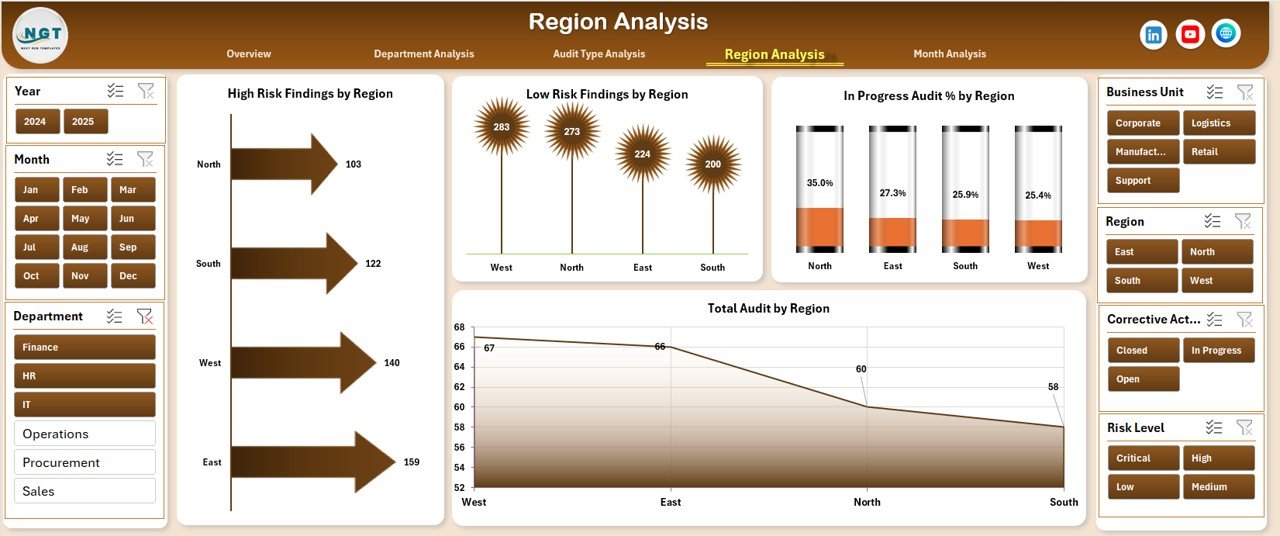
Large organizations operate across multiple regions. However, compliance performance may vary significantly.
Charts Included
-
High Risk Finding by Region
-
Low Risk Finding by Region
-
In Progress Audit % by Region
-
Total Audit by Region
As a result, leadership teams identify high-risk regions and implement targeted compliance strategies.
Month Analysis – Why Is Monthly Audit Tracking Important?
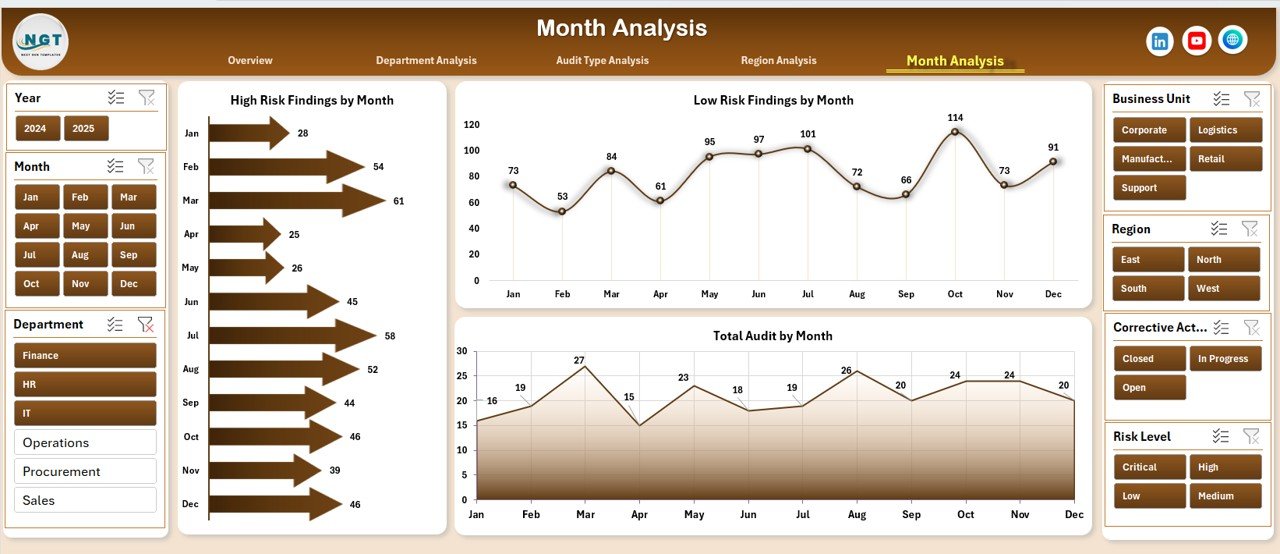
Audit performance changes over time. Therefore, monthly trend analysis helps organizations monitor improvement or decline.
Monthly Charts
-
High Risk Finding by Month
-
Low Risk Finding by Month
-
Total Audit by Month
These visuals help teams:
-
Detect seasonal audit trends
-
Measure improvement initiatives
-
Track compliance consistency
Support Sheet and Data Sheet – The Backbone of the Dashboard
Data Sheet
The Data Sheet stores all audit records such as:
-
Audit Name
-
Department
-
Region
-
Audit Type
-
Risk Level
-
Corrective Action Status
-
Audit Duration
-
Audit Date
Since Excel uses structured tables, users can easily update data and refresh dashboards instantly.
Click to Purchases Financial Auditing Dashboard in Excel
Support Sheet
The Support Sheet manages:
-
Dropdown lists
-
Calculation logic
-
Helper formulas
-
Validation rules
Therefore, users experience smooth dashboard performance without manual adjustments.
What KPIs Can You Track in a Financial Auditing Dashboard?
A strong auditing dashboard focuses on measurable performance indicators.
Common KPIs include:
-
Total Audits Conducted
-
Audit Completion Rate
-
In Progress Audit Percentage
-
High Risk Findings Count
-
Low Risk Findings Count
-
Average Audit Duration
-
Corrective Action Closure Rate
-
Department Compliance Score
-
Regional Risk Index
-
Audit Efficiency Ratio
Because KPIs provide measurable outcomes, organizations track progress objectively.
Advantages of Financial Auditing Dashboard in Excel
Using an Excel-based auditing dashboard offers several practical benefits.
✅ Centralized Audit Monitoring
All audit data appears in one location. Therefore, teams avoid scattered reporting systems.
✅ Improved Decision Making
Visual charts simplify complex audit information. Consequently, managers make faster decisions.
✅ Real-Time Performance Tracking
Once users update data, dashboards refresh instantly.
✅ Cost-Effective Solution
Excel eliminates the need for expensive audit software.
✅ Easy Customization
Organizations modify KPIs, charts, and layouts according to business needs.
✅ Enhanced Risk Management
High-risk findings become visible immediately, enabling proactive action.
✅ Better Compliance Control
Teams track corrective actions and ensure accountability.
How Does the Dashboard Improve Audit Efficiency?
Audit teams often spend excessive time preparing reports. However, dashboards automate reporting tasks.
The dashboard improves efficiency by:
-
Reducing manual report creation
-
Automating calculations
-
Standardizing audit metrics
-
Providing instant visual summaries
-
Simplifying stakeholder reporting
Therefore, auditors focus more on analysis rather than documentation.
How to Use the Financial Auditing Dashboard in Excel?
Click to Purchases Financial Auditing Dashboard in Excel
Follow these simple steps:
Step 1: Enter Audit Data
Add audit records into the Data Sheet using structured fields.
Step 2: Update Audit Status
Change corrective action or audit progress status regularly.
Step 3: Apply Filters
Use slicers to analyze specific departments, regions, or audit types.
Step 4: Review Insights
Navigate between dashboard pages to evaluate performance.
Step 5: Share Reports
Export dashboard views for management presentations.
Best Practices for the Financial Auditing Dashboard in Excel
To achieve maximum value, organizations should follow best practices.
✔ Maintain Clean Data
Always standardize department names and audit categories.
✔ Update Data Regularly
Frequent updates ensure accurate insights.
✔ Define Clear KPIs
Choose KPIs aligned with organizational objectives.
✔ Use Consistent Risk Classification
Define risk levels clearly to avoid confusion.
✔ Monitor High-Risk Findings Weekly
Early action prevents compliance failures.
✔ Limit Manual Editing
Protect formula cells to maintain dashboard integrity.
✔ Train Audit Teams
Ensure users understand dashboard navigation and filters.
Common Challenges in Audit Management (and How the Dashboard Solves Them)
Problem: Manual Reporting Delays
Solution: Automated visuals reduce preparation time.
Problem: Lack of Visibility
Solution: Central dashboard provides transparency.
Problem: Poor Risk Tracking
Solution: High-risk charts highlight critical issues.
Problem: Data Inconsistency
Solution: Structured tables standardize inputs.
Who Can Benefit from a Financial Auditing Dashboard?
This dashboard supports multiple professionals:
-
Internal Auditors
-
Finance Managers
-
Compliance Officers
-
Risk Management Teams
-
CFOs and Executives
-
Corporate Governance Teams
-
Consulting Firms
Because the dashboard uses Excel, even non-technical users can operate it easily.
Why Choose Excel for Audit Dashboards Instead of Complex Software?
Click to Purchases Financial Auditing Dashboard in Excel
Many organizations prefer Excel because:
-
Most employees already know Excel
-
Implementation takes minutes
-
No IT dependency exists
-
Easy integration with existing data
-
High flexibility and customization
Therefore, Excel becomes a practical and scalable solution.
Future of Financial Auditing with Data Dashboards
Modern auditing increasingly relies on analytics and automation. Organizations now shift toward continuous auditing rather than periodic reviews.
Future trends include:
-
Automated risk alerts
-
Predictive audit analytics
-
Integration with ERP systems
-
AI-assisted anomaly detection
-
Real-time compliance monitoring
Consequently, dashboards will become essential tools for governance and transparency.
Conclusion
The Financial Auditing Dashboard in Excel transforms traditional audit management into a structured, visual, and data-driven process. Instead of handling complex audit reports manually, organizations gain instant insights into risks, performance, and compliance status.
Because the dashboard combines automation, visualization, and flexibility, audit teams work faster and make smarter decisions. Furthermore, executives gain clarity through high-level summaries while analysts explore detailed insights through multiple analysis pages.
Ultimately, organizations that adopt auditing dashboards strengthen governance, reduce risks, and improve operational efficiency.
Frequently Asked Questions (FAQs)
1. What is a Financial Auditing Dashboard in Excel?
It is an interactive Excel tool that tracks audit activities, findings, risks, and performance using charts and KPIs.
2. Who should use this dashboard?
Auditors, finance teams, compliance managers, and executives can use it for monitoring audit performance.
3. Can beginners use this dashboard?
Yes. Since it uses Excel, users with basic knowledge can operate it easily.
4. Does the dashboard update automatically?
Yes. When you update the data sheet, charts refresh automatically.
5. Can I customize KPIs?
Yes. You can modify KPIs, charts, and layouts according to business requirements.
6. Is Excel suitable for audit analytics?
Yes. Excel provides powerful analysis tools such as Pivot Tables, slicers, and charts.
7. How often should audit data be updated?
Organizations should update audit data weekly or monthly depending on audit frequency.
8. Can this dashboard support multiple regions?
Yes. The Region Analysis page allows multi-location audit monitoring.
9. Does it help in compliance reporting?
Absolutely. It provides structured insights that simplify compliance reporting.
10. Why should organizations adopt audit dashboards?
Because dashboards improve visibility, efficiency, and risk management while reducing manual reporting effort.
Visit our YouTube channel to learn step-by-step video tutorials