Manufacturing demands precision. Firearms manufacturing demands even more precision. Production must meet strict quality standards. Compliance rules must remain tight. Safety checks must stay consistent. Therefore, manufacturers must track performance carefully.
However, many factories still depend on disconnected spreadsheets. As a result, they miss production trends. They struggle to compare targets with actual output. They cannot analyze year-over-year performance clearly.
So, how can firearms manufacturers monitor production efficiency, defect rates, safety metrics, and financial performance in one structured system?
The answer is simple.
You need a Firearms Manufacturing KPI Dashboard in Excel.
In this detailed guide, you will learn:
-
What Firearms Manufacturing KPI Dashboard in Excel is
-
Why firearms manufacturers need KPI tracking
-
Detailed explanation of all 7 worksheets
-
Important KPIs for firearms manufacturing
-
Advantages of Firearms Manufacturing KPI Dashboard in Excel
-
Best Practices for the Firearms Manufacturing KPI Dashboard
-
Frequently Asked Questions with Answers
Let’s explore everything step by step.
Click to Purchases Firearms Manufacturing KPI Dashboard in Excel
What Is Firearms Manufacturing KPI Dashboard in Excel?
Firearms Manufacturing KPI Dashboard in Excel is a ready-to-use performance tracking template designed specifically for firearms production facilities.
It helps you:
-
Monitor Monthly (MTD) performance
-
Track Year-to-Date (YTD) progress
-
Compare actual vs target values
-
Analyze performance against previous year
-
Identify performance gaps instantly
Because it works in Excel, teams can update data easily. Moreover, managers can review key insights without complex software.
Therefore, this dashboard becomes a powerful operational control tool.
Why Do Firearms Manufacturers Need KPI Monitoring?
Firearms manufacturing involves:
-
Strict quality control
-
Compliance tracking
-
Production planning
-
Cost management
-
Inventory monitoring
Without KPI monitoring:
-
Production delays go unnoticed
-
Quality issues increase
-
Safety compliance becomes weak
-
Financial planning suffers
However, when you implement structured KPI tracking, you gain:
-
Clear operational visibility
-
Faster management decisions
-
Improved quality control
-
Better production efficiency
Therefore, KPI dashboards support both performance and compliance goals.
Click to Purchases Firearms Manufacturing KPI Dashboard in Excel
Key Features of Firearms Manufacturing KPI Dashboard in Excel
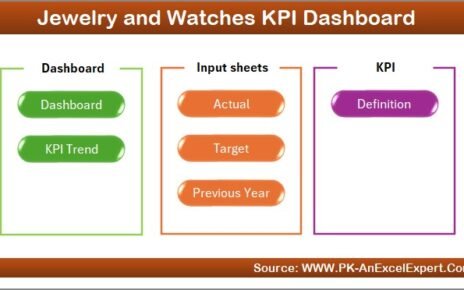
This dashboard includes 7 structured worksheets. Each worksheet serves a specific function.
Let’s review them one by one.
1️⃣ Home Sheet – Navigation Panel

The Home sheet acts as the index page.
Here, you will find 6 buttons that help you navigate to:
-
Dashboard
-
KPI Trend
-
Actual Numbers Input
-
Target Sheet
-
Previous Year Numbers
-
KPI Definition
Because of these buttons, users move across sheets easily.
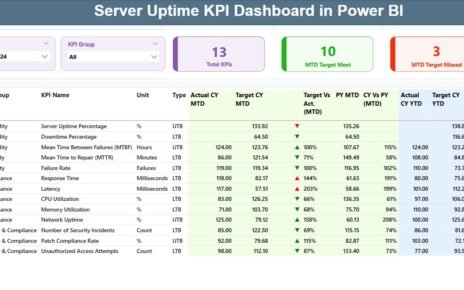
2️⃣ Dashboard Sheet – Main Performance Overview

This sheet serves as the central reporting page.
Month Selection
On range D3, you can select the Month from the drop-down list.
Once you select a month, the entire dashboard updates automatically.
Therefore, performance review becomes dynamic and interactive.
MTD Performance Section
The dashboard shows:
-
MTD Actual
-
MTD Target
-
Previous Year MTD
-
Target vs Actual %
-
PY vs Actual %
It also uses conditional formatting:
-
Green ▲ for strong performance
-
Red ▼ for weak performance
Formula for Target vs Actual (MTD):
Formula for CY vs PY (MTD):
Because of these calculations, you instantly understand performance ratios.
YTD Performance Section
The same structure applies for YTD:
-
Actual YTD
-
Target YTD
-
Previous Year YTD
-
Target vs Actual (YTD)
-
CY vs PY (YTD)
Therefore, managers can analyze both short-term and long-term performance.
Click to Purchases Firearms Manufacturing KPI Dashboard in Excel
3️⃣ KPI Trend Sheet – Visual Analysis

On this sheet, you can select KPI Name from drop-down at C3.
Once selected, the sheet displays:
-
KPI Group
-
Unit
-
Type (LTB or UTB)
-
Formula
-
KPI Definition
Additionally, it shows:
-
MTD Trend Chart
-
YTD Trend Chart
Each chart compares:
-
Actual
-
Target
-
Previous Year
Therefore, you can track trends over time and detect performance patterns quickly.
4️⃣ Actual Numbers Input Sheet

Here, you enter:
-
MTD Actual
-
YTD Actual
You can set the first month of the year in range E1.
After that, you update monthly numbers.
Because of structured input format, data entry becomes simple.
5️⃣ Target Sheet

On this sheet, you enter:
-
Monthly Target MTD
-
Monthly Target YTD
Targets define performance benchmarks. Therefore, accurate target entry ensures reliable analysis.
6️⃣ Previous Year Numbers Sheet

Here, you enter previous year data for:
-
MTD
-
YTD
This data allows year-over-year comparison.
Therefore, management can measure growth or decline accurately.
Click to Purchases Firearms Manufacturing KPI Dashboard in Excel
7️⃣ KPI Definition Sheet

This sheet defines KPI structure.
You must enter:
-
KPI Name
-
KPI Group
-
Unit
-
Formula
-
Definition
Because of this sheet, dashboard becomes dynamic and expandable.
Important KPIs for Firearms Manufacturing
Let’s explore essential KPIs.
Production KPIs
-
Units Produced
-
Production Efficiency Rate
-
Machine Utilization %
-
On-Time Production Rate
Quality KPIs
-
Defect Rate
-
Rework Rate
-
Quality Inspection Pass %
-
Customer Complaint Rate
Safety & Compliance KPIs
-
Safety Incident Rate
-
Compliance Audit Score
-
Regulatory Violation Count
Financial KPIs
-
Cost per Unit
-
Production Cost Variance
-
Gross Profit Margin
Inventory KPIs
-
Raw Material Turnover
-
Finished Goods Inventory Days
-
Stock Accuracy Rate
Tracking these KPIs ensures operational excellence.
Click to Purchases Firearms Manufacturing KPI Dashboard in Excel
Advantages of Firearms Manufacturing KPI Dashboard in Excel
Let’s examine key benefits.
1️⃣ Complete Performance Visibility
You view MTD and YTD metrics in one place.
2️⃣ Dynamic Month Selection
You analyze performance month by month.
3️⃣ Automatic Comparison
Dashboard calculates Target vs Actual and PY vs CY automatically.
4️⃣ Visual Indicators
Up and down arrows simplify analysis.
5️⃣ Customizable KPIs
You can add or modify KPIs easily.
6️⃣ Cost-Effective Solution
Excel eliminates need for expensive software.
7️⃣ Improved Decision-Making
Clear metrics support strategic planning.
Click to Purchases Firearms Manufacturing KPI Dashboard in Excel
Best Practices for the Firearms Manufacturing KPI Dashboard
To maximize value, follow these best practices.
1️⃣ Update Data Monthly
Enter actual numbers consistently.
2️⃣ Validate Target Values
Review targets quarterly.
3️⃣ Maintain Accurate Previous Year Data
Correct historical data ensures valid comparisons.
4️⃣ Classify KPI Type Properly
Define LTB and UTB accurately.
5️⃣ Review Trend Charts Regularly
Monitor fluctuations monthly.
6️⃣ Limit KPI Overload
Focus on meaningful KPIs only.
7️⃣ Backup Data Frequently
Protect sensitive manufacturing information.
How Does This Dashboard Improve Manufacturing Control?
This dashboard transforms raw production data into actionable insights.
Instead of analyzing long reports:
-
Managers see key metrics instantly
-
Supervisors identify quality issues faster
-
Finance teams track cost variance clearly
-
Compliance teams monitor safety metrics
Therefore, performance control becomes proactive rather than reactive.
Conclusion
Firearms manufacturing requires strict control, high precision, and strong compliance. However, without structured KPI tracking, performance gaps remain hidden.
The Firearms Manufacturing KPI Dashboard in Excel provides:
-
MTD and YTD monitoring
-
Target vs Actual comparison
-
Year-over-year analysis
-
Visual trend charts
-
Structured KPI definition system
Because it combines flexibility and automation, it helps manufacturers improve efficiency, quality, and profitability.
If you want a professional and practical manufacturing performance solution, this Excel dashboard delivers everything you need.
Click to Purchases Firearms Manufacturing KPI Dashboard in Excel
Frequently Asked Questions (FAQs)
1️⃣ What is Firearms Manufacturing KPI Dashboard in Excel?
It is a ready-to-use Excel template designed to track production, quality, and financial KPIs.
2️⃣ Can I add new KPIs?
Yes. You can update the KPI Definition sheet to add new KPIs.
3️⃣ How does month selection work?
You select the month from cell D3, and dashboard updates automatically.
4️⃣ What does LTB and UTB mean?
LTB means Lower the Better.
UTB means Upper the Better.
5️⃣ Can I compare performance with previous year?
Yes. The dashboard calculates CY vs PY for both MTD and YTD.
6️⃣ Is this dashboard suitable for small manufacturers?
Yes. Small and large firearms manufacturers can use it.
7️⃣ Do I need advanced Excel skills?
No. Basic Excel knowledge is sufficient to use and update the template.
Click to Purchases Firearms Manufacturing KPI Dashboard in Excel
Visit our YouTube channel to learn step-by-step video tutorials