The fisheries sector depends on accurate tracking, daily monitoring, and fast decision-making. From fish stock levels and catch volumes to operational costs and production efficiency, every detail influences sustainability and profitability. Because fisheries deal with dynamic environments, they require a simple and powerful tool that brings all KPIs into one place. That is where the Fisheries KPI Dashboard in Power BI becomes essential.
In this in-depth article, you will learn everything about this dashboard, including how it works, its core features, advantages, best practices, and common questions. The language is simple, the structure is clear, and every section helps you understand how to use Power BI for fisheries management.
Click to Purchases Fisheries KPI Dashboard in Power BI
What Is a Fisheries KPI Dashboard in Power BI?
A Fisheries KPI Dashboard in Power BI is a ready-to-use reporting solution that tracks major performance indicators across fisheries operations. It shows MTD (Month-to-Date) and YTD (Year-to-Date) performance, compares actual numbers with targets, and highlights current performance against previous year values.
The dashboard connects directly to an Excel file, so you only need to update data in Excel. Power BI manages the visuals, calculations, arrows, and comparisons automatically. Therefore, fisheries teams can focus on improving operations instead of maintaining complex reports.
Why Do Fisheries Need a KPI Dashboard?
The fisheries industry runs on constant monitoring. Every day brings new numbers — catches, feeding cycles, breeding data, water quality readings, equipment performance, and labor details. Without a dashboard, this information stays scattered.
A KPI dashboard helps you:
-
Track production performance
-
Monitor stock efficiency
-
Compare catch numbers
-
Control operational costs
-
Check sustainability compliance
-
Improve resource use
-
Reduce wastage
-
Analyze seasonal variations
Since Power BI updates instantly, you always know what is happening in your fisheries operation.
Key Features of the Fisheries KPI Dashboard in Power BI
The dashboard contains three pages that show complete performance insights. Each section helps you track key metrics from different angles.
Click to Purchases Fisheries KPI Dashboard in Power BI
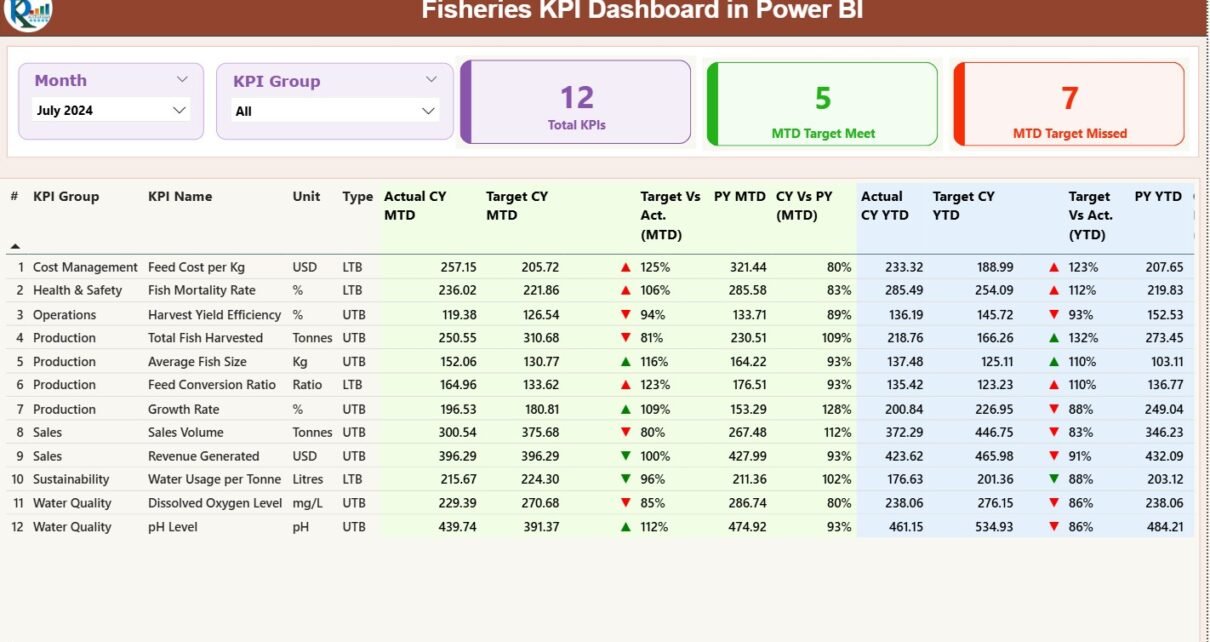
1. Summary Page — The Main Control Center
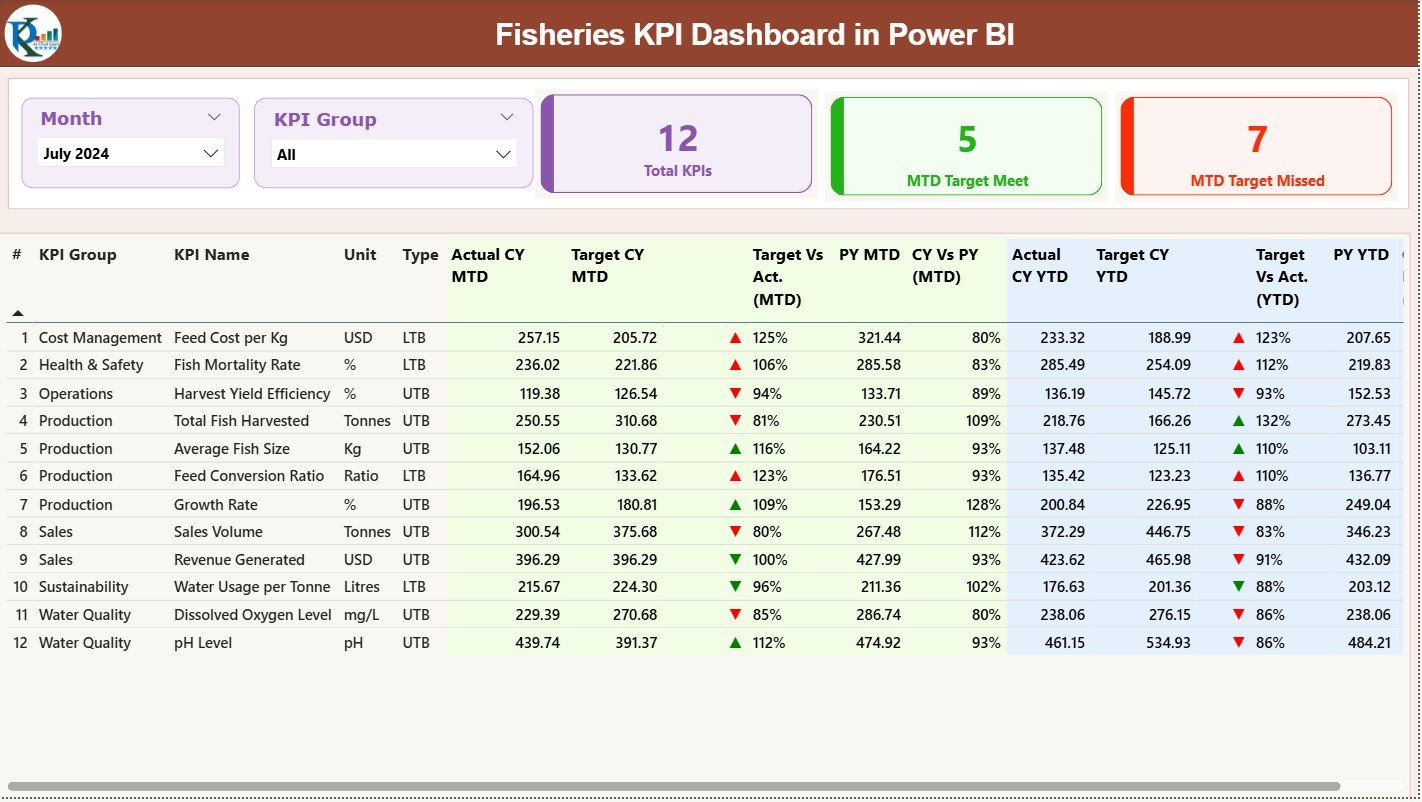
The Summary Page works as the central page of the dashboard. At the top, you get two slicers:
-
Month
-
KPI Group
These slicers help you quickly filter the KPIs you want to review.
The top section includes three important KPI summary cards:
-
Total KPIs Count
-
MTD Target Met Count
-
MTD Target Missed Count
These cards help you understand whether your fisheries operations are running smoothly for the month.
The detailed KPI table includes the fields below:
KPI Number
A simple sequence number for easy identification.
KPI Group
The category of the KPI, such as production, feeding, catch management, breeding, finance, or water quality.
KPI Name
The name of the KPI, such as daily catch volume, growth rate, mortality rate, stock utilization, or feed conversion ratio.
Unit
The measurement unit for the KPI, such as tons, liters, percentage, or numeric value.
Type (LTB or UTB)
-
LTB (Lower the Better) — for KPIs such as mortality rate or production downtime.
-
UTB (Upper the Better) — for KPIs such as total catch or growth rate.
Performance Sections (MTD & YTD)
Actual CY MTD
Current Year Month-to-Date actual value.
Target CY MTD
Current Year MTD target value.
MTD Icon
Arrow indicators that show:
-
▲ Green — Target achieved
-
▼ Red — Target missed
Target vs Actual (MTD)
Percentage = Actual MTD / Target MTD
PY MTD
Previous Year MTD actual number.
CY vs PY (MTD)
Percentage = Current MTD / Previous Year MTD
YTD Performance Section
Actual CY YTD
Current Year YTD actual value.
Target CY YTD
Current Year YTD target value.
YTD Icon
Green or red arrow based on performance.
Target vs Actual (YTD)
Percentage = Actual YTD / Target YTD
PY YTD
Previous Year YTD number.
CY vs PY (YTD)
Percentage = Current YTD / Previous Year YTD
Since fisheries data changes regularly, this page becomes the fastest way to check overall performance.
Click to Purchases Fisheries KPI Dashboard in Power BI
2. KPI Trend Page — Track Seasonal and Monthly Trends
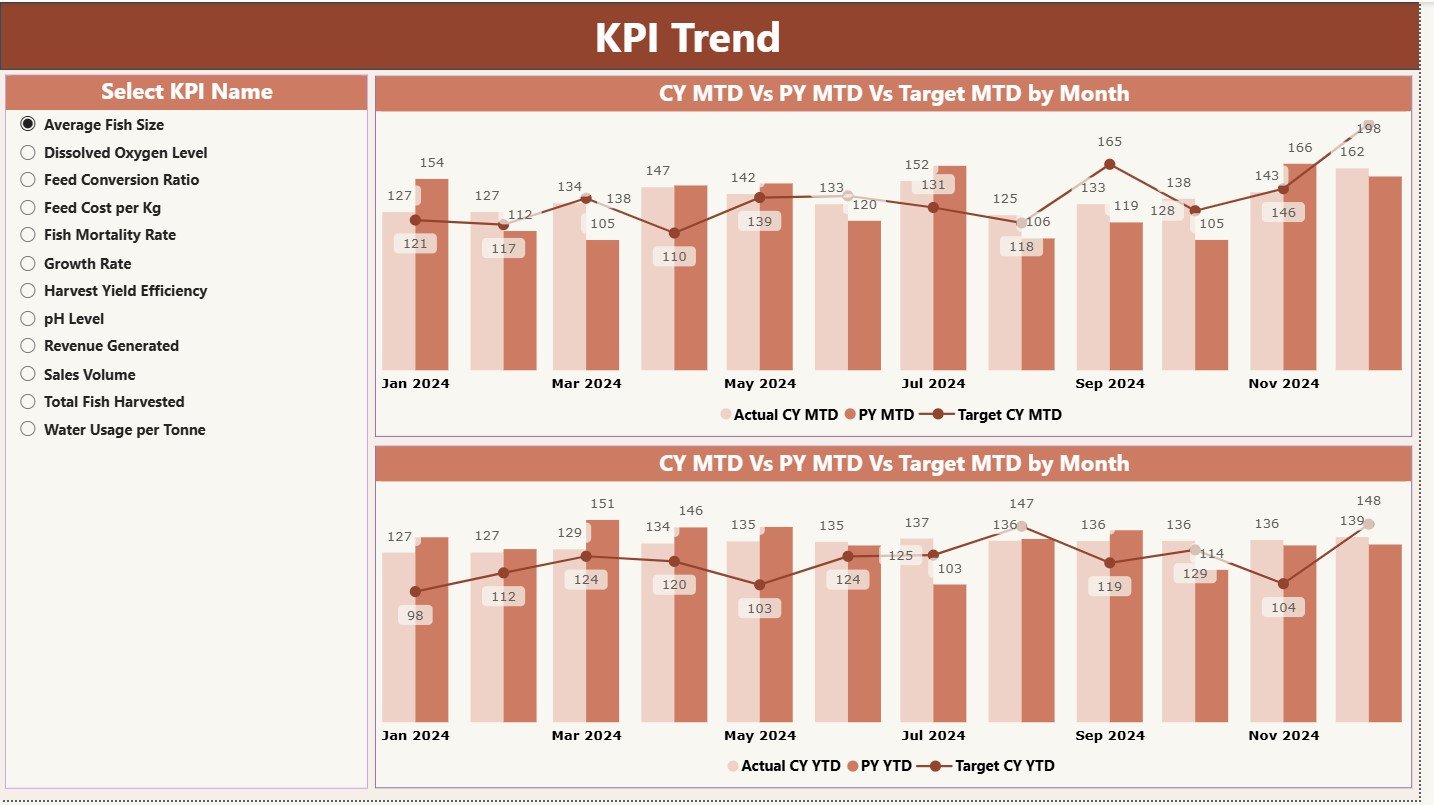
The KPI Trend Page helps you understand changes in performance. It contains two powerful combo charts:
-
MTD Trend Chart
-
YTD Trend Chart
These charts show:
-
Current Year Actuals
-
Previous Year Actuals
-
Target Values
On the left side, you get a slicer to select any KPI name. This helps you analyze catch patterns, feeding performance, growth behavior, or stock utilization trends in a simple way.
This page is especially helpful because fisheries performance depends heavily on climate cycles, water conditions, and seasonal demand.
3. KPI Definition Page — Understand Every KPI Clearly
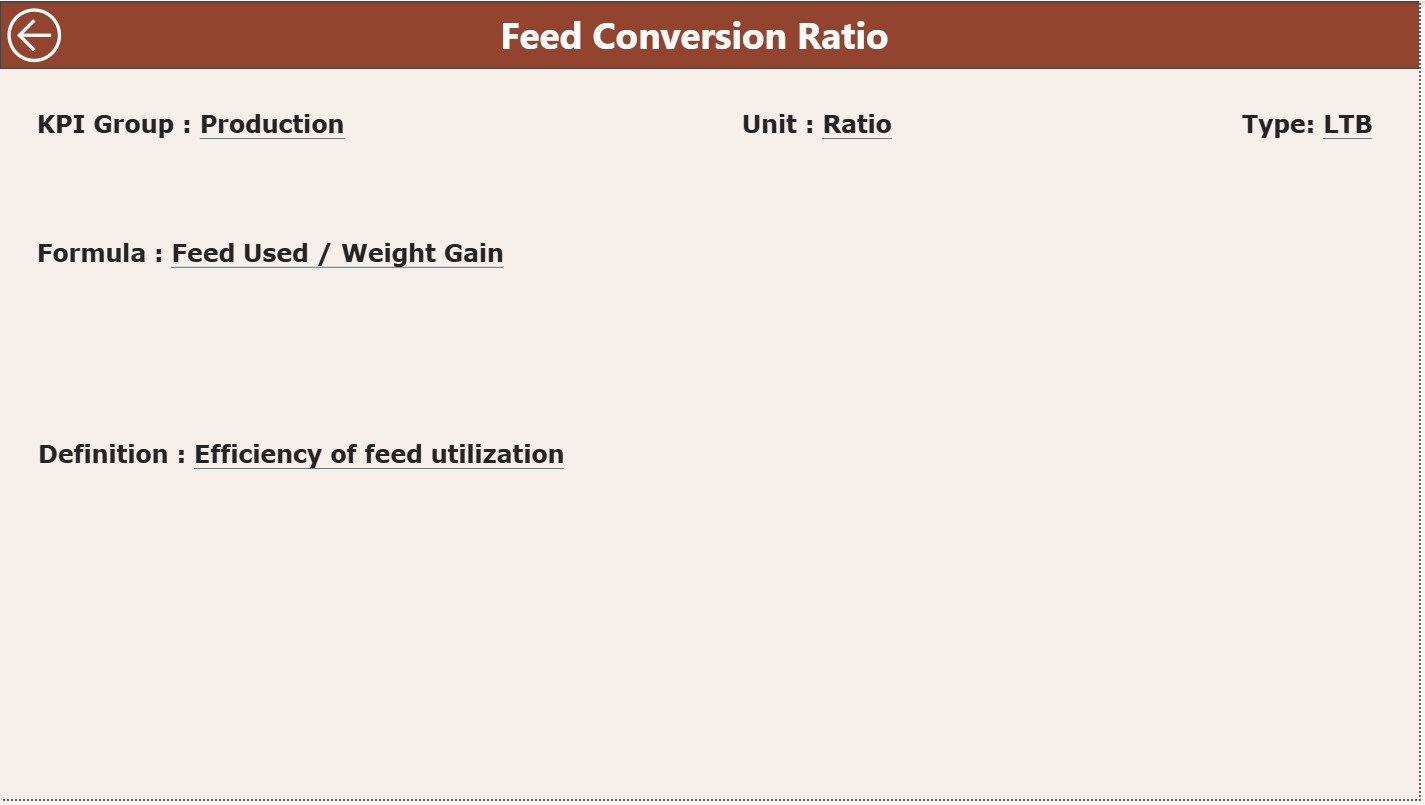
This is a hidden drill-through page that helps you open detailed KPI information when you select a KPI in the Summary Page.
It contains:
-
KPI Number
-
KPI Group
-
KPI Name
-
Unit
-
Formula
-
KPI Definition
-
KPI Type (LTB or UTB)
This page helps new users understand what each KPI means and how it is calculated. You can always go back to the main Summary Page by clicking the Back button on the top-left corner.
How the Excel Data Source Works
The Fisheries KPI Dashboard uses a structured Excel file as the data source. This keeps the dashboard simple, flexible, and easy to update.
The Excel file includes three worksheets:
1. Input_Actual Sheet — Enter Your Actual Numbers
In this sheet, you enter the actual performance values for each KPI. You must fill:
-
KPI Name
-
Month (first day of each month)
-
MTD Actual value
-
YTD Actual value
This sheet supports your monthly and yearly summaries.
2. Input_Target Sheet — Store All Target Values
You must fill:
-
KPI Name
-
Month
-
MTD Target value
-
YTD Target value
Targets help fisheries teams monitor progress and correct performance gaps early.
3. KPI Definition Sheet — Create Clear KPI Standards
This sheet contains:
-
KPI Number
-
KPI Group
-
KPI Name
-
Unit
-
Formula
-
Definition
-
Type (LTB or UTB)
This information helps Power BI show clear visuals and calculate performance indicators.
Click to Purchases Fisheries KPI Dashboard in Power BI
Advantages of a Fisheries KPI Dashboard in Power BI
The dashboard offers several strong benefits for fisheries management.
1. Helps You Make Faster and Better Decisions
Since all metrics appear in one place, you reduce decision delays. You can identify performance gaps instantly.
2. Shows Clear MTD and YTD Performance
This helps you track short-term and long-term results with accuracy. You understand whether your production, feeding, breeding, and catch operations are improving or declining.
3. Improves Resource Planning
Fisheries spend heavily on:
-
Feed
-
Energy
-
Workforce
-
Equipment
-
Transportation
When you monitor KPIs regularly, you use these resources wisely.
4. Supports Sustainability and Compliance
Many fisheries follow strict sustainability guidelines. This dashboard shows performance in real time, so you stay compliant with regulations.
5. Enhances Team Accountability
Clear KPIs help your team stay focused. They see their targets and results immediately.
6. Helps You Compare With Previous Years
Year-over-year trends help teams understand:
-
Seasonal behavior
-
Stock growth cycles
-
Feeding efficiency
-
Market demand
This improves long-term planning.
Common KPIs Used in Fisheries Operations
Below are important KPIs the fisheries industry commonly uses:
-
Daily catch volumes
-
Growth rate
-
Mortality rate
-
Stock utilization rate
-
Feed conversion ratio (FCR)
-
Water quality index
-
Breeding success rate
-
Transportation efficiency
-
Production downtime
-
Labor productivity
-
Yield per cycle
-
Disease occurrence rate
-
Cost per ton
-
Hatch-to-harvest time
You can customize your dashboard by adding your own KPIs as well.
How the Dashboard Improves Fisheries Management
This dashboard supports all critical areas of fisheries operations.
You can:
-
Track production cycles
-
Monitor seasonal changes
-
Optimize feeding schedules
-
Improve growth performance
-
Reduce waste
-
Maintain water quality
-
Improve profitability
-
Compare actual vs target performance
-
Identify reasons behind performance gaps
Because everything is visual, even complex data becomes easy to understand.
Click to Purchases Fisheries KPI Dashboard in Power BI
Best Practices for Using a Fisheries KPI Dashboard in Power BI
Below are the top practices that help you get maximum value from your dashboard.
1. Update the Excel File Often
Update your MTD and YTD numbers every week or every cycle. Fresh data ensures accurate results.
2. Use Clear KPI Definitions
Simple definitions help your team understand how to measure success.
3. Avoid Adding Too Many KPIs
Use KPIs that matter most. A short, focused list works better.
4. Review Seasonal Trends
Use the KPI Trend Page to study monthly and yearly patterns. This helps you understand when performance rises or drops.
5. Train Your Team to Use Slicers
Teach your staff how to use filters, slicers, and drill-through options. This improves adoption.
6. Track LTB and UTB KPIs Separately
This helps you avoid confusion when analyzing performance.
7. Review Performance Weekly
Frequent reviews help you correct issues early.
Conclusion
A Fisheries KPI Dashboard in Power BI helps fisheries teams manage their operations with clarity and speed. The dashboard brings together all important KPIs, including MTD, YTD, target values, previous-year comparisons, and performance indicators. With its combo charts, slicers, and trend visuals, it becomes the perfect tool for tracking production, feeding, breeding, water quality, and financial performance.
Since it uses an Excel data source, updating the dashboard is easy and quick. When you follow best practices and review your KPIs regularly, you improve efficiency, reduce losses, and make better decisions for your fisheries.
Click to Purchases Fisheries KPI Dashboard in Power BI
Frequently Asked Questions (FAQs)
1. What is a Fisheries KPI Dashboard in Power BI?
It is a visual dashboard that tracks fisheries KPIs such as catch volume, growth rate, feeding performance, and stock utilization.
2. Do I need technical knowledge to use this dashboard?
No. You only need to update numbers in the Excel file. Power BI handles the visuals automatically.
3. Can I add more KPIs to the dashboard?
Yes. You can add new KPIs to the KPI Definition sheet and refresh the dashboard.
4. How often should I update the actual data?
You can update it weekly, monthly, or after each production cycle.
5. Does the dashboard support previous-year comparisons?
Yes. It shows MTD and YTD comparisons with previous year values.
6. Can I customize the visuals?
Yes. Power BI allows full customization of visuals, colors, and layouts.
7. Does the dashboard help with sustainability tracking?
Yes. You can add sustainability KPIs and monitor compliance easily.
Click to Purchases Fisheries KPI Dashboard in Power BI
Visit our YouTube channel to learn step-by-step video tutorials