In today’s fast-paced world, fitness and wellness organizations must rely on data, not guesswork. Gyms, wellness centers, corporate fitness programs, and personal trainers constantly track attendance, workout hours, satisfaction levels, and revenue. However, when this data sits in scattered Excel files or manual reports, teams lose visibility and control.
That is exactly why a Fitness and Wellness Dashboard in Power BI becomes a powerful and practical solution.
In this detailed and SEO-friendly guide, you will learn what a Fitness and Wellness Dashboard in Power BI is, why it matters, how it works, its complete page-wise structure, advantages, best practices, challenges, and frequently asked questions. Moreover, this article uses clear language, smooth transitions, and real-world explanations so you can apply the concepts immediately.
Click to Purchases Fitness and Wellness Dashboard in Power BI
What Is a Fitness and Wellness Dashboard in Power BI?
A Fitness and Wellness Dashboard in Power BI is an interactive and visual reporting solution that helps fitness professionals track performance, engagement, and revenue in one centralized report.
Instead of reviewing multiple spreadsheets, static charts, or manual summaries, this dashboard consolidates all fitness-related data into a single Power BI file. As a result, managers and trainers gain instant insights into attendance, workout behavior, member satisfaction, and financial trends.
More importantly, this dashboard allows users to slice and filter data dynamically using slicers. Therefore, decision-makers can analyze performance by program type, trainer, gender, location, and month without any technical complexity.
Why Do Fitness and Wellness Businesses Need a Power BI Dashboard?
Fitness and wellness operations involve many moving parts. Members attend sessions at different locations, trainers conduct varied programs, and management tracks revenue and satisfaction. Without a structured dashboard, these insights remain hidden.
A Fitness and Wellness Dashboard in Power BI solves these challenges effectively.
Key Reasons to Use This Dashboard
-
First, it provides real-time performance visibility
-
Second, it helps identify high-performing programs and trainers
-
Third, it tracks member engagement and satisfaction
-
Fourth, it supports data-driven pricing and membership decisions
-
Finally, it saves time by eliminating manual reporting
Because of these benefits, fitness organizations can shift from reactive decisions to proactive planning.
How Does a Fitness and Wellness Dashboard in Power BI Work?
The dashboard works by connecting structured fitness data to Microsoft Power BI, which then transforms raw numbers into interactive visuals.
Step-by-Step Working Process
-
Data Collection
First, the organization captures data such as attendance, workout hours, membership fees, satisfaction scores, trainer details, and locations. -
Data Modeling
Next, Power BI organizes the data into relationships and measures. This step ensures accurate calculations for averages, percentages, and trends. -
Visualization Design
Then, charts, cards, and slicers display the data visually. As a result, users understand performance at a glance. -
Interactive Analysis
Finally, users filter data using slicers to explore insights by month, trainer, program, or location.
Because of this structured flow, even non-technical users can analyze fitness data with confidence.
What Are the Key Pages in a Fitness and Wellness Dashboard in Power BI?
This dashboard includes five well-designed pages, each focused on a specific analytical objective. Together, they provide a complete 360-degree view of fitness and wellness performance.
1. Overview Page: How Do You Get Instant Performance Insights?
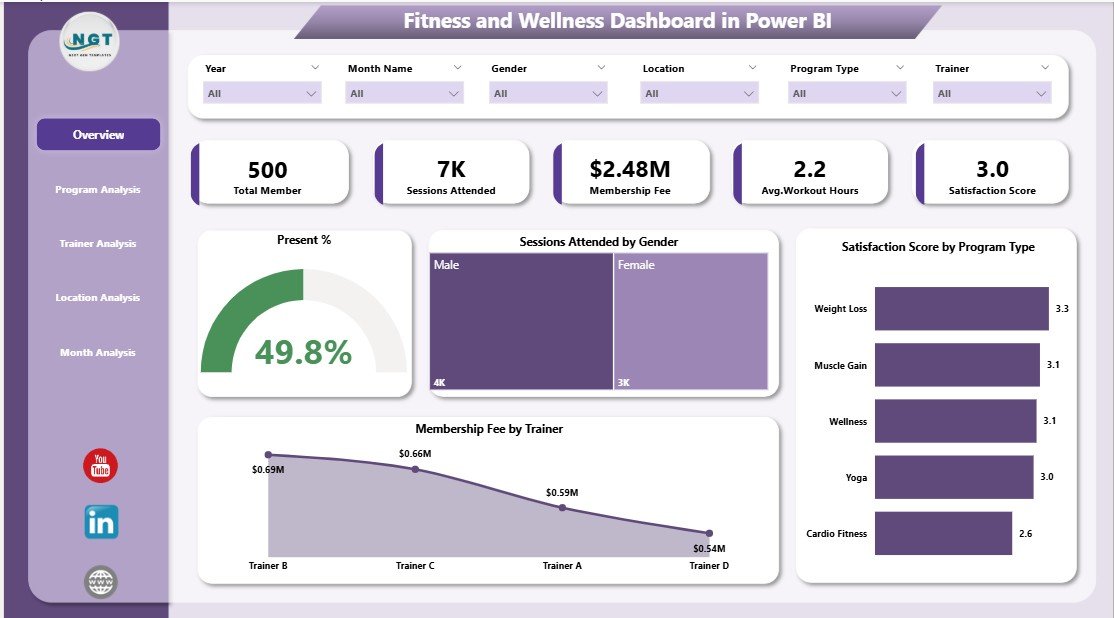
The Overview Page acts as the main landing page of the dashboard. It delivers high-level insights quickly, which helps decision-makers understand overall performance without scrolling through detailed reports.
Key Elements on the Overview Page
-
Slicers (Filters)
Users can filter data by time period, program, trainer, or location. Therefore, analysis becomes flexible and fast. -
Key Performance Cards
-
Present %: Shows attendance percentage
-
Session Attended by Gender: Highlights gender participation patterns
-
Satisfaction Score by Program Type: Reveals program quality perception
-
Membership Fee by Trainer: Shows revenue contribution by trainer
-
Because everything appears in one place, this page supports quick daily or weekly reviews.
2. Program Analysis Page: Which Programs Perform Best?
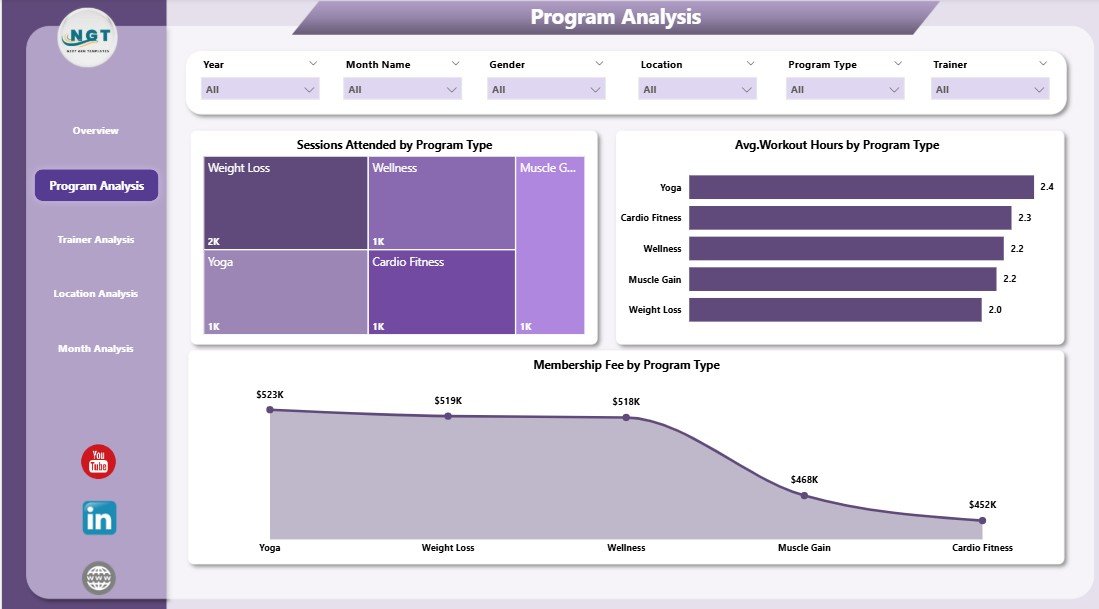
The Program Analysis Page focuses on evaluating different fitness and wellness programs. Since not all programs perform equally, this page helps organizations invest in the right offerings.
Key Charts on the Program Analysis Page
-
Sessions Attendance by Program Type
This chart shows which programs attract the most participation. -
Average Workout Hours by Program Type
This visual highlights member engagement depth across programs. -
Membership Fee by Program Type
This chart helps compare revenue generated by each program.
As a result, managers can promote high-impact programs and redesign underperforming ones.
3. Trainer Analysis Page: How Do Trainers Impact Performance?
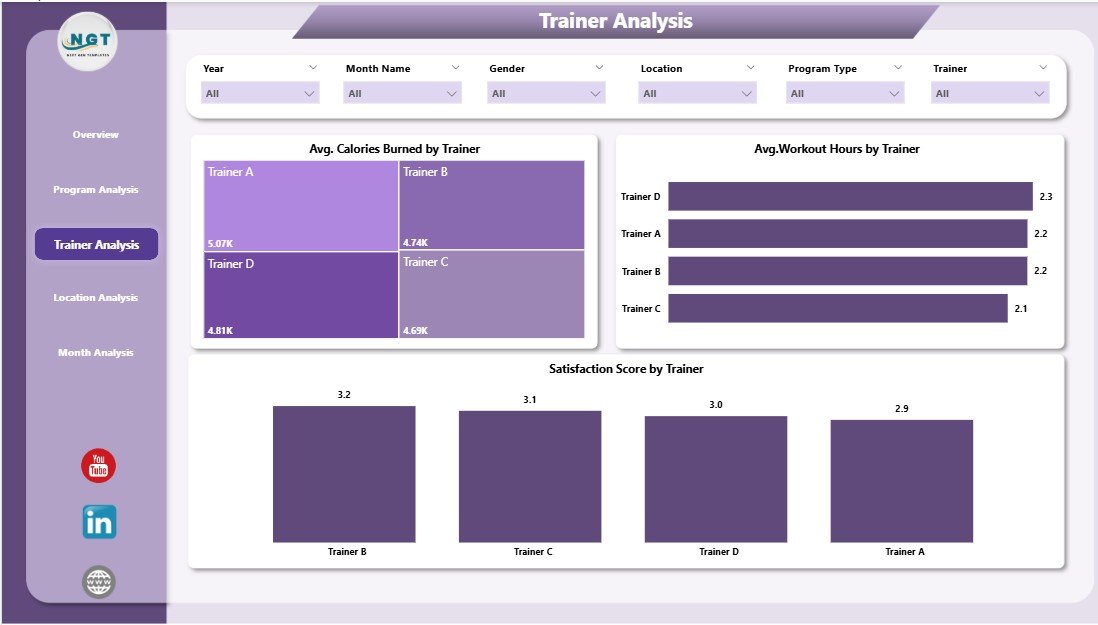
Trainers play a vital role in fitness success. Therefore, the Trainer Analysis Page evaluates trainer-wise performance using objective data.
Key Charts on the Trainer Analysis Page
-
Average Calories Burned by Trainer
This chart reflects workout intensity and effectiveness. -
Average Workout Hours by Trainer
This metric shows member engagement with each trainer. -
Satisfaction Score by Trainer
This visual reveals how members rate trainer quality.
With these insights, organizations can reward top trainers, plan training sessions, and improve service quality.
4. Location Analysis Page: Which Locations Drive Success?

Fitness businesses often operate across multiple locations. The Location Analysis Page helps compare performance across branches.
Key Charts on the Location Analysis Page
-
Sessions Attended by Location
This chart identifies high-traffic and low-traffic locations. -
Membership Fee by Location
This visual shows revenue contribution by branch. -
Satisfaction Score by Location
This metric highlights service quality differences.
Because of this page, management can allocate resources wisely and improve underperforming locations.
Click to Purchases Fitness and Wellness Dashboard in Power BI
5. Monthly Trends Page: How Does Performance Change Over Time?

The Monthly Trends Page focuses on time-based analysis. It helps organizations understand seasonality, growth patterns, and long-term behavior.
Key Charts on the Monthly Trends Page
-
Sessions Attended by Month
This chart shows attendance trends over time. -
Membership Fee by Month
This visual tracks revenue growth or decline. -
Average Workout Hours by Month
This metric highlights engagement trends.
As a result, businesses can plan promotions, staffing, and capacity more effectively.
Advantages of Fitness and Wellness Dashboard in Power BI
A Fitness and Wellness Dashboard in Power BI delivers value across operational, strategic, and financial dimensions.
Key Advantages
-
📊 Centralized Reporting
All fitness data stays in one interactive dashboard. -
⚡ Faster Decision-Making
Managers get instant insights without waiting for reports. -
🎯 Improved Member Engagement
Data highlights what keeps members active and satisfied. -
💰 Revenue Optimization
Pricing and membership decisions rely on real data. -
👥 Trainer Performance Transparency
Objective metrics replace assumptions. -
📈 Trend-Based Planning
Monthly trends support long-term strategy.
Because of these advantages, fitness organizations gain clarity, control, and confidence.
Best Practices for the Fitness and Wellness Dashboard in Power BI
To maximize the dashboard’s impact, organizations must follow proven best practices.
Recommended Best Practices
-
Use Clean and Structured Data
Always validate attendance, fee, and satisfaction data. -
Limit Visual Clutter
Focus on meaningful charts instead of overcrowding pages. -
Use Consistent Metrics
Define workout hours, attendance, and satisfaction clearly. -
Update Data Regularly
Keep dashboards fresh with weekly or monthly updates. -
Train Users on Slicers
Ensure teams know how to filter and explore data. -
Review Dashboard Monthly
Use insights during performance and strategy meetings.
When teams follow these practices, the dashboard becomes a decision-making tool, not just a report.
What Challenges Can Occur While Using This Dashboard?
Although powerful, the dashboard may face some challenges. However, with the right approach, teams can overcome them.
Common Challenges and Solutions
-
Inconsistent Data Entry
→ Use standardized data templates. -
Overloading with KPIs
→ Focus on core fitness and revenue metrics. -
Low User Adoption
→ Provide short training sessions and documentation. -
Outdated Insights
→ Schedule regular data refresh cycles.
Because challenges remain manageable, the long-term benefits far outweigh the initial effort.
Who Can Benefit from a Fitness and Wellness Dashboard in Power BI?
Click to Purchases Fitness and Wellness Dashboard in Power BI
This dashboard serves a wide range of users across the fitness ecosystem.
Ideal Users
-
Gym owners and managers
-
Wellness center administrators
-
Fitness program coordinators
-
Personal trainers and coaches
-
Corporate wellness teams
-
Fitness analysts and consultants
Since the dashboard adapts easily, both small gyms and large fitness chains can use it effectively.
Conclusion: Why Should You Use a Fitness and Wellness Dashboard in Power BI?
A Fitness and Wellness Dashboard in Power BI transforms raw fitness data into meaningful insights. Instead of guessing what works, organizations can rely on clear visuals, trends, and comparisons.
Because the dashboard includes overview insights, program analysis, trainer performance, location comparison, and monthly trends, it delivers a complete performance picture. Moreover, it saves time, improves accountability, and drives smarter decisions.
In short, if you want to improve member engagement, optimize revenue, and scale your fitness operations, this dashboard becomes an essential tool.
Frequently Asked Questions (FAQs)
1. What data do I need for a Fitness and Wellness Dashboard in Power BI?
You need attendance records, workout hours, satisfaction scores, trainer details, program types, locations, and membership fees.
2. Can beginners use this dashboard easily?
Yes. Because of slicers and clear visuals, even non-technical users can explore insights easily.
3. How often should I update the dashboard?
You should update it weekly or monthly, depending on data availability and reporting needs.
4. Can I customize the dashboard for my fitness business?
Absolutely. You can add or remove KPIs, pages, and visuals based on your goals.
5. Does this dashboard support multiple locations?
Yes. The Location Analysis page specifically supports multi-branch comparisons.
6. Can trainers access their own performance insights?
Yes. You can filter data by trainer to review individual performance.
7. Is Power BI suitable for large fitness organizations?
Yes. Power BI handles large datasets efficiently and scales well with business growth.
Visit our YouTube channel to learn step-by-step video tutorials