The Flooring and Tiles KPI Dashboard changes fast. Customer taste shifts quickly. Moreover, builders demand faster delivery. At the same time, raw material costs move up and down. Therefore, flooring manufacturers, tile distributors, and retail showrooms must track performance carefully.
However, many businesses still rely on scattered spreadsheets. As a result, they miss trends. They fail to track sales performance properly. They also struggle to compare targets with actual results. Consequently, they lose profit opportunities.
So, how can you monitor sales growth, production efficiency, inventory turnover, profit margins, and performance trends in one structured system?
The answer is simple.
Click to Purchases Flooring and Tiles KPI Dashboard in Power BI
You need a Flooring and Tiles KPI Dashboard in Power BI.
In this detailed guide, you will learn:
-
What a Flooring and Tiles KPI Dashboard in Power BI is
-
Why your flooring and tiles business needs it
-
Detailed explanation of all dashboard pages
-
How Excel works as the data source
-
Important KPIs for flooring and tile management
-
Advantages of Flooring and Tiles KPI Dashboard in Power BI
-
Best Practices for the Flooring and Tiles KPI Dashboard
-
Frequently Asked Questions with Answers
Let’s explore everything step by step.
What Is a Flooring and Tiles KPI Dashboard in Power BI?
A Flooring and Tiles KPI Dashboard in Power BI is a ready-to-use performance tracking system designed specifically for flooring manufacturers, tile traders, distributors, and retail stores.
It helps you:
-
Track Monthly (MTD) performance
-
Monitor Year-to-Date (YTD) performance
-
Compare Actual vs Target values
-
Compare Current Year vs Previous Year
-
Identify underperforming KPIs instantly
-
Make faster and smarter decisions
Moreover, it connects with an Excel data file. Therefore, you can easily update your numbers without changing the dashboard structure.
Why Does the Flooring and Tiles Industry Need a KPI Dashboard?
The flooring and tiles industry works in a competitive environment. Builders demand bulk orders. Retail customers look for design trends. Additionally, project timelines remain tight. Therefore, businesses must monitor every key metric.
Without a dashboard:
-
Managers guess performance
-
Teams miss target gaps
-
Sales teams lack direction
-
Inventory issues increase
However, with a Power BI KPI dashboard:
-
You see performance instantly
-
You track target achievement
-
You detect weak areas quickly
-
You improve profitability
As a result, your business grows with clarity and control.
Key Features of Flooring and Tiles KPI Dashboard in Power BI
This dashboard includes 3 interactive pages in the Power BI Desktop file. Each page serves a specific purpose.
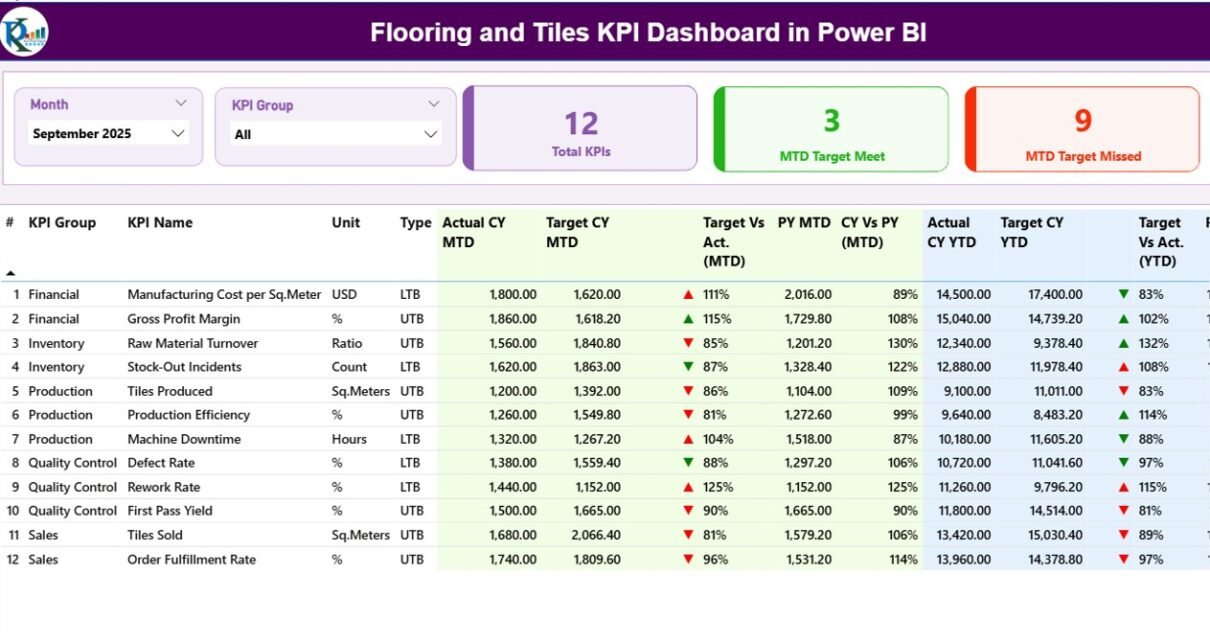
1️⃣ Summary Page – The Main Control Panel
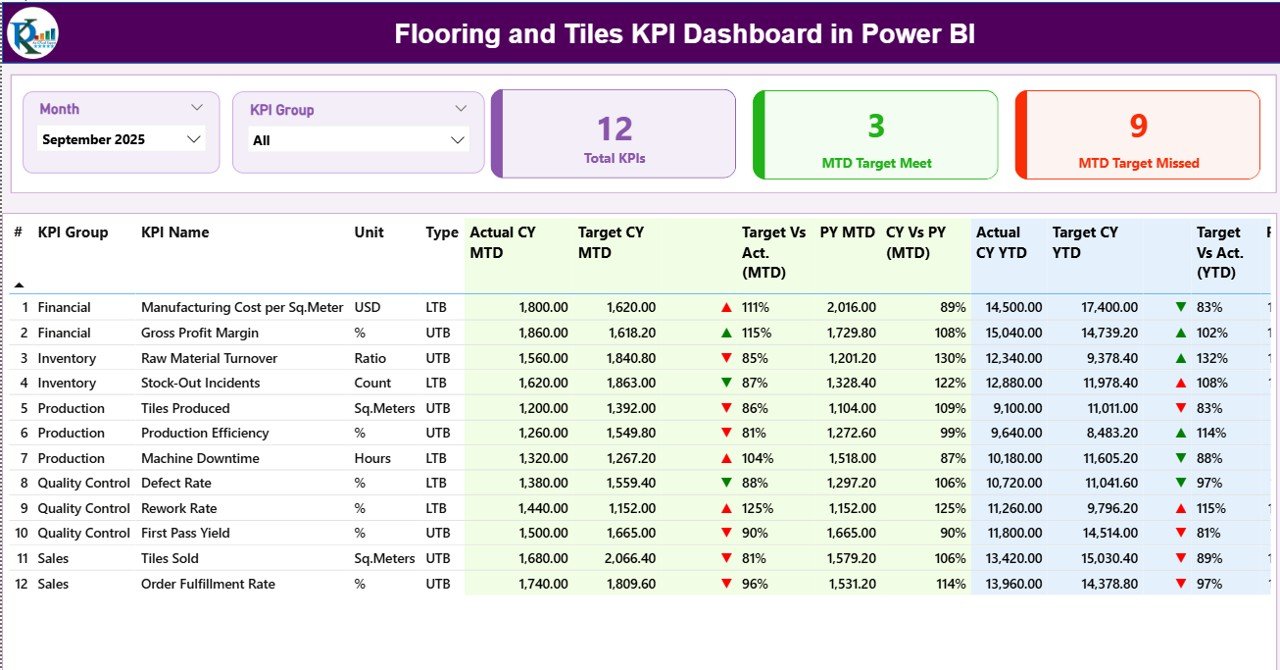
The Summary Page works as the heart of the dashboard.
What Do You See on the Top?
On the top section, you get:
-
Month Slicer – Select any month to update the entire dashboard
-
KPI Group Slicer – Filter KPIs by category
Therefore, you can instantly focus on Sales, Production, Finance, or Inventory KPIs.
KPI Performance Cards
You also see three powerful cards:
-
Total KPIs Count
-
MTD Target Meet Count
-
MTD Target Missed Count
These cards provide instant insight. As a result, management understands performance within seconds.
Detailed KPI Table Explained
Below the cards, you see a structured KPI table with complete performance data.
Let’s understand each column clearly.
🔹 KPI Number
Sequence number of KPI for easy reference.
🔹 KPI Group
Category of KPI such as:
-
Sales
-
Production
-
Finance
-
Inventory
-
Quality
🔹 KPI Name
Name of the performance indicator.
🔹 Unit
Measurement unit like:
-
Percentage
-
Number
-
Amount
-
Days
-
Tons
-
Square Feet
🔹 Type
Type defines performance direction:
-
UTB (Upper the Better)
-
LTB (Lower the Better)
This classification helps interpret icons correctly.
Click to Purchases Flooring and Tiles KPI Dashboard in Power BI
MTD (Month-To-Date) Performance Section
Actual CY MTD
Current Year Actual MTD value.
Target CY MTD
Current Year Target MTD value.
MTD Icon
Green ▲ indicates target met.
Red ▼ indicates target missed.
Therefore, managers identify performance instantly without calculations.
Target Vs Act. (MTD)
Formula used:
This percentage shows achievement level clearly.
PY MTD
Previous Year MTD value for the same month.
CY Vs PY (MTD)
Formula used:
This helps measure growth or decline.
YTD (Year-To-Date) Performance Section
Actual CY YTD
Current Year cumulative value.
Target CY YTD
Target cumulative value.
YTD Icon
Green ▲ or Red ▼ indicates performance status.
Target Vs Act. (YTD)
Formula:
PY YTD
Previous Year YTD number.
CY Vs PY (YTD)
Formula:
Therefore, you see both short-term and long-term performance clearly.
Click to Purchases Flooring and Tiles KPI Dashboard in Power BI
2️⃣ KPI Trend Page – Visual Growth Analysis
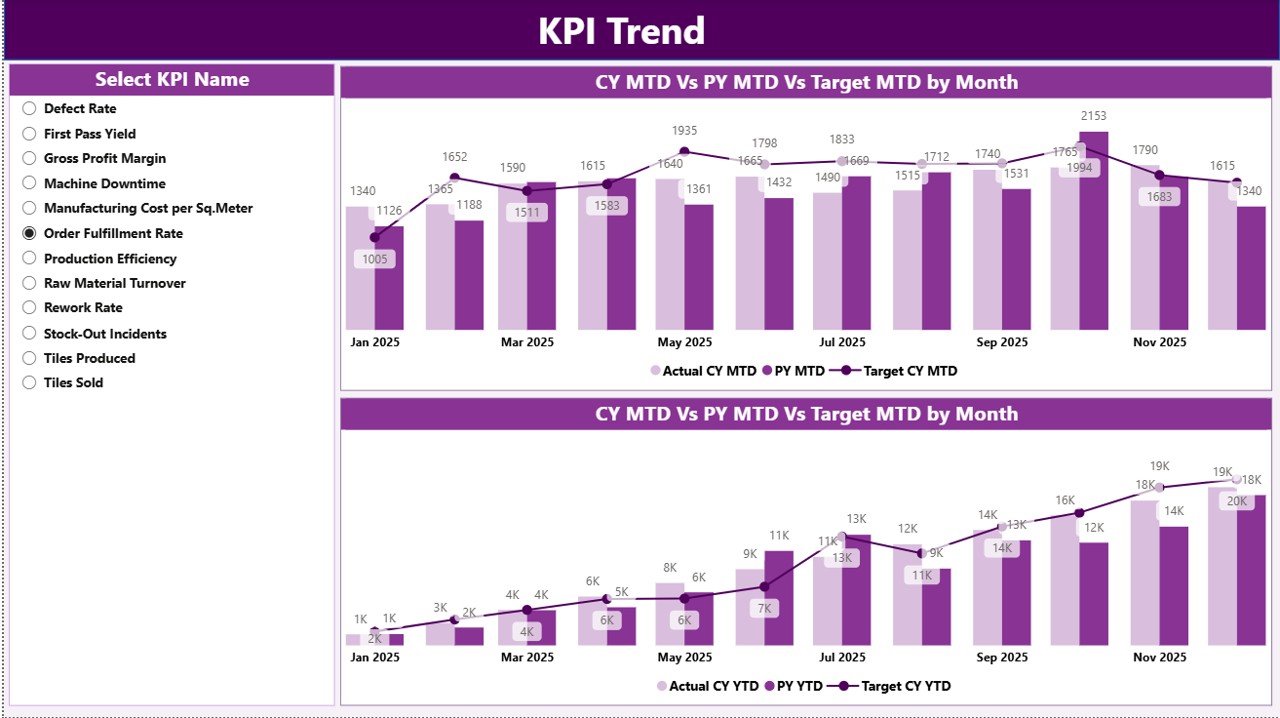
This page focuses on performance trends.
What Does It Show?
It displays 2 combo charts:
-
MTD Trend Chart
-
YTD Trend Chart
Each chart shows:
-
Current Year Actual
-
Previous Year Actual
-
Target Values
Additionally, you can use the KPI Name slicer on the left.
Therefore, you can:
-
Analyze monthly growth
-
Compare targets visually
-
Identify seasonal trends
-
Detect performance gaps
For example, if tile sales drop during the monsoon season, the trend chart highlights it immediately.
3️⃣ KPI Definition Page – Detailed KPI Information
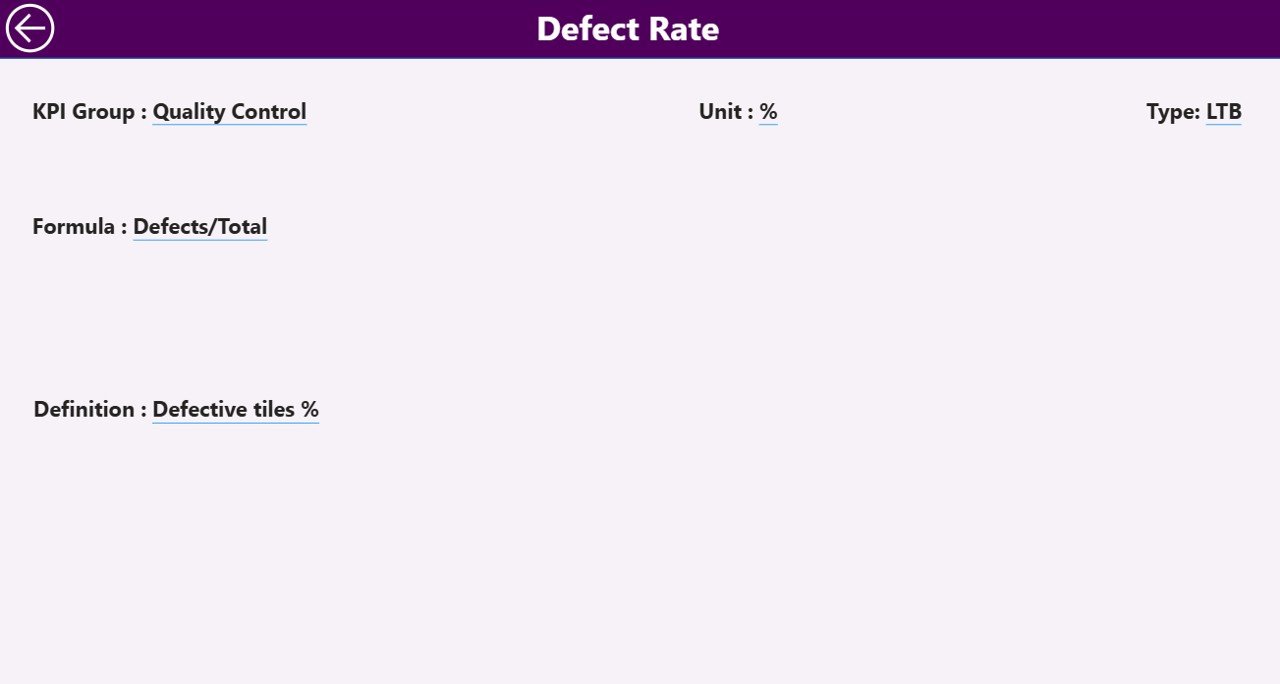
This page works as a drill-through page.
From the Summary Page, you can:
-
Right-click on a KPI
-
Select Drill Through
-
View KPI Formula and Definition
This page includes:
-
KPI Number
-
KPI Group
-
KPI Name
-
Unit
-
Formula
-
Definition
-
Type
Moreover, the page remains hidden to maintain dashboard cleanliness.
To return, simply click the back button on the top left corner.
Excel Data Source Structure
This dashboard uses Excel as the data source. Therefore, updating numbers becomes simple and flexible.
You must maintain three worksheets in Excel.
1️⃣ Input_Actual Sheet
Here you enter:
-
KPI Name
-
Month (use first date of month like 01-Jan-2024)
-
MTD Value
-
YTD Value
Important:
-
Do not change KPI names
-
Keep month format consistent
-
Update data regularly
2️⃣ Input_Target Sheet
Here you enter:
-
KPI Name
-
Month (first date of month)
-
MTD Target
-
YTD Target
Because targets drive performance tracking, accuracy matters.
3️⃣ KPI Definition Sheet
Click to Purchases Flooring and Tiles KPI Dashboard in Power BI
This sheet contains:
-
KPI Number
-
KPI Group
-
KPI Name
-
Unit
-
Formula
-
Definition
-
Type (LTB or UTB)
This sheet controls KPI structure inside Power BI.
Important KPIs for Flooring and Tiles Industry
Below are some useful KPIs:
Sales KPIs
-
Monthly Sales Revenue
-
Average Order Value
-
Sales Growth %
-
Dealer Performance %
Production KPIs
-
Production Volume
-
Machine Utilization %
-
Rejection Rate %
-
On-Time Production %
Inventory KPIs
-
Inventory Turnover Ratio
-
Stock Aging Days
-
Damaged Tiles %
Finance KPIs
-
Gross Profit Margin %
-
Operating Cost %
-
Net Profit %
Customer KPIs
-
Customer Satisfaction Score
-
Complaint Resolution Time
Therefore, you can customize KPIs based on your business model.
Advantages of Flooring and Tiles KPI Dashboard in Power BI
This dashboard offers multiple benefits.
✔ Real-Time Decision Making
You see performance instantly. Therefore, you act faster.
✔ Clear Target Tracking
You compare actual vs target clearly. As a result, teams stay focused.
✔ Visual Performance Indicators
Green and red icons simplify performance understanding.
✔ Centralized Data Control
Excel serves as a single source of truth.
✔ Easy Filtering
Slicers allow month and group analysis quickly.
✔ Trend Analysis
Combo charts show historical comparison.
✔ Drill-Through Capability
You access detailed KPI formulas easily.
Best Practices for the Flooring and Tiles KPI Dashboard
Click to Purchases Flooring and Tiles KPI Dashboard in Power BI
To maximize results, follow these best practices:
1️⃣ Update Excel Data Monthly
Always update Actual and Target sheets before reviewing dashboard.
2️⃣ Use Consistent KPI Names
Do not change spelling. Otherwise, Power BI fails to match data.
3️⃣ Define KPI Type Correctly
Mark UTB and LTB properly. Icons depend on this classification.
4️⃣ Review Trends Regularly
Analyze trend page weekly or monthly.
5️⃣ Focus on Missed KPIs
Investigate red ▼ KPIs immediately.
6️⃣ Set Realistic Targets
Avoid unrealistic goals. Instead, use data-driven targets.
7️⃣ Train Your Team
Explain KPI meanings clearly to managers and sales teams.
How Does This Dashboard Improve Business Performance?
When you use this dashboard consistently:
-
You reduce guesswork
-
You improve accountability
-
You increase profitability
-
You control inventory better
-
You improve production planning
Therefore, your flooring and tiles business becomes more structured and data-driven.
Who Can Use This Flooring and Tiles KPI Dashboard?
This dashboard suits:
-
Tile Manufacturers
-
Flooring Exporters
-
Ceramic Tile Dealers
-
Construction Material Distributors
-
Retail Tile Showrooms
-
Project Sales Teams
Whether you manage a small showroom or a large manufacturing plant, this dashboard fits your needs.
Conclusion
The flooring and tiles industry demands precision, speed, and data-driven control. Therefore, businesses cannot rely on manual spreadsheets anymore.
The Flooring and Tiles KPI Dashboard in Power BI provides:
-
Clear MTD and YTD tracking
-
Target vs Actual comparison
-
Previous Year comparison
-
Visual performance icons
-
Interactive slicers
-
Drill-through KPI definitions
Moreover, Excel integration keeps data management simple. As a result, you gain complete performance visibility.
If you want structured growth, improved decision-making, and higher profitability, then this dashboard offers the perfect solution.
Frequently Asked Questions with Answers
1️⃣ What makes this dashboard different from regular Excel reports?
This dashboard provides interactive visuals, slicers, icons, and drill-through functionality. Moreover, Power BI updates visuals automatically.
2️⃣ Can I customize KPIs?
Yes. You can modify the KPI Definition sheet in Excel and refresh Power BI.
3️⃣ Do I need advanced Power BI skills to use it?
No. You only update Excel sheets. The dashboard updates automatically.
4️⃣ Can I track both MTD and YTD performance?
Yes. The dashboard shows both MTD and YTD comparisons clearly.
5️⃣ How often should I update data?
You should update monthly. However, you can update weekly if needed.
6️⃣ What does LTB and UTB mean?
LTB means Lower the Better.
UTB means Upper the Better.
7️⃣ Can I use this for multiple branches?
Yes. You can add branch filters if required.
Visit our YouTube channel to learn step-by-step video tutorials