The floriculture industry grows fast. Demand changes with seasons. Festivals increase sales suddenly. Weddings boost premium flower demand. Export orders fluctuate every month. Therefore, floriculture businesses must track revenue, cost, profit, farm performance, region trends, and flower category sales in real time.
However, many flower farms and distributors still depend on scattered Excel files and manual reports. As a result, managers fail to spot low-margin flower types. They miss seasonal demand patterns. They struggle to compare farm performance. Consequently, they lose revenue opportunities.
So, how can you monitor Profit Margin %, Total Revenue, Target Sales, Flower Type performance, Farm Name contribution, Region-wise results, and Month-wise trends in one interactive system?
Click to Purchases Floriculture Dashboard in Power BI
The answer is simple.
You need a Floriculture Dashboard in Power BI.
In this detailed guide, you will learn:
-
What a Floriculture Dashboard in Power BI is
-
Why floriculture businesses need it
-
Detailed explanation of all 5 dashboard pages
-
Key KPIs included in the dashboard
-
Advantages of Floriculture Dashboard in Power BI
-
Best Practices for the Floriculture Dashboard
-
Frequently Asked Questions with Answers
Let us explore everything step by step.
What Is a Floriculture Dashboard in Power BI?
A Floriculture Dashboard in Power BI is a ready-to-use business intelligence solution designed specifically for:
-
Flower farms
-
Flower exporters
-
Wholesale flower distributors
-
Floral retailers
-
Greenhouse operators
It captures sales data, target data, cost information, and regional performance data. Then it transforms that raw data into clear visuals and KPI cards.
Instead of checking multiple sheets, you get:
-
Real-time insights
-
Interactive slicers
-
Visual comparisons
-
Profitability analysis
-
Target vs actual tracking
As a result, you make faster and smarter business decisions.
Why Do Floriculture Businesses Need a Dashboard?
The flower business depends heavily on:
-
Seasonality
-
Climate conditions
-
Export demand
-
Local events
-
Perishability
Therefore, decision-makers must monitor performance continuously.
Without a dashboard:
-
Managers rely on manual reports
-
Teams miss underperforming flower types
-
Regional performance remains unclear
-
Target tracking becomes inconsistent
However, with a structured Power BI dashboard:
-
You see trends instantly
-
You compare regions easily
-
You identify profitable flower types
-
You improve sales strategy quickly
Consequently, your revenue improves and waste reduces.
Detailed Explanation of All 5 Pages of the Floriculture Dashboard in Power BI
This Floriculture Dashboard in Power BI contains 5 powerful analytical pages. Each page focuses on a specific business area.
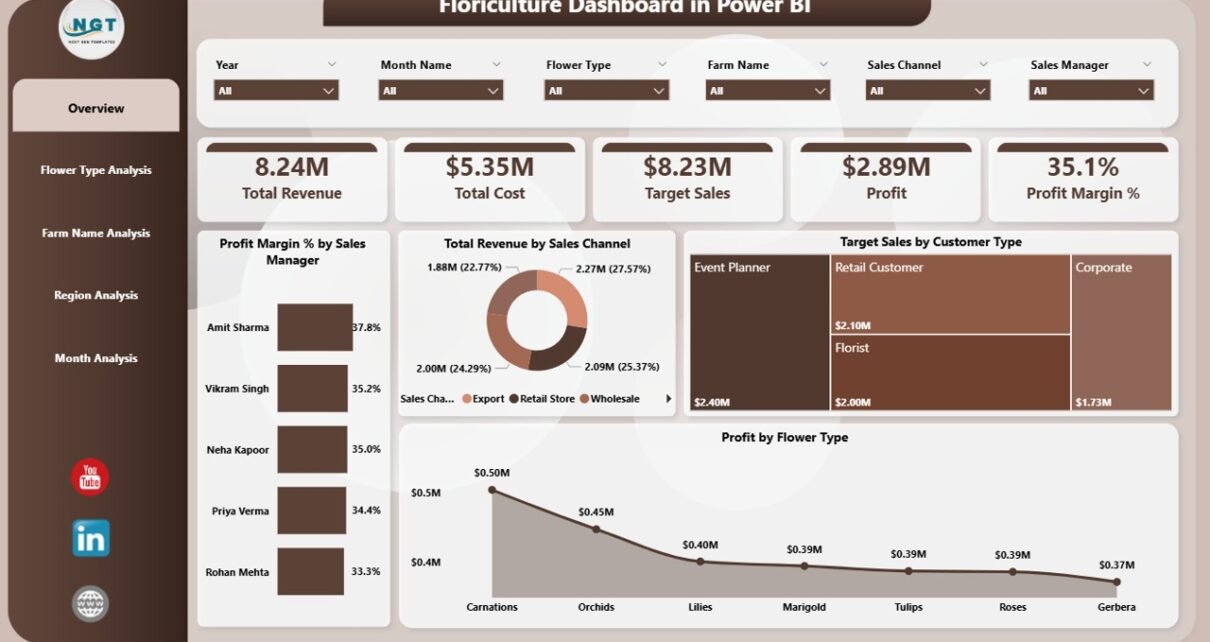
1️⃣ Overview Page – How Does Your Floriculture Business Perform at a Glance?
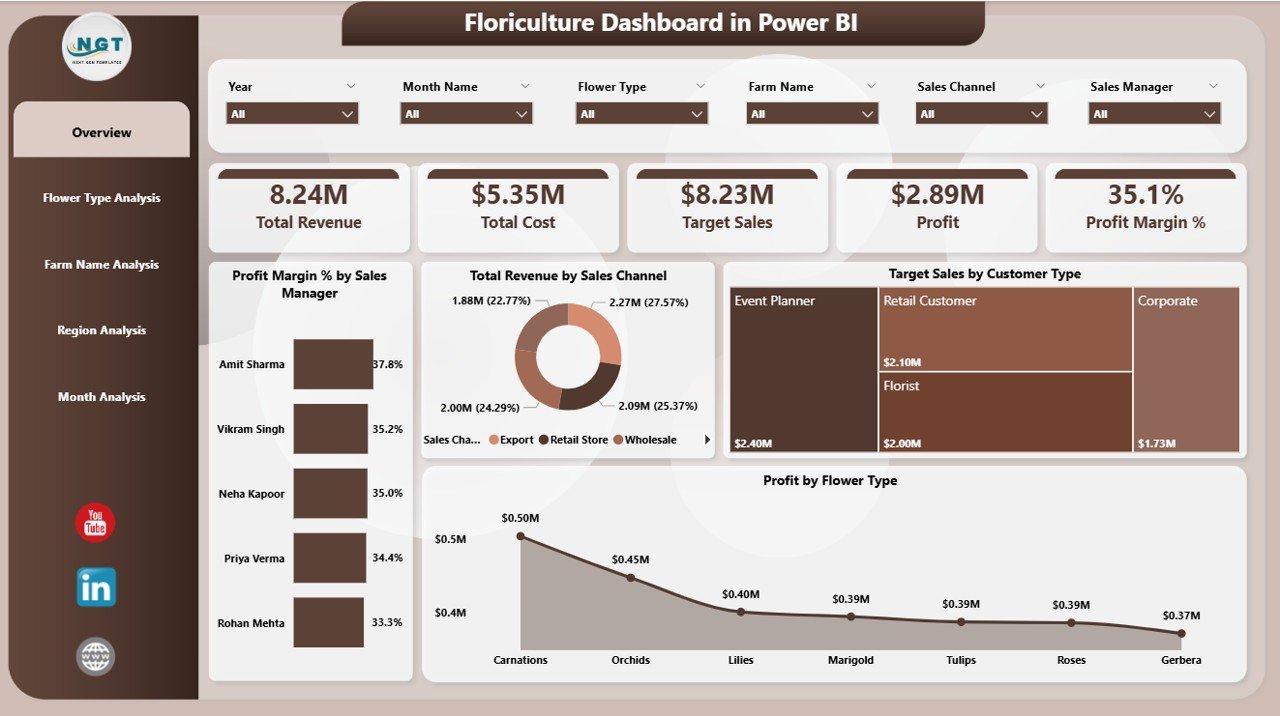
The Overview Page acts as the main control center of the dashboard.
Key Elements on This Page:
-
Slicers for filtering data
-
5 KPI Cards
-
Summary visuals
KPI Cards Included:
-
Profit Margin % by Sales Manager
-
Total Revenue by Sales Channel
-
Target Sales by Customer Type
-
Profit by Flower Type
What Can You Analyze Here?
-
Which sales manager generates the highest margin?
-
Which sales channel performs best?
-
Which customer type contributes most revenue?
-
Which flower type brings maximum profit?
Because this page combines multiple KPIs, managers quickly understand overall performance.
Moreover, slicers allow filtering by:
-
Month
-
Region
-
Flower Type
-
Sales Channel
Therefore, decision-makers can drill down instantly.
2️⃣ Flower Type Analysis – Which Flowers Drive Maximum Revenue?
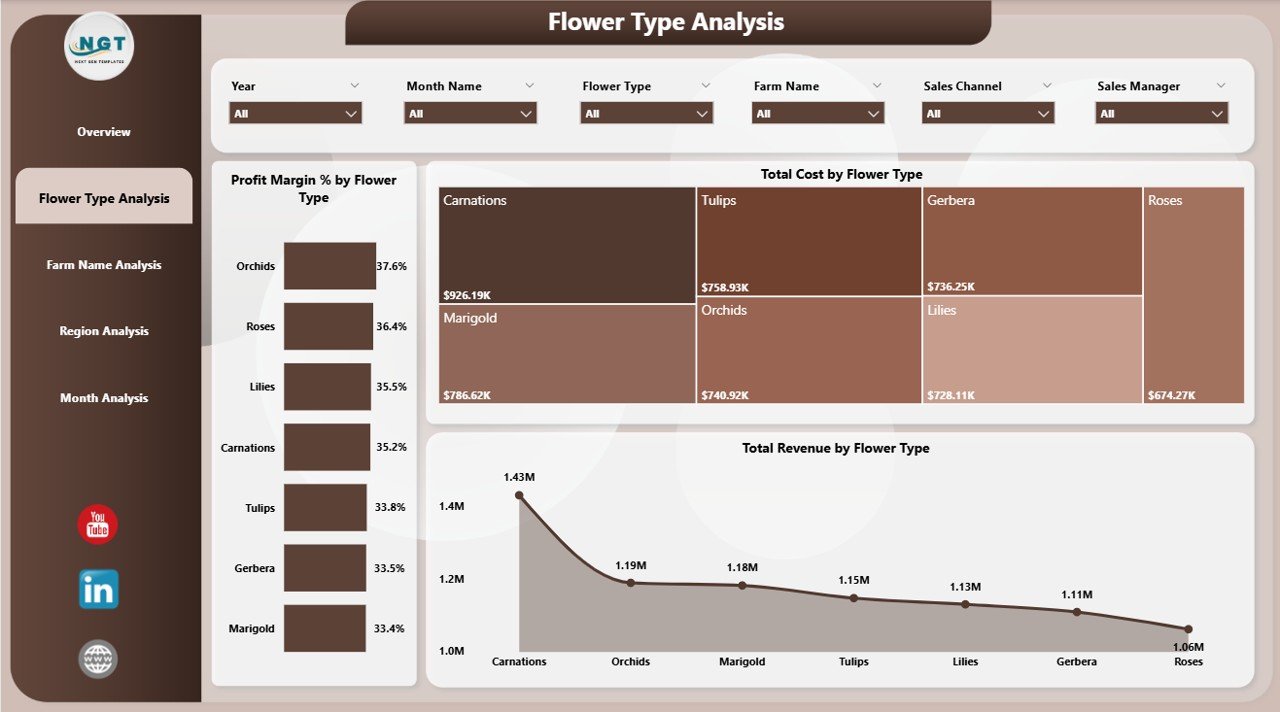
Different flower types generate different margins. For example:
-
Roses may have high volume
-
Orchids may have high margins
-
Lilies may fluctuate seasonally
This page focuses entirely on flower performance.
Charts Included:
-
Profit Margin % by Flower Type
-
Total Revenue by Flower Type
-
Revenue Comparison by Flower Type
What Insights Can You Get?
-
Which flower type generates the highest revenue?
-
Which flower has the best margin?
-
Which flower needs pricing adjustment?
As a result, you can:
-
Promote high-margin flowers
-
Reduce low-margin inventory
-
Adjust production planning
Therefore, this page directly supports pricing and marketing strategy.
Click to Purchases Floriculture Dashboard in Power BI
3️⃣ Farm Name Analysis – Which Farm Performs Best?
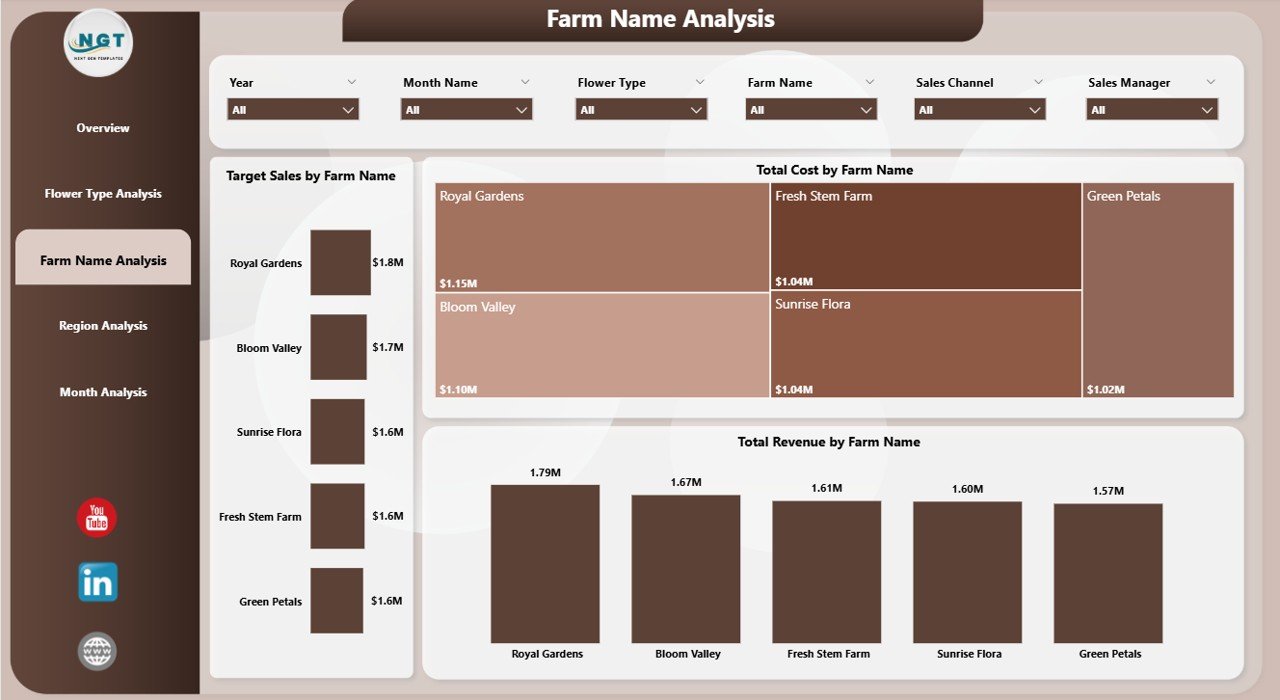
If you operate multiple farms or purchase from different growers, you must track each farm’s contribution.
This page focuses on farm-level performance.
Charts Included:
-
Target Sales by Farm Name
-
Total Revenue by Farm Name
-
Revenue Comparison by Farm
What Can You Analyze?
-
Which farm meets targets consistently?
-
Which farm underperforms?
-
Which farm generates higher revenue?
Because farm performance varies due to soil, climate, and management, this analysis helps:
-
Improve production planning
-
Negotiate supplier contracts
-
Identify high-performing farms
Consequently, your sourcing decisions improve significantly.
4️⃣ Region Analysis – Which Region Generates Maximum Profit?
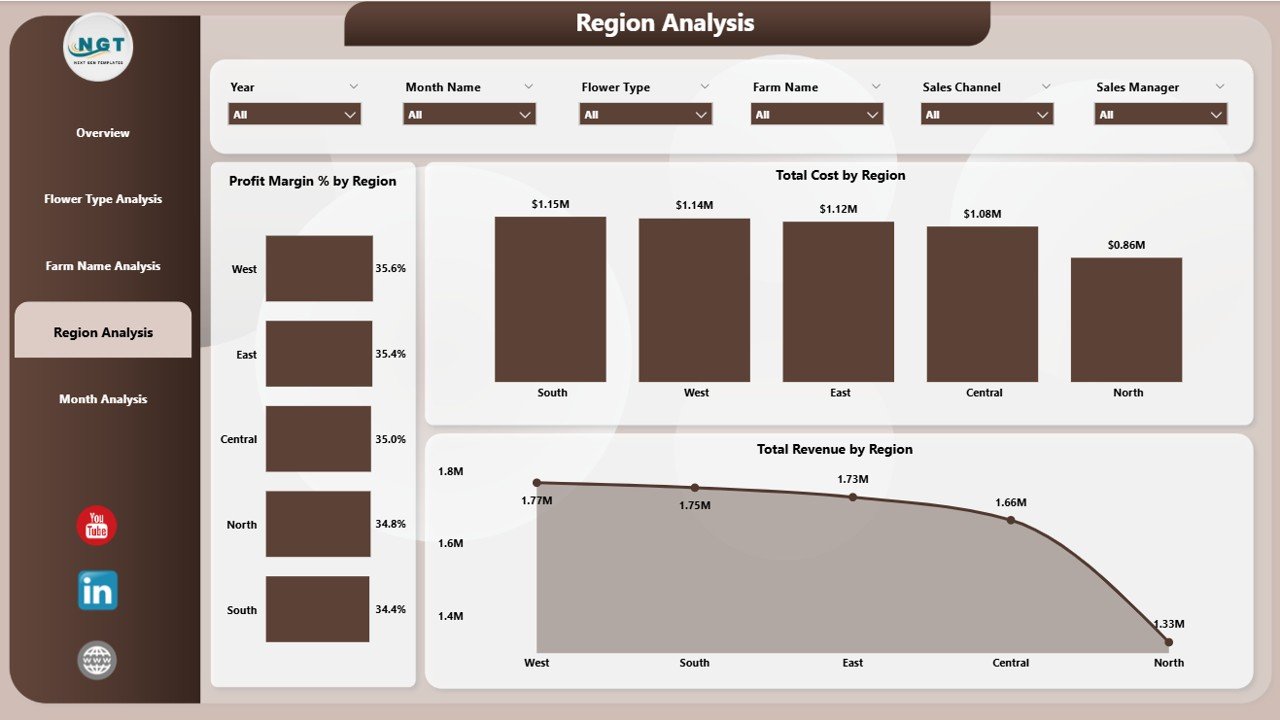
Floriculture businesses sell across multiple regions. However, not all regions perform equally.
This page analyzes regional performance.
Charts Included:
-
Profit Margin % by Region
-
Total Revenue by Region
-
Revenue Comparison by Region
Insights You Can Derive:
-
Which region generates highest revenue?
-
Which region delivers best margin?
-
Which region requires sales support?
Therefore, management can:
-
Increase marketing in profitable regions
-
Reduce cost in low-margin regions
-
Adjust regional pricing
As a result, regional performance becomes transparent.
5️⃣ Month Analysis – How Does Performance Change Over Time?
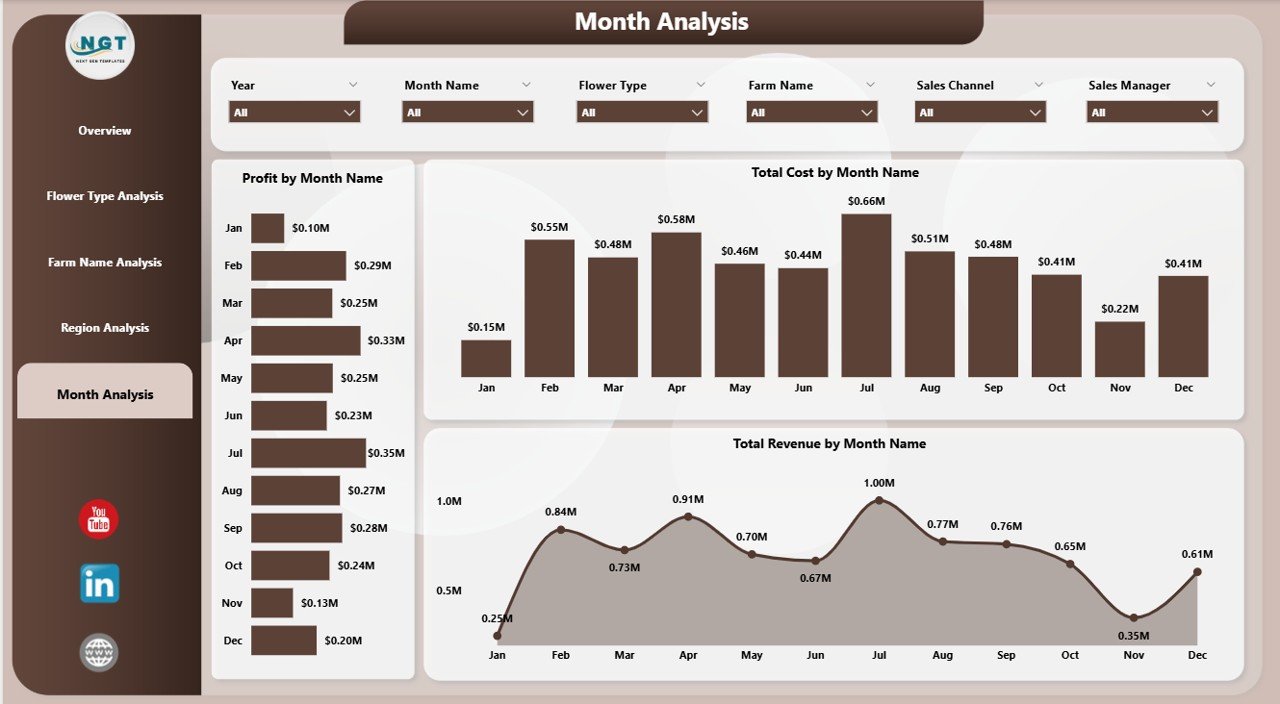
Seasonality plays a major role in floriculture.
For example:
-
Valentine’s Day increases rose demand
-
Wedding seasons increase premium flower demand
-
Festivals increase bulk orders
Therefore, month-wise analysis becomes critical.
Click to Purchases Floriculture Dashboard in Power BI
Charts Included:
-
Profit by Month
-
Total Revenue by Month
-
Revenue Trend by Month
What Can You Track?
-
Seasonal revenue spikes
-
Monthly profit variation
-
Trend comparison
Because this page shows time-based trends, managers can:
-
Forecast future demand
-
Plan inventory
-
Align production schedules
Consequently, wastage reduces and profitability improves.
Key KPIs Included in the Floriculture Dashboard
Here are the main KPIs tracked:
-
Total Revenue
-
Profit
-
Profit Margin %
-
Target Sales
-
Sales by Flower Type
-
Sales by Farm
-
Sales by Region
-
Sales by Channel
These KPIs help measure:
-
Financial performance
-
Operational efficiency
-
Sales effectiveness
How Does Power BI Make This Dashboard Powerful?
Power BI offers:
-
Interactive visuals
-
Drill-through capability
-
Real-time filtering
-
Dynamic slicers
-
Easy sharing
Therefore, managers can explore data without technical skills.
Moreover, Power BI updates visuals automatically when data refreshes.
As a result, the dashboard always shows current performance.
Advantages of Floriculture Dashboard in Power BI
Why Should You Use This Dashboard?
1️⃣ Improves Decision-Making
Because you see data clearly, you make faster decisions.
2️⃣ Identifies High-Margin Flower Types
You focus on profitable flowers instead of low-margin products.
3️⃣ Enhances Farm Performance Tracking
You compare farms easily and reward top performers.
4️⃣ Improves Regional Sales Strategy
You allocate resources based on data.
5️⃣ Tracks Seasonal Trends
You plan production before peak demand.
6️⃣ Saves Time
Instead of manual reports, you use automated visuals.
7️⃣ Reduces Data Errors
Power BI minimizes manual calculation mistakes.
Best Practices for the Floriculture Dashboard in Power BI
To get maximum value, follow these best practices:
✅ Maintain Clean Data
-
Use consistent flower names
-
Avoid duplicate records
-
Update targets monthly
✅ Use Clear Naming Conventions
-
Standardize farm names
-
Standardize region names
-
Standardize sales channel names
✅ Update Data Regularly
-
Refresh daily or weekly
-
Validate numbers before refresh
✅ Monitor Profit Margin Closely
-
Track cost changes
-
Adjust pricing accordingly
✅ Use Filters Strategically
-
Compare regions
-
Compare flower types
-
Compare months
✅ Review Monthly Trends
-
Identify seasonal spikes
-
Plan inventory accordingly
When you follow these practices, the dashboard delivers accurate insights.
Click to Purchases Floriculture Dashboard in Power BI
Who Can Benefit from the Floriculture Dashboard?
This dashboard suits:
-
Flower farm owners
-
Export managers
-
Sales managers
-
Floriculture distributors
-
Financial analysts
-
Greenhouse managers
Because it provides structured insights, it supports every level of management.
How Does This Dashboard Improve Profitability?
First, it identifies high-margin flower types.
Second, it highlights underperforming regions.
Third, it shows seasonal patterns.
Fourth, it compares farms effectively.
Therefore, managers can:
-
Adjust pricing
-
Increase marketing
-
Improve sourcing
-
Optimize production
Consequently, profitability improves steadily.
Conclusion
The floriculture industry demands speed, accuracy, and smart decisions. However, manual reporting slows growth. Therefore, businesses must adopt data-driven systems.
The Floriculture Dashboard in Power BI offers:
-
Clear KPI tracking
-
Flower type analysis
-
Farm performance monitoring
-
Regional comparison
-
Monthly trend insights
Because it combines all critical metrics into one interactive platform, it transforms raw data into actionable insights.
If you want to improve revenue, track margins, and plan seasonal demand effectively, this dashboard becomes an essential tool for your floriculture business.
Frequently Asked Questions (FAQs)
1. What is a Floriculture Dashboard in Power BI?
It is a business intelligence tool that tracks revenue, profit, targets, flower type performance, farm performance, and regional sales using interactive visuals.
2. Can I customize the Floriculture Dashboard?
Yes. You can modify KPIs, add filters, change visuals, and adjust metrics according to your business needs.
3. Does this dashboard support seasonal analysis?
Yes. The Month Analysis page helps track seasonal demand and profit trends.
4. Who should use this dashboard?
Flower farm owners, exporters, distributors, and sales managers benefit the most from this dashboard.
5. How often should I update the data?
You should update the data daily or weekly, depending on your sales volume.
6. Can this dashboard help increase profit?
Yes. Because it identifies high-margin products and underperforming regions, it helps improve pricing and sales strategy.
Visit our YouTube channel to learn step-by-step video tutorials