Running a food and beverage business requires constant monitoring of operations, finances, and customer experience. Whether you manage a restaurant, café, catering service, or large-scale food processing unit, measuring the right metrics is the foundation for sustainable growth. That’s where a Food and Beverage KPI Dashboard in Excel becomes a game-changer.
This article explores everything you need to know about creating and using a Food and Beverage KPI Dashboard in Excel. We’ll look at its structure, key features, advantages, best practices, and frequently asked questions to help you implement it effectively.
Click to Purchases Food and Beverage KPI Dashboard in Excel
What Is a Food and Beverage KPI Dashboard?
A Food and Beverage KPI Dashboard is a management tool that consolidates essential performance metrics into a single, easy-to-read Excel file. It allows managers to track financial health, operational efficiency, customer satisfaction, and compliance metrics in one place.
By integrating actual data, targets, and previous year comparisons, this dashboard highlights trends, pinpoints bottlenecks, and helps decision-makers act quickly.
In simple terms, it transforms raw data into actionable insights—without the need for expensive software.
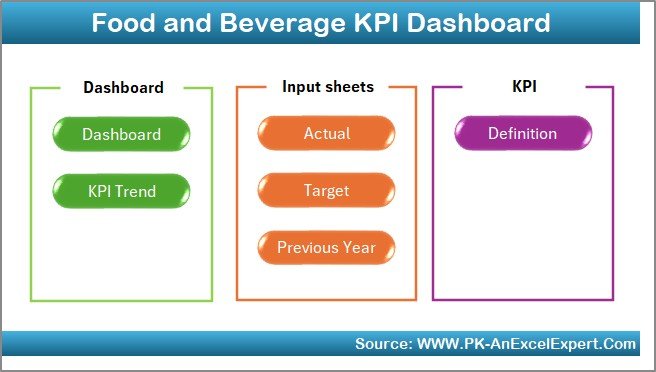
Structure of the Food and Beverage KPI Dashboard in Excel
This dashboard comes with 7 structured worksheet tabs, each serving a specific purpose. Let’s explore them in detail:
Home Sheet
-
Works as an index page with 6 navigation buttons.
-
Allows quick movement to Dashboard, KPI Trend, Actual Numbers Input, Target, Previous Year, and KPI Definition sheets.
-
Provides a user-friendly starting point for anyone accessing the file.
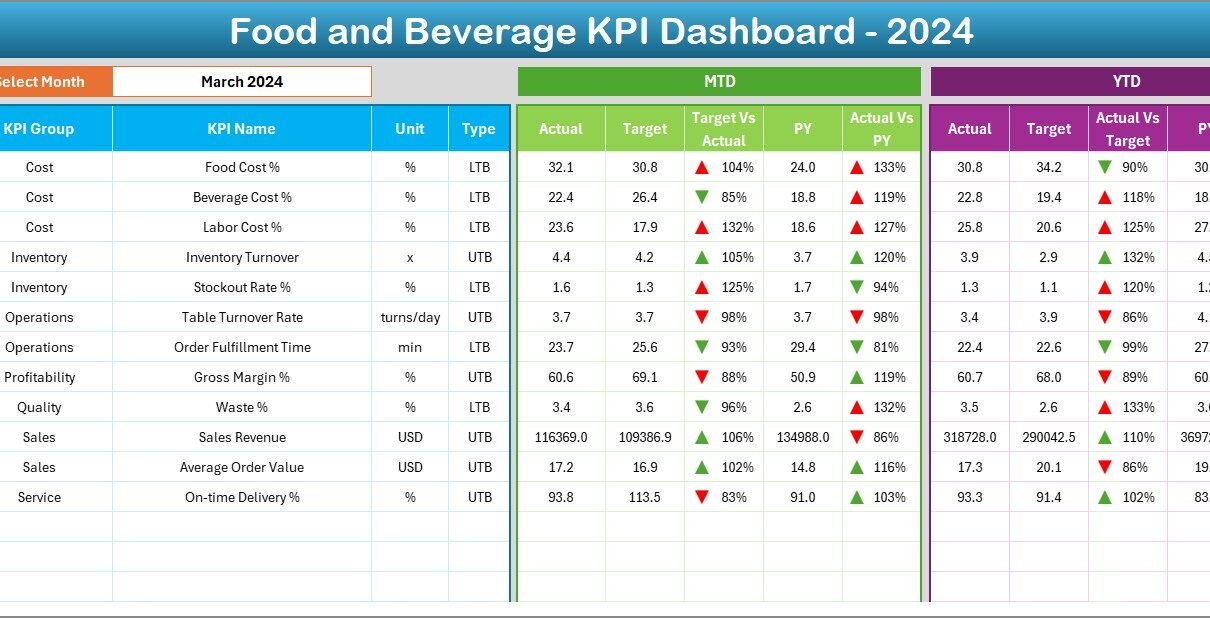
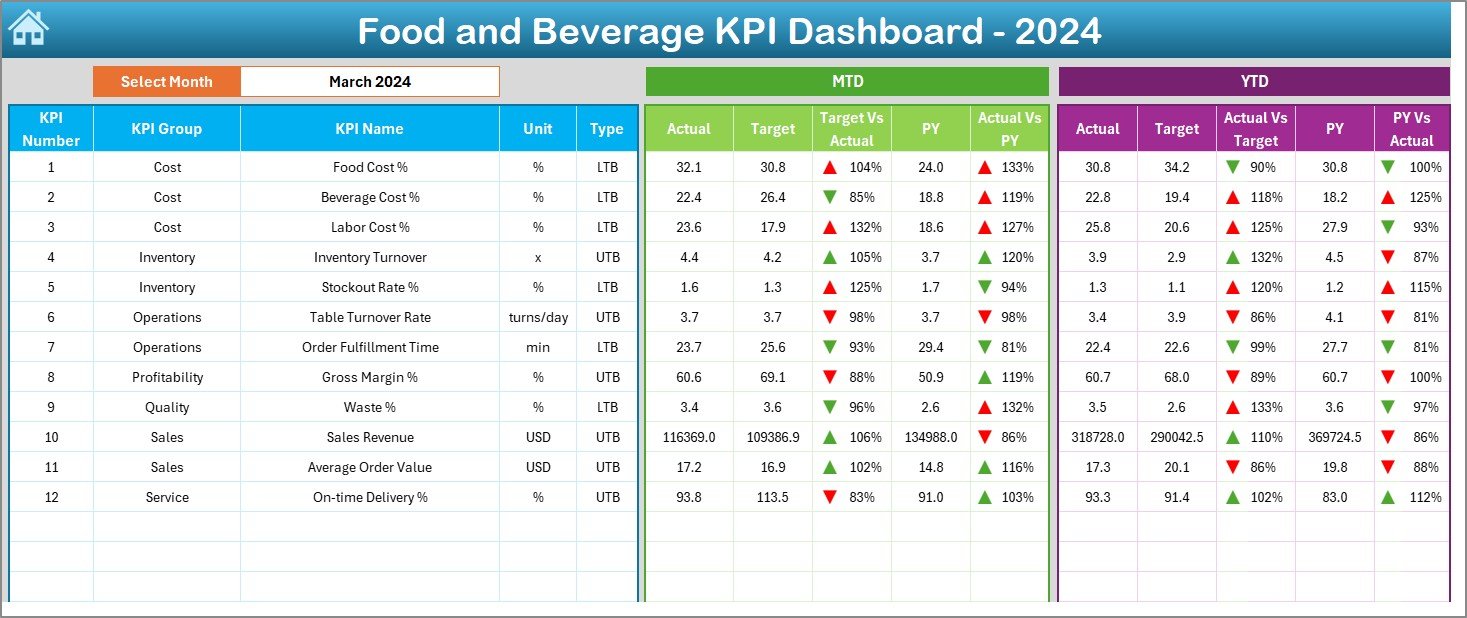
Dashboard Sheet Tab
-
The main analytical sheet of the dashboard.
-
Users can select the month from a dropdown (cell D3).
-
Shows Month-to-Date (MTD) and Year-to-Date (YTD) numbers across Actual, Target, and Previous Year data.
-
Uses conditional formatting with up/down arrows to display performance vs. target and vs. previous year.
-
Offers a holistic view of performance at a glance.
KPI Trend Sheet Tab
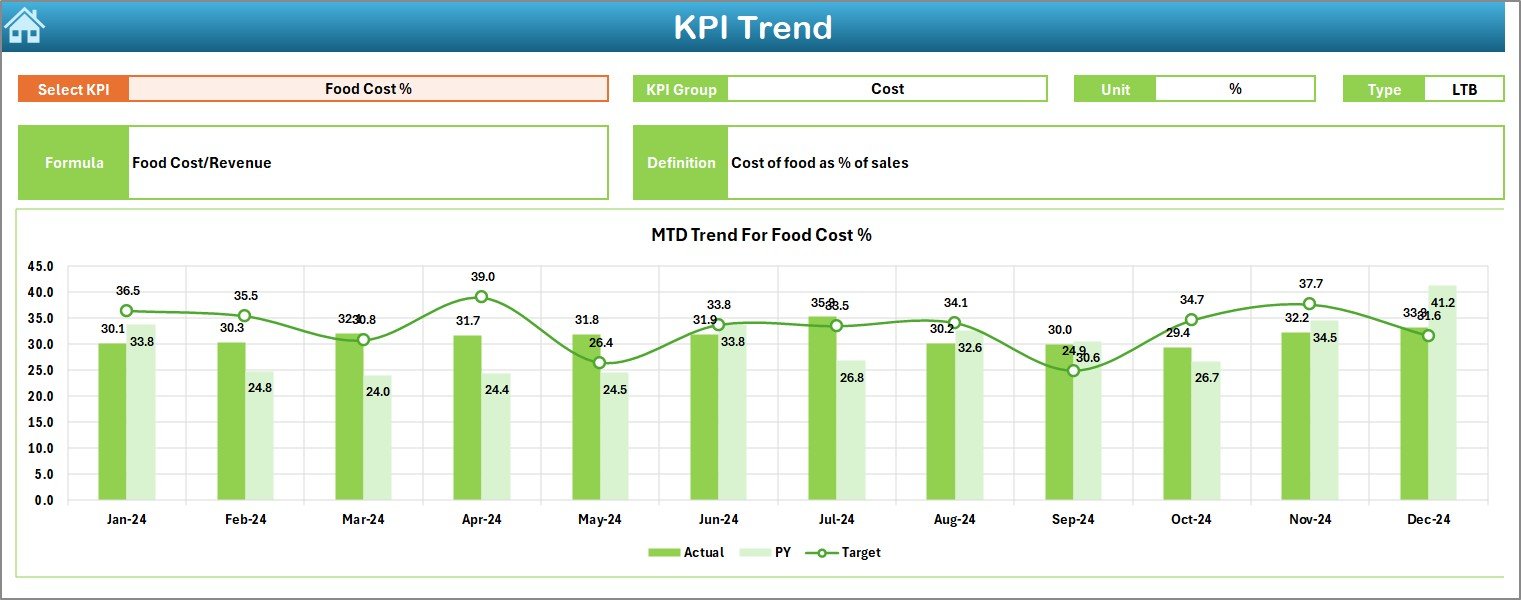
-
Provides dynamic KPI selection (dropdown in cell C3).
-
Displays KPI details such as Group, Unit, Type (Lower the Better or Upper the Better), Formula, and Definition.
-
Visualizes MTD and YTD trends for Actual, Target, and Previous Year using charts.
-
Helps managers identify patterns and long-term progress.
Actual Numbers Input Sheet
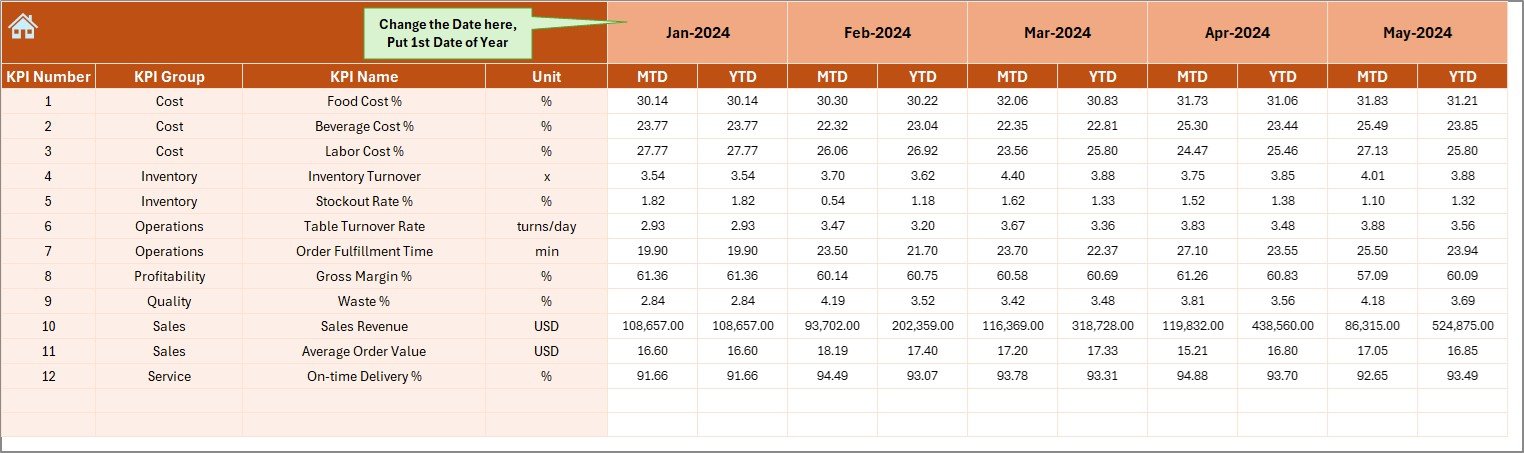
-
Serves as the data entry sheet for Actual MTD and YTD values.
-
Users update this sheet monthly.
-
Flexible month setup (input the first month of the year in cell E1).
-
Ensures that the dashboard stays updated with fresh data.
Target Sheet Tab
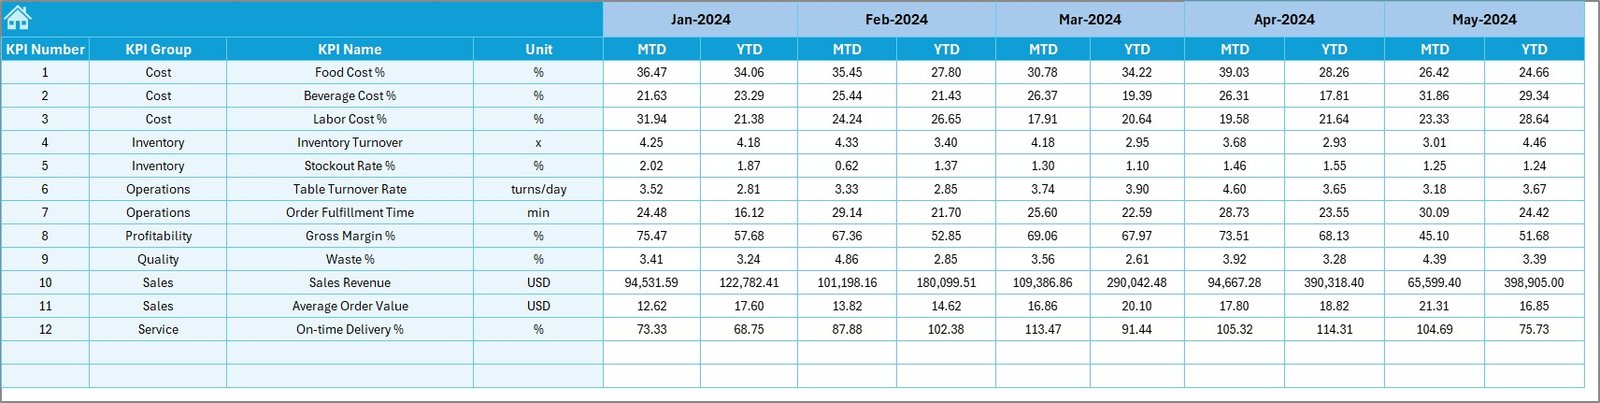
-
Stores monthly and yearly targets for each KPI.
-
Organized for both MTD and YTD tracking.
-
Keeps management aligned with performance expectations.
Previous Year Numbers Sheet
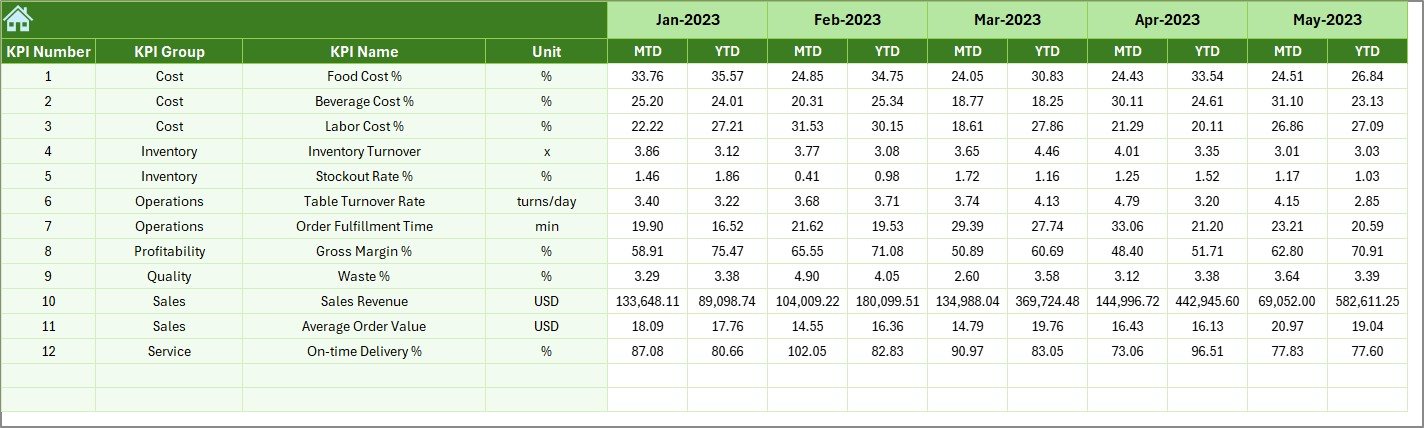
-
Contains historical data for benchmarking.
-
Lets managers compare current performance against the previous year.
-
Crucial for spotting growth patterns or declining trends.
KPI Definition Sheet Tab
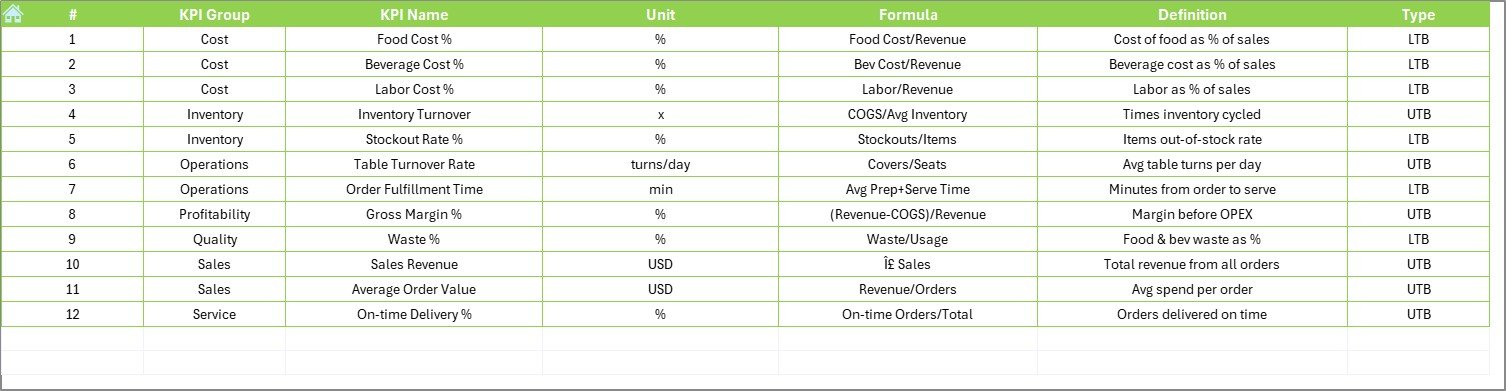
Defines each KPI clearly with:
- KPI Name
- KPI Group
- Unit of Measurement
- Formula
- Definition
-
Ensures clarity and consistency across the team when measuring KPIs.
Key Performance Indicators (KPIs) for Food and Beverage
Click to Purchases Food and Beverage KPI Dashboard in Excel
Choosing the right KPIs is vital. Here are some essential ones that food and beverage businesses often track:
-
Sales Revenue per Month – Total income generated from sales.
-
Cost of Goods Sold (COGS) – Direct cost of producing food and beverages.
-
Gross Profit Margin (%) – Profitability after deducting COGS.
-
Labor Cost Percentage (%) – Employee costs compared to sales.
-
Table Turnover Rate – How quickly tables are occupied and vacated.
-
Customer Satisfaction Score (CSAT) – Feedback-based satisfaction index.
-
Food Waste Percentage – Amount of food wasted compared to sales.
-
Inventory Turnover Ratio – Frequency of inventory usage and replenishment.
-
Average Order Value (AOV) – Average amount spent per order.
-
On-Time Delivery Rate (for catering/food delivery services).
These KPIs vary depending on whether you are running a restaurant, café, bar, or packaged food business.
Why Use Excel for Food and Beverage KPI Dashboard?
Many wonder why Excel is still a preferred tool despite modern BI platforms. The reasons include:
-
Accessibility: Most businesses already use Excel.
-
Low Cost: No extra software purchase is required.
-
Flexibility: Easily customizable for any business model.
-
Integration: Can connect with POS, ERP, or accounting systems.
-
Visualization: Pivot tables, charts, and conditional formatting make insights clear.
Excel provides the perfect balance of simplicity and power, especially for small to medium-sized businesses.
Advantages of Food and Beverage KPI Dashboard in Excel
Here are the biggest benefits:
📊 Centralized View – Track all KPIs in one place.
⏳ Time-Saving – Automated updates reduce manual reporting.
💡 Better Decisions – Clear comparisons against targets and history.
📈 Trend Analysis – Understand growth and decline over time.
👥 Team Alignment – Everyone refers to the same performance definitions.
💰 Cost Efficiency – No need for expensive BI software.
Opportunities for Improvement
Even with its advantages, dashboards in Excel can be improved in the following ways:
🔄 Automation – Use Power Query or VBA for automatic data refresh.
🌐 Integration – Connect with POS or ERP systems for real-time updates.
📱 Mobile Access – Enable cloud sharing for managers on the move.
🎯 KPI Expansion – Add advanced KPIs like Customer Lifetime Value (CLV).
🛠️ Visualization Upgrade – Use advanced Excel charts for better insights.
Best Practices for the Food and Beverage KPI Dashboard
Follow these practices for maximum impact:
✔️ Keep KPIs Relevant – Only track what matters to your goals.
✔️ Update Data Regularly – Monthly inputs ensure accuracy.
✔️ Use Conditional Formatting – Highlight KPIs with red/green arrows for quick insights.
✔️ Benchmark with History – Always compare with previous year data.
✔️ Simplify Navigation – Provide buttons or slicers for quick access.
✔️ Train Staff – Ensure the team understands how to use the dashboard.
How to Implement the Dashboard in Your Business
- Identify KPIs: Choose metrics aligned with your goals (cost reduction, growth, efficiency).
- Prepare Data: Gather sales, expenses, labor, and customer feedback.
- Input Targets: Set realistic monthly and yearly goals.
- Update Monthly: Enter actual numbers regularly.
- Review Dashboard: Analyze MTD and YTD results.
- Take Action: Adjust operations based on insights.
Common Mistakes to Avoid
❌ Tracking too many KPIs—focus on the most critical.
❌ Ignoring historical comparisons.
❌ Not updating data consistently.
❌ Using complex formulas without proper documentation.
❌ Overloading the dashboard with too many visuals.
Conclusion
A Food and Beverage KPI Dashboard in Excel is a must-have for businesses that want to stay competitive in today’s fast-paced environment. It simplifies complex data into easy visuals, supports informed decisions, and drives operational efficiency. With its structured worksheets, clear definitions, and customizable features, it serves as both a performance tracker and a growth enabler.
By following best practices and avoiding common pitfalls, food and beverage managers can ensure that every decision is data-driven, accurate, and aligned with business goals.
Frequently Asked Questions (FAQs)
1. What KPIs should a restaurant track?
A restaurant should track sales revenue, gross profit margin, labor cost percentage, food waste percentage, customer satisfaction, and table turnover rate.
2. How often should the dashboard be updated?
Update it monthly with actual numbers. However, if connected to POS systems, you can refresh data weekly or even daily.
3. Can small businesses use this dashboard?
Yes. Excel dashboards are cost-effective and suitable for small businesses with limited resources.
4. What’s the difference between MTD and YTD in the dashboard?
-
MTD (Month-to-Date): Performance for the current month.
-
YTD (Year-to-Date): Performance from the beginning of the year to the current month.
5. Is Excel better than Power BI for dashboards?
For small to medium businesses, Excel is simple, accessible, and low-cost. Power BI is better for large-scale, real-time, and advanced analytics needs.
Visit our YouTube channel to learn step-by-step video tutorials