Running a successful food service business is about more than great taste—it’s about efficiency, consistency, and customer satisfaction. Restaurants, cafés, catering companies, and food distributors all need to track key metrics to ensure smooth operations, profitability, and quality service.
The Food Service KPI Scorecard in Excel makes this possible. It’s a ready-to-use, interactive Excel template designed to monitor performance across all areas of the food service industry—from cost control and service speed to hygiene and customer satisfaction.
This article explores how this KPI scorecard helps food service managers visualize data, compare results, and make data-driven decisions that improve efficiency and profit margins.
Click to Purchases Food Service KPI Scorecard in Excel
📊 What Is a Food Service KPI Scorecard?
A Food Service KPI Scorecard is a structured Excel-based reporting tool that tracks all critical key performance indicators (KPIs) for your restaurant or catering operations. It consolidates financial, operational, and quality-related data into one easy-to-understand dashboard.
Instead of relying on manual reports or multiple spreadsheets, this scorecard provides a centralized view of business performance, allowing owners and managers to monitor key metrics like sales per employee, customer retention, and cost of goods sold (COGS).
It simplifies the complex task of managing daily restaurant operations and helps ensure every meal served meets profitability and quality goals.
Click to Purchases Food Service KPI Scorecard in Excel
🧩 Structure of the Food Service KPI Scorecard in Excel
This ready-to-use Excel template is built with four functional worksheets, each serving a specific analytical purpose.
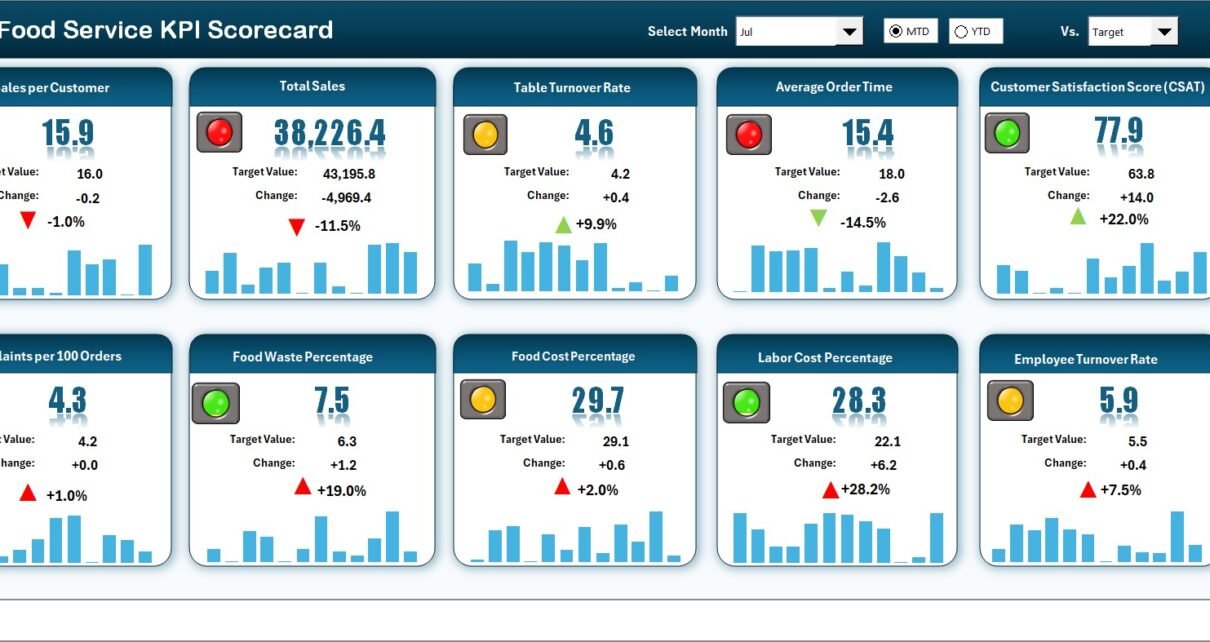
1️⃣ Scorecard Sheet – The Main Dashboard
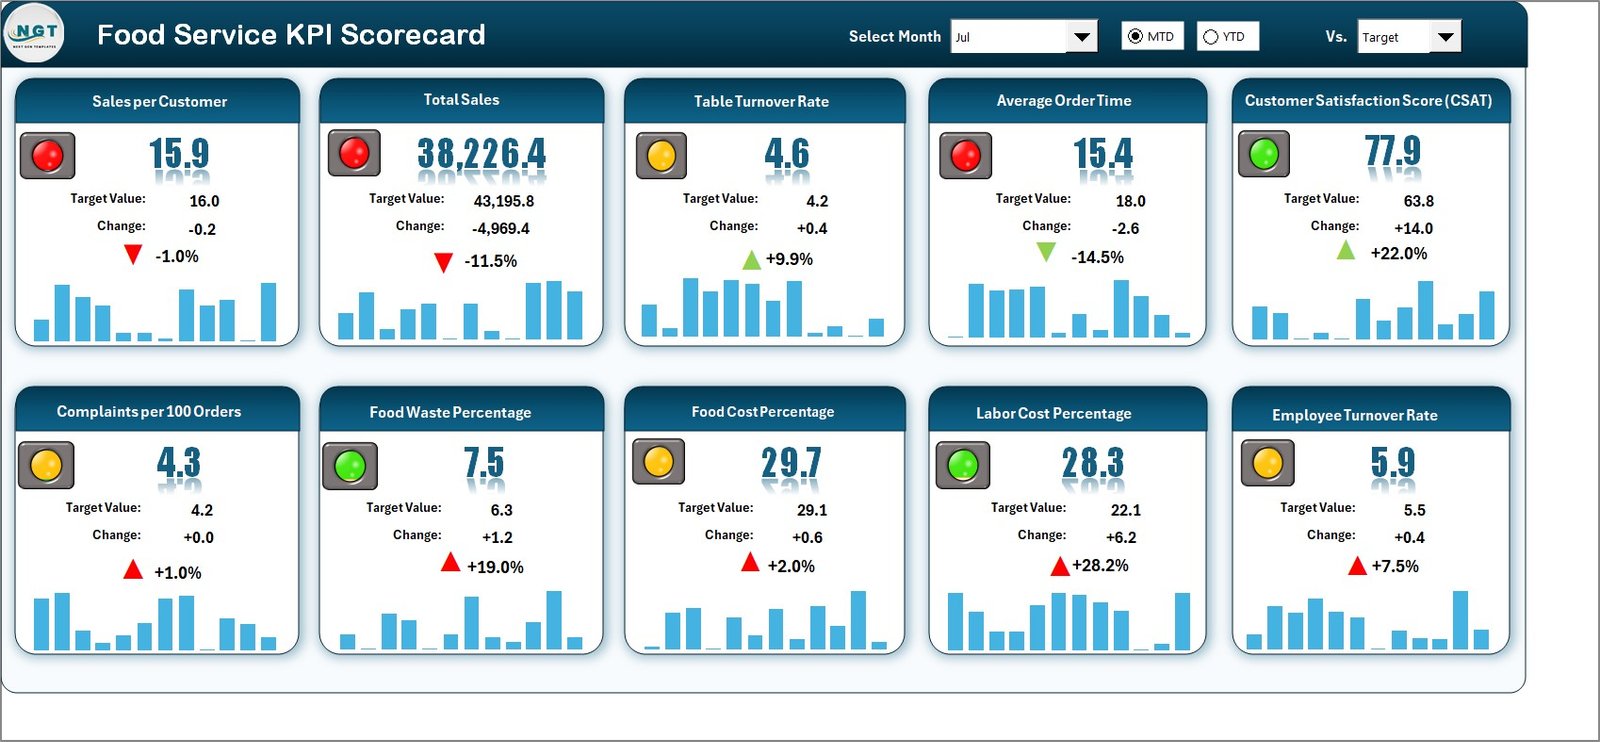
The Scorecard Sheet acts as the command center of your performance monitoring.
Key Features:
-
🗓️ Dropdown Menus: Select any month to analyze Month-to-Date (MTD) or Year-to-Date (YTD) results.
-
🎯 Actual vs Target Comparison: See how your performance stacks up against goals for each KPI.
-
🚦 Visual Indicators: Conditional formatting highlights performance status with color-coded cues—green for success, red for attention needed.
-
📊 Comprehensive Overview: Displays key metrics such as MTD sales, food cost %, table turnover rate, and customer satisfaction trends.
This page gives managers a high-level view of restaurant or catering performance in real time.
2️⃣ KPI Trend Sheet – Analyze Performance Over Time
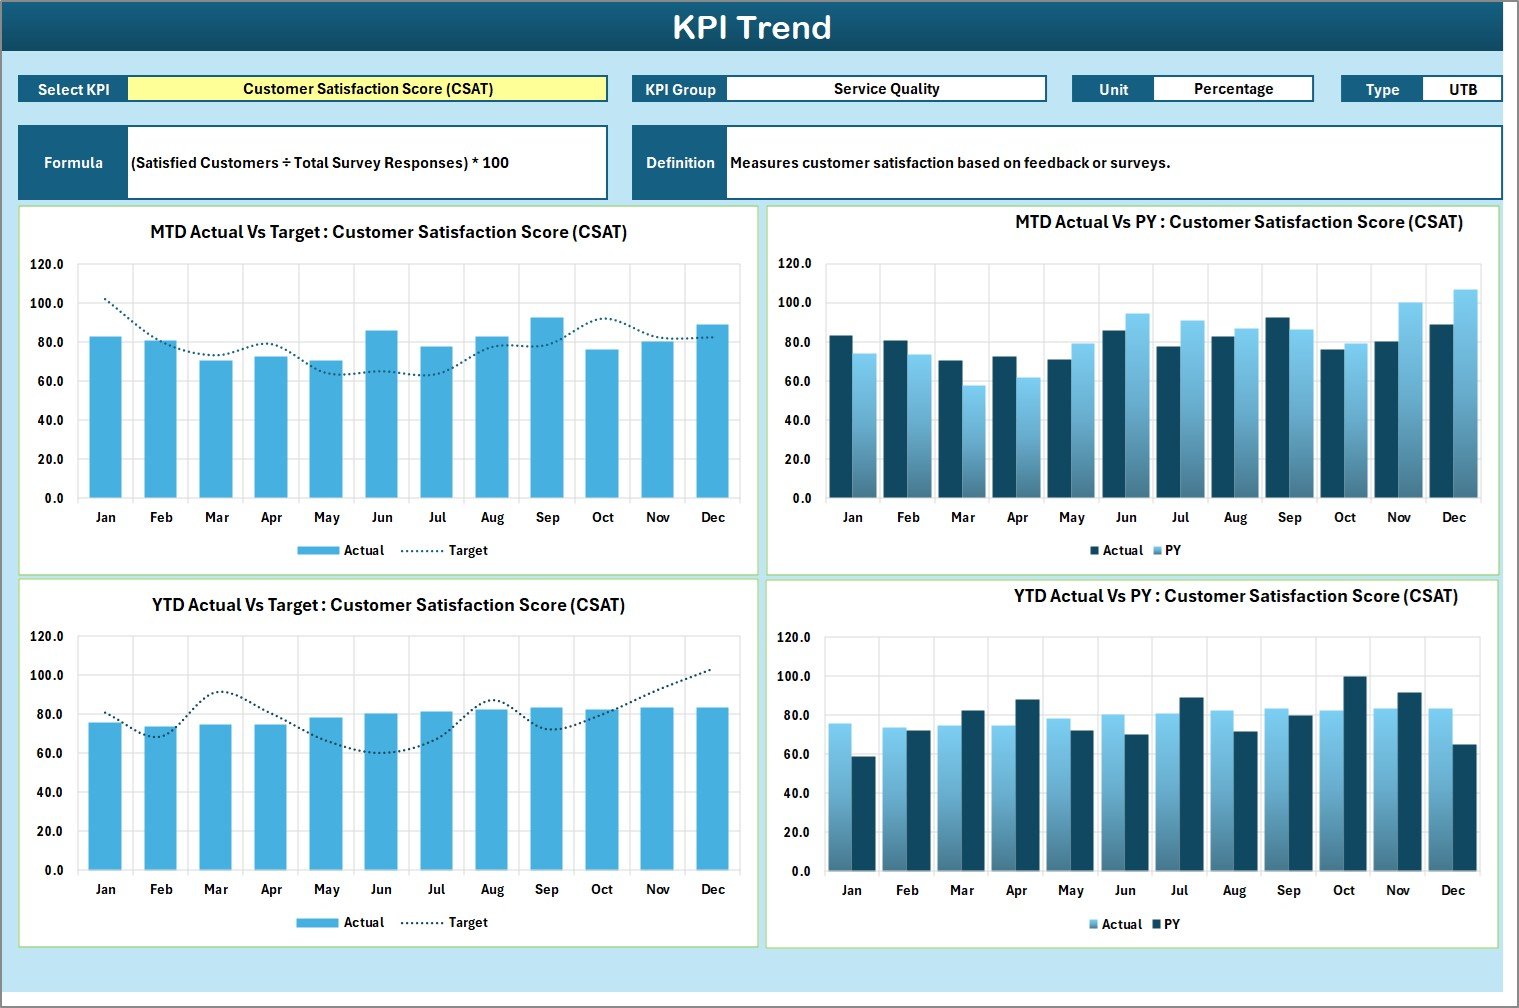
The KPI Trend Sheet provides a detailed breakdown of each metric’s performance pattern.
Highlights:
-
🎯 KPI Selection (cell C3): Pick a KPI to view its data.
-
📋 KPI Attributes: Displays KPI Group, Unit of Measure, Formula, Type (Lower or Upper the Better), and KPI Definition.
-
📈 Trend Charts: Visualize MTD and YTD trends for Actual, Target, and Previous Year (PY) data.
By tracking trends, food service managers can quickly detect cost fluctuations, efficiency drops, or quality inconsistencies.
3️⃣ Input Data Sheet – Manage Operational Data
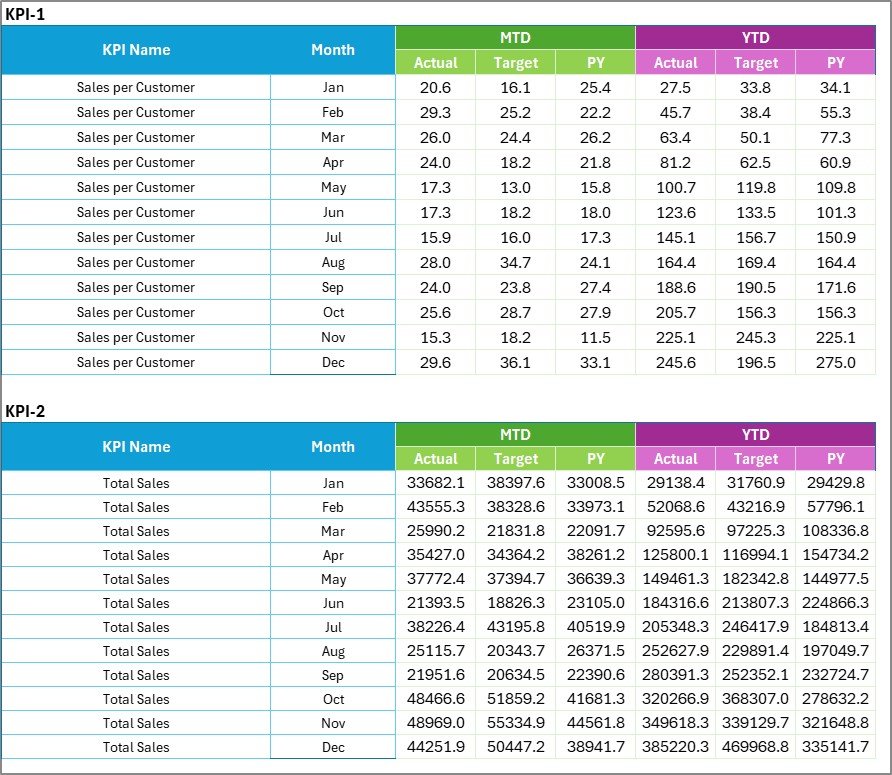
The Input Data Sheet is where you record raw KPI data.
Key Functions:
-
✍️ Input actual, target, and previous year values for each KPI.
-
🔄 Automatically updates visuals across all other sheets.
-
✅ Simplifies monthly updates, ensuring data stays current and consistent.
This sheet makes it easy to maintain accurate performance records for all business locations or service lines.
4️⃣ KPI Definition Sheet – Build Consistency
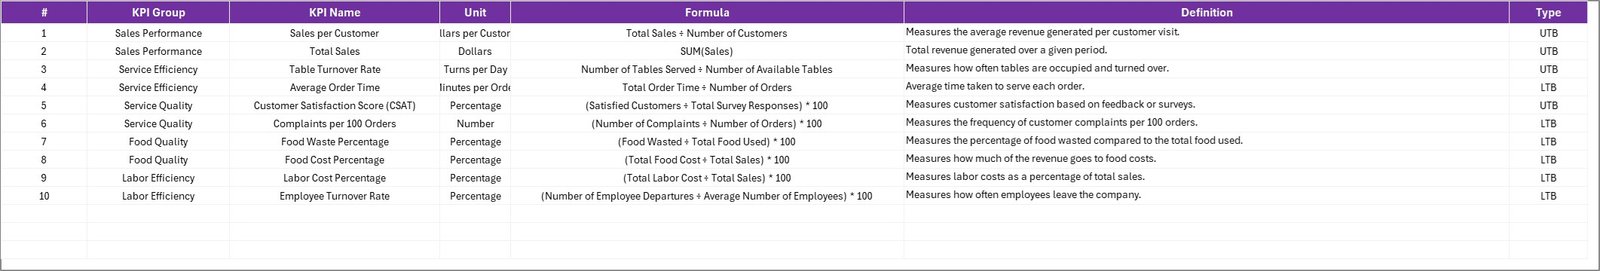
Every KPI needs clear definitions to ensure everyone measures performance the same way.
You’ll find columns for:
-
KPI Name
-
KPI Group
-
Unit
-
Formula
-
Definition
Having this standardized list ensures that staff and management are aligned on what each KPI represents and how it’s measured.
Click to Purchases Food Service KPI Scorecard in Excel
📈 Key Features of the Food Service KPI Scorecard in Excel
✅ Ready-to-Use Template: Pre-built structure requiring minimal setup.
📊 Dynamic Visuals: Automatically generated charts and visual indicators.
🔁 MTD & YTD Tracking: Provides monthly and yearly views for better context.
🎯 Actual vs Target Analysis: Instantly spot performance gaps.
🧩 Editable & Expandable: Add, delete, or modify KPIs based on business needs.
💬 Color-Coded Alerts: Simplify performance interpretation using conditional formatting.
🕒 Historical Comparison: Compare results with the previous year to monitor improvement.
💡 Fully Excel-Based: No external tools or add-ins required—just Excel.
💡 Advantages of the Food Service KPI Scorecard in Excel
🎯 1. Comprehensive View of Operations
Get all essential metrics in one dashboard, covering cost, efficiency, quality, and customer experience.
🧩 2. Data-Driven Decisions
Transform raw numbers into actionable insights to drive better business outcomes.
⏱️ 3. Time Efficiency
Automated calculations save hours of manual reporting and analysis.
📉 4. Error Reduction
Conditional formatting and formula automation minimize data-entry mistakes.
💰 5. Cost-Effective Solution
No need for complex BI tools—Excel offers everything you need at no additional cost.
💬 6. Performance Transparency
Makes it easier to communicate progress with kitchen staff, servers, and management.
📈 7. Historical Comparison
Evaluate performance trends and identify long-term improvement areas.
🔍 Opportunities for Improvement
While this Excel-based scorecard is highly effective, a few enhancements can make it even better:
-
🔄 Automate Data Imports: Use Power Query or VBA to pull data from POS or accounting systems.
-
📧 Add Alerts: Create conditional triggers that highlight underperforming KPIs in real time.
-
☁️ Collaborative Access: Host the file on SharePoint or OneDrive for multiple managers.
-
📊 Integrate with Power BI: For deeper insights and visual storytelling.
-
🧾 Expand KPI Library: Include metrics for sustainability or menu innovation.
-
🔐 Protect Sensitive Data: Apply sheet protection for manager-level access control.
🧭 Best Practices for Managing Food Service KPIs
1️⃣ Define Clear Objectives
Start with business goals—cost control, service quality, or profit margin—and select KPIs that support them.
2️⃣ Use SMART KPIs
KPIs should be Specific, Measurable, Achievable, Relevant, and Time-Bound.
3️⃣ Maintain Data Accuracy
Regularly validate input data for accuracy and consistency.
4️⃣ Review Performance Monthly
Use the Scorecard and Trend Sheets to identify performance issues early.
5️⃣ Involve Department Heads
Chefs, managers, and HR teams should all contribute insights into their respective KPIs.
6️⃣ Visualize Data Clearly
Avoid cluttered charts—keep visuals simple, color-coded, and easy to interpret.
7️⃣ Benchmark Against Industry Standards
Compare your metrics with industry averages to measure competitiveness.
8️⃣ Continuously Refine KPIs
Adjust KPIs as your food service business evolves—add delivery metrics, sustainability KPIs, or digital sales tracking as needed.
Click to Purchases Food Service KPI Scorecard in Excel
🧾 Real-World Applications
This Food Service KPI Scorecard is adaptable for many business types:
-
Restaurants & Cafés: Track daily sales, food cost %, and customer satisfaction.
-
Catering Services: Monitor order fulfillment times and event profitability.
-
Hotels & Resorts: Measure room service efficiency and dining quality scores.
-
Fast Food Chains: Analyze speed of service, order accuracy, and wastage levels.
-
Institutional Food Services: Track compliance, nutrition quality, and inventory turnover.
No matter the size or type of your operation, this dashboard ensures consistent monitoring and better decision-making.
📊 How the Scorecard Improves Decision-Making
-
Identifies trends in cost overruns or performance inefficiencies.
-
Tracks customer experience to enhance satisfaction and retention.
-
Supports forecasting and resource allocation based on data trends.
-
Helps detect waste or overproduction, improving profitability.
-
Encourages accountability and cross-department collaboration.
🧾 Conclusion
The Food Service KPI Scorecard in Excel is more than just a reporting tool—it’s your complete performance management system. It helps you manage cost, track efficiency, improve quality, and delight customers using a simple yet powerful Excel framework.
With its dynamic visuals, KPI trend analysis, and clear structure, this scorecard transforms everyday operational data into actionable insights. Whether you manage a small restaurant or a multi-location franchise, this Excel-based solution ensures you maintain excellence, consistency, and profitability across all areas of food service.
Click to Purchases Food Service KPI Scorecard in Excel
Frequently Asked Questions (FAQs)
1. What is a Food Service KPI Scorecard?
It’s an Excel template that tracks key restaurant or catering performance metrics like cost, sales, and satisfaction.
2. How do I use it?
Enter actual, target, and previous year data in the Input Sheet, then review visuals in the Scorecard and Trend Sheets.
3. Can I add custom KPIs?
Yes, you can easily add new KPIs or modify existing ones in the KPI Definition Sheet.
4. Does it support monthly analysis?
Yes, you can view Month-to-Date (MTD) and Year-to-Date (YTD) results using dropdown selections.
5. What kind of charts does it include?
It includes line charts, bar graphs, and conditional color indicators for quick analysis.
6. Can I compare with the previous year?
Yes, the template stores previous-year data for side-by-side comparison.
7. Is this suitable for small restaurants?
Absolutely. It’s simple, affordable, and requires no technical expertise.
8. Can I automate data entry?
Yes, advanced users can link it with POS or accounting systems through Power Query.
9. Is it customizable for multi-location businesses?
Yes, you can duplicate sheets or add filters to track multiple branches.
10. Who can benefit from it?
Restaurant owners, managers, accountants, and consultants who want to improve operational control and profitability.
Click to Purchases Food Service KPI Scorecard in Excel
Visit our YouTube channel to learn step-by-step video tutorials