Forestry operations demand precision. Forest managers must monitor harvesting performance, control plantation costs, and improve profit margins consistently. However, many forestry companies still depend on scattered Excel sheets and manual reports. As a result, leaders struggle to see real-time insights.
So, how can forestry businesses track harvested forest percentage, cost by manager, profit margin by region, plantation performance, and tree species profitability — all in one structured system?
The answer is simple.
Click to Purchases Forestry Dashboard in Power BI
You need a Forestry Dashboard in Power BI.
In this comprehensive guide, you will learn:
-
What a Forestry Dashboard in Power BI is
-
Why forestry companies need it
-
Detailed explanation of all 5 dashboard pages
-
Key KPIs included in the dashboard
-
Advantages of Forestry Dashboard in Power BI
-
Best practices for implementation
-
Frequently asked questions
Let us explore everything step by step.
What Is a Forestry Dashboard in Power BI?
A Forestry Dashboard in Power BI is a ready-to-use business intelligence solution designed for forestry companies, plantation owners, timber producers, and environmental management teams.
It collects forestry data in a structured format and transforms it into interactive visual insights inside Power BI.
Instead of reviewing multiple files, managers can:
-
Track harvested forest percentage
-
Monitor cost by forest manager
-
Compare profit margin by region
-
Analyze forest type performance
-
Evaluate plantation type profitability
-
Study tree species revenue contribution
-
Monitor monthly trends in cost and profit
Therefore, the dashboard improves visibility, accuracy, and decision-making speed.
Why Do Forestry Companies Need a Forestry Dashboard in Power BI?
Forestry operations involve large land areas, multiple managers, different forest types, and seasonal variations. Consequently, decision-makers need reliable data every month.
Without a structured dashboard:
-
Managers miss cost overruns
-
Companies struggle to track regional profitability
-
Plantation types show inconsistent performance
-
Tree species profitability remains unclear
-
Seasonal revenue trends become hard to predict
However, with a Forestry Dashboard in Power BI:
-
You centralize all data
-
You monitor KPIs in real time
-
You identify profitable forest zones
-
You reduce unnecessary costs
-
You improve long-term sustainability planning
As a result, your business moves from guesswork to data-driven growth.
Dashboard Structure – 5 Powerful Pages Explained
This Forestry Dashboard in Power BI contains 5 interactive pages. Each page focuses on a specific analytical area.
Let us explore each one in detail.
Click to Purchases Forestry Dashboard in Power BI
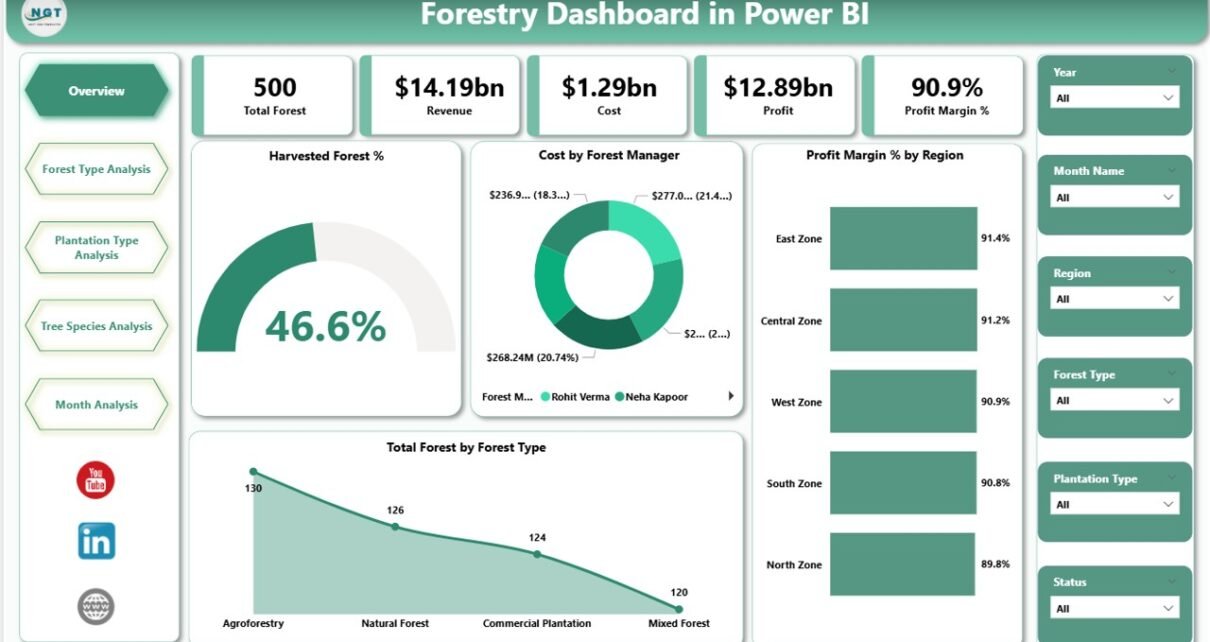
1️⃣ Overview Page – The Executive Summary
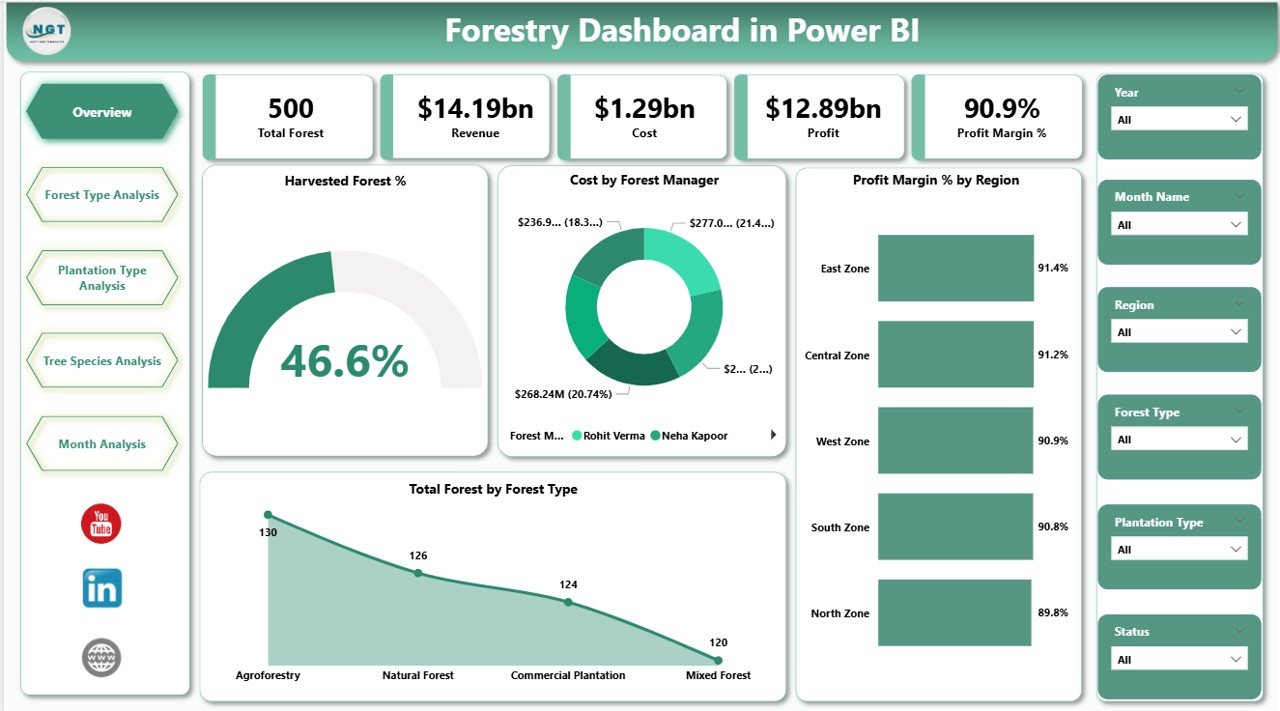
What Does the Overview Page Show?
This page includes:
-
Interactive slicers (filters)
-
5 KPI cards
-
Performance highlights
Key KPI Cards
-
Harvested Forest %
-
Cost by Forest Manager
-
Profit Margin % by Region
-
Total Forest by Forest Type
-
Overall financial performance summary
Why Is This Page Important?
Because executives need quick insights.
Instead of reading long reports, they can:
-
Instantly view harvesting progress
-
Compare regional profit margins
-
Identify high-cost forest managers
-
Review forest type distribution
Therefore, leadership can take quick action.
2️⃣ Forest Type Analysis – Which Forest Type Performs Best?
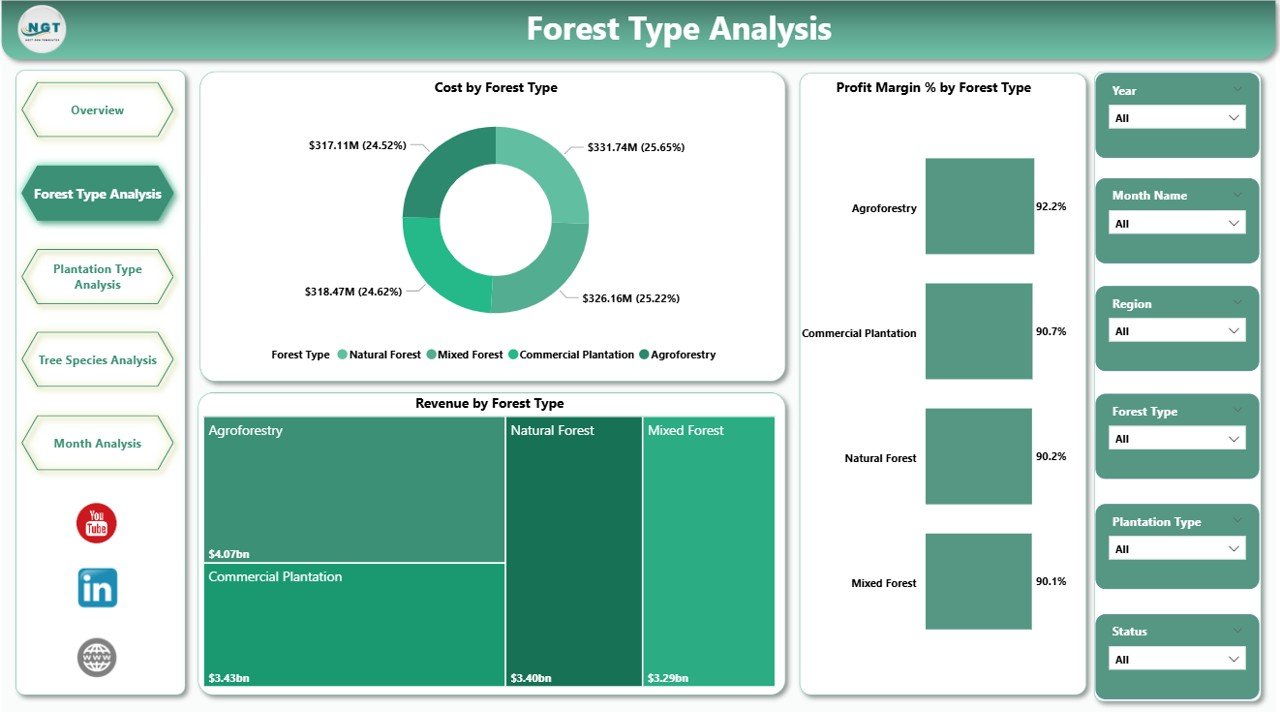
This page focuses entirely on forest types.
Charts Included
-
Cost by Forest Type
-
Profit Margin % by Forest Type
-
Revenue by Forest Type
What Can You Analyze?
-
Which forest type generates maximum revenue
-
Which type has higher maintenance cost
-
Which forest type provides the best margin
-
Underperforming forest segments
Therefore, managers can allocate resources wisely.
For example:
If Pine forests show higher revenue but lower margin, then managers can investigate cost drivers.
3️⃣ Plantation Type Analysis – Optimize Plantation Strategy
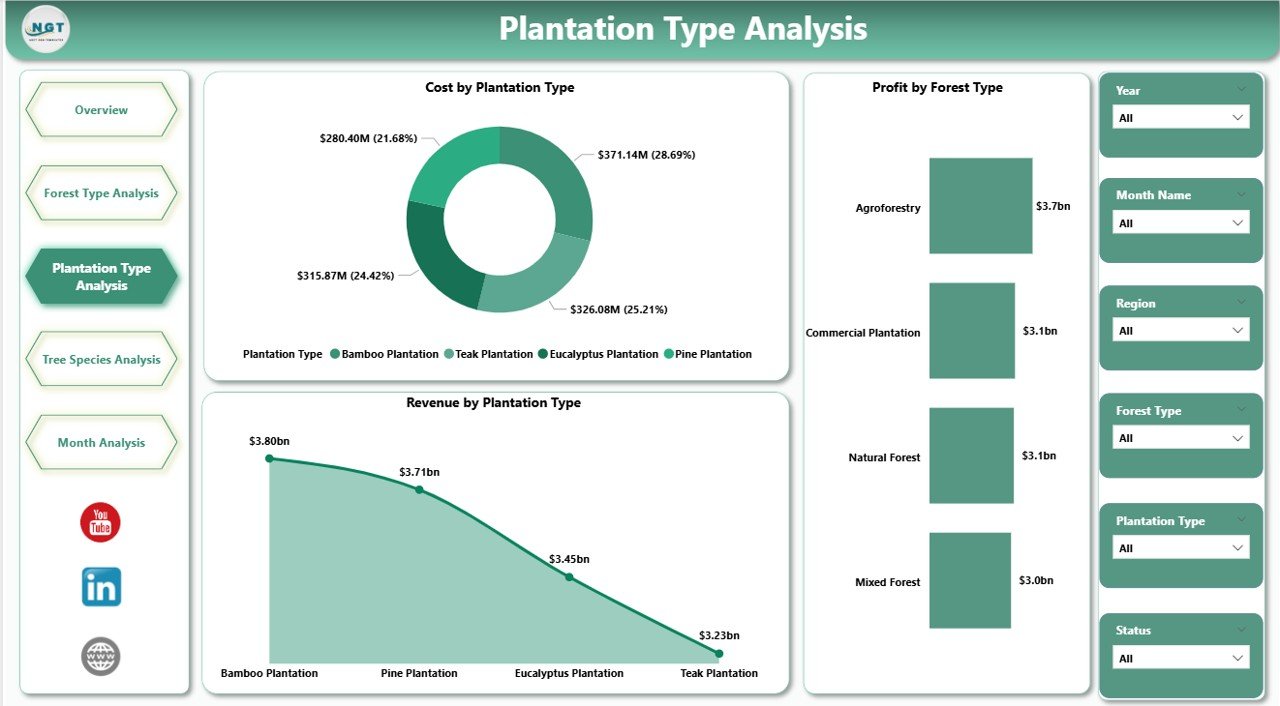
This page allows users to evaluate plantation strategies.
Charts Included
-
Cost by Plantation Type
-
Profit by Plantation Type
-
Revenue by Plantation Type
Why Does This Matter?
Because plantation planning impacts:
-
Future revenue
-
Soil health
-
Sustainability goals
-
Resource allocation
Therefore, companies can compare plantation models and focus on high-return strategies.
Click to Purchases Forestry Dashboard in Power BI
4️⃣ Tree Species Analysis – Understand Species Profitability
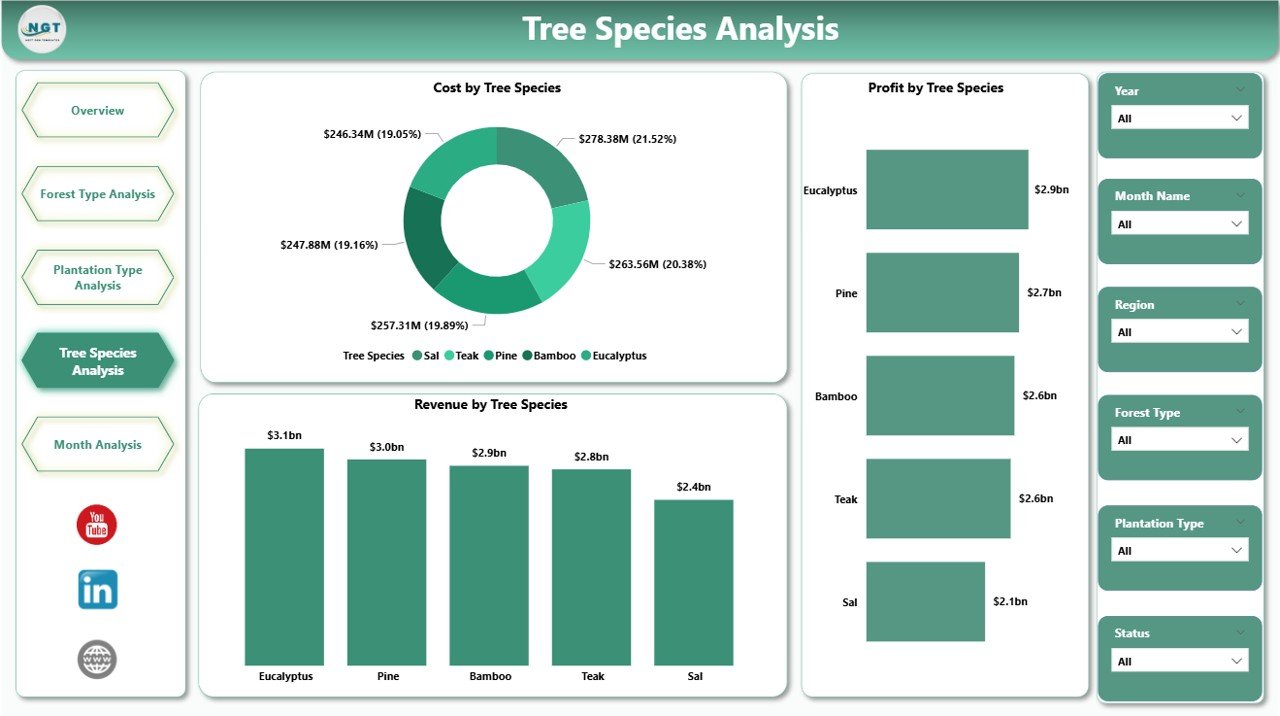
Some species grow faster. Others generate premium timber prices. Therefore, companies must track species performance closely.
Charts Included
-
Cost by Tree Species
-
Profit by Tree Species
-
Revenue by Tree Species
Insights You Can Extract
-
High-profit species
-
High-cost species
-
Best revenue contributors
-
Species requiring cost control
As a result, plantation planning becomes more strategic.
5️⃣ Month Analysis – Track Seasonal Performance
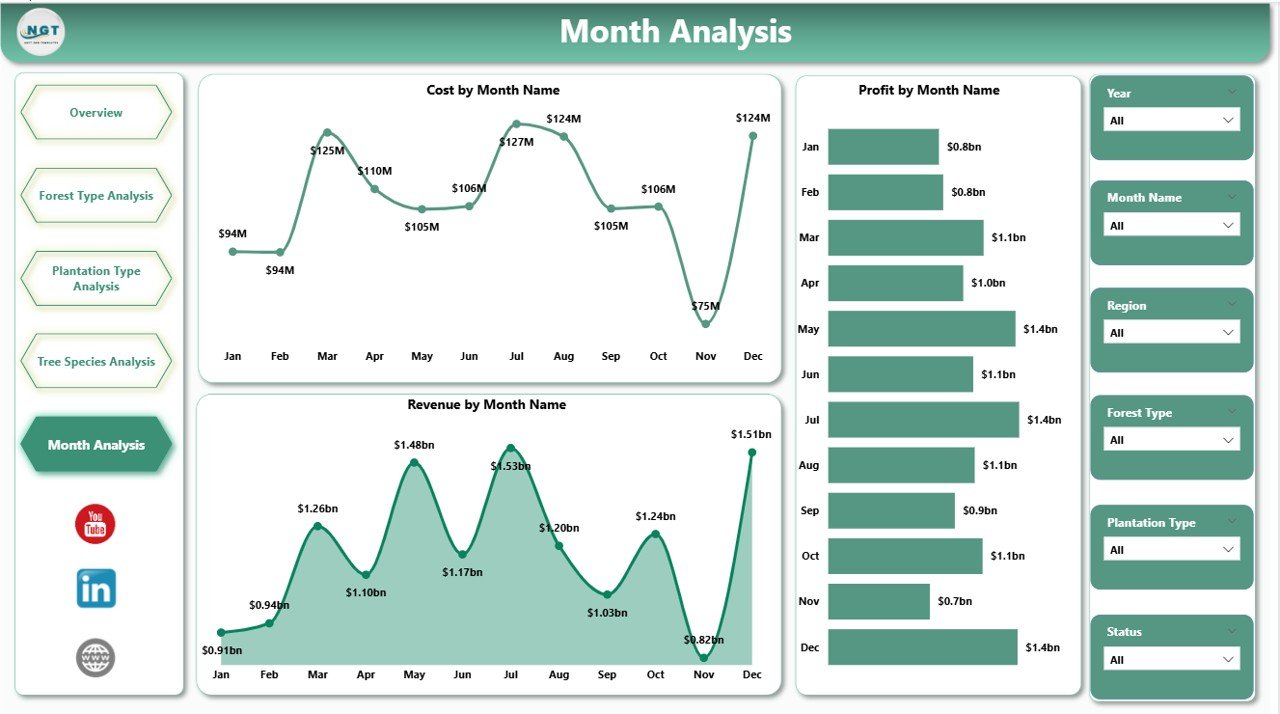
Rainfall, harvesting cycles, and market demand influence performance.
This final page helps managers track trends month by month.
Charts Included
-
Cost by Month
-
Profit by Month
-
Revenue by Month
Benefits of Monthly Analysis
-
Identify peak harvesting months
-
Track seasonal cost fluctuations
-
Predict revenue patterns
-
Improve budgeting
Therefore, businesses can plan ahead instead of reacting late.
Key KPIs Included in Forestry Dashboard in Power BI
Click to Purchases Forestry Dashboard in Power BI
The dashboard tracks several essential KPIs:
-
Harvested Forest Percentage
-
Total Forest Area
-
Revenue
-
Cost
-
Profit
-
Profit Margin %
-
Revenue by Forest Type
-
Revenue by Plantation Type
-
Revenue by Tree Species
-
Monthly Revenue Trend
Each KPI supports better decision-making.
Advantages of Forestry Dashboard in Power BI
A Forestry Dashboard in Power BI delivers powerful benefits.
1️⃣ Real-Time Insights
You can monitor performance instantly. Therefore, you avoid delays in decision-making.
2️⃣ Centralized Data
You store all forestry information in one structured system. Consequently, you eliminate confusion.
3️⃣ Improved Profitability Tracking
You identify high-margin forest types and species quickly.
4️⃣ Better Cost Control
You analyze cost by manager, region, plantation type, and species. Therefore, you reduce waste.
5️⃣ Stronger Strategic Planning
You use data trends to plan long-term plantation strategies.
6️⃣ Interactive Filtering
You apply slicers to filter by region, forest type, plantation type, or month. As a result, you gain deeper insights instantly.
Best Practices for the Forestry Dashboard in Power BI
To maximize results, follow these best practices.
1️⃣ Maintain Clean Data
Always use structured and validated data. Remove duplicates and errors regularly.
2️⃣ Update Data Monthly
Keep the dashboard current. Regular updates ensure accurate analysis.
3️⃣ Define Clear KPIs
Clearly define profit, cost, and harvesting metrics. Consistency improves accuracy.
4️⃣ Use Consistent Naming
Maintain uniform naming for forest types, plantation types, and species.
5️⃣ Review Insights Regularly
Conduct monthly review meetings using dashboard visuals.
6️⃣ Train Managers
Ensure forest managers understand how to interpret charts properly.
How Does the Forestry Dashboard Improve Sustainability?
Forestry businesses must balance profit and environmental responsibility.
This dashboard supports sustainability by:
-
Monitoring harvesting percentage
-
Tracking plantation types
-
Analyzing species distribution
-
Improving resource allocation
Therefore, companies can protect forests while improving revenue.
Who Can Use the Forestry Dashboard in Power BI?
This dashboard benefits:
-
Forestry companies
-
Timber producers
-
Plantation owners
-
Environmental analysts
-
Government forest departments
-
Sustainability managers
-
Financial analysts
Because the dashboard offers both financial and operational insights, multiple teams can use it.
How to Implement the Forestry Dashboard in Power BI?
Follow these steps:
-
Collect forestry data in Excel
-
Clean and validate the data
-
Import data into Power BI
-
Create relationships between tables
-
Build measures for cost, profit, and margin
-
Design interactive visuals
-
Add slicers for filtering
-
Publish dashboard for stakeholders
Once you implement the dashboard, review it monthly.
Conclusion
Forestry operations demand clarity, control, and precision. However, scattered spreadsheets cannot provide real-time visibility.
A Forestry Dashboard in Power BI transforms raw data into meaningful insights. It helps managers track harvesting performance, monitor cost, improve profit margins, and analyze forest types, plantation strategies, and tree species profitability.
Moreover, it supports sustainability and long-term planning.
Therefore, if you want to modernize forestry operations and drive data-based decisions, you should implement a Forestry Dashboard in Power BI today.
Frequently Asked Questions with Answers
1️⃣ What is a Forestry Dashboard in Power BI?
A Forestry Dashboard in Power BI is a data visualization tool that tracks forestry KPIs such as cost, revenue, profit, harvesting percentage, and plantation performance.
2️⃣ How does this dashboard improve forestry profitability?
It helps managers identify high-margin forest types and species while controlling costs effectively.
3️⃣ Can small forestry companies use this dashboard?
Yes. Small and medium forestry businesses can use it to track performance efficiently.
4️⃣ How often should I update the dashboard?
You should update it monthly. However, you can also update it weekly if required.
5️⃣ Does this dashboard support sustainability planning?
Yes. It tracks harvesting percentage, species distribution, and plantation types, which help improve sustainable management.
6️⃣ Can I customize the dashboard?
Yes. You can customize KPIs, charts, and filters based on your business needs.
Visit our YouTube channel to learn step-by-step video tutorials