Franchise Management Dashboard in Excel gives franchise owners, regional managers, finance teams, and consultants a 7-sheet reporting workbook for tracking revenue, royalty fees, net profit, franchise status, compliance, satisfaction, brand performance, regional performance, and ownership tier performance. The workbook includes 5 KPI cards, 18 analysis charts, multiple slicers, a structured Data sheet, and a Support sheet with pivot tables. For teams that already manage franchise records in Excel exports, this is a fast way to move from raw data to decision-ready reporting without subscribing to a full franchise SaaS platform.
Franchise operators often need quick answers: Which brand is most profitable? Which region has lower satisfaction? Which ownership tier has stronger active franchise percentage? Which category has better net profit? This dashboard is built around those questions and keeps the workflow simple: paste or update the Data sheet, click Refresh All, and review the dashboard pages.
Click here to purchase the Franchise Management Dashboard in Excel.
Key Features of Franchise Management Dashboard in Excel
- 7 Excel worksheet tabs covering Overview, Revenue Trend, Brand Analysis, Region Insights, Support Quality, Data, and Support.
- 5 high-level KPI cards for Total Revenue, Total Royalty Fee, Net Profit Value, Total Franchise, and Avg. Satisfaction Score.
- Multiple slicers for fast interactive filtering across the dashboard pages.
- 18 built-in analysis charts for revenue, operating cost, net profit, franchise count, compliance, satisfaction, risk, category, brand, ownership tier, and region analysis.
- Structured Data sheet where users add franchise records in the same format.
- Pivot-backed Support sheet that powers the charts and can stay hidden from end users.
- Excel-first workflow with no macros required. Update data, click Refresh All, and use slicers to explore.
Dashboard Pages Explanation
Page 1: Overview Page
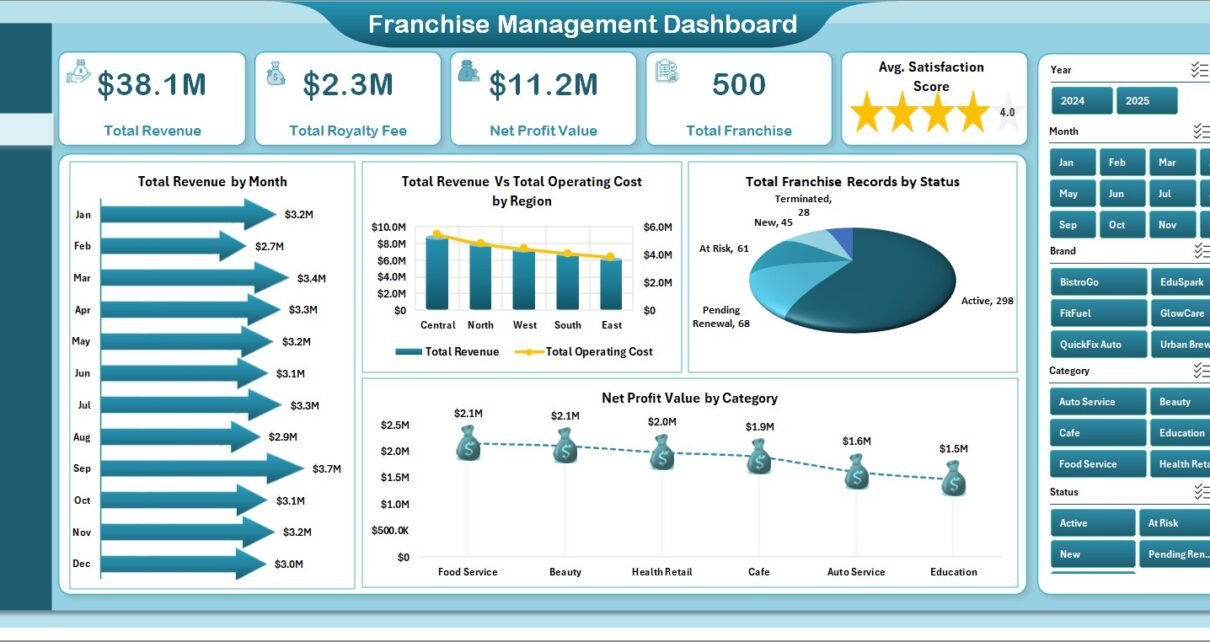
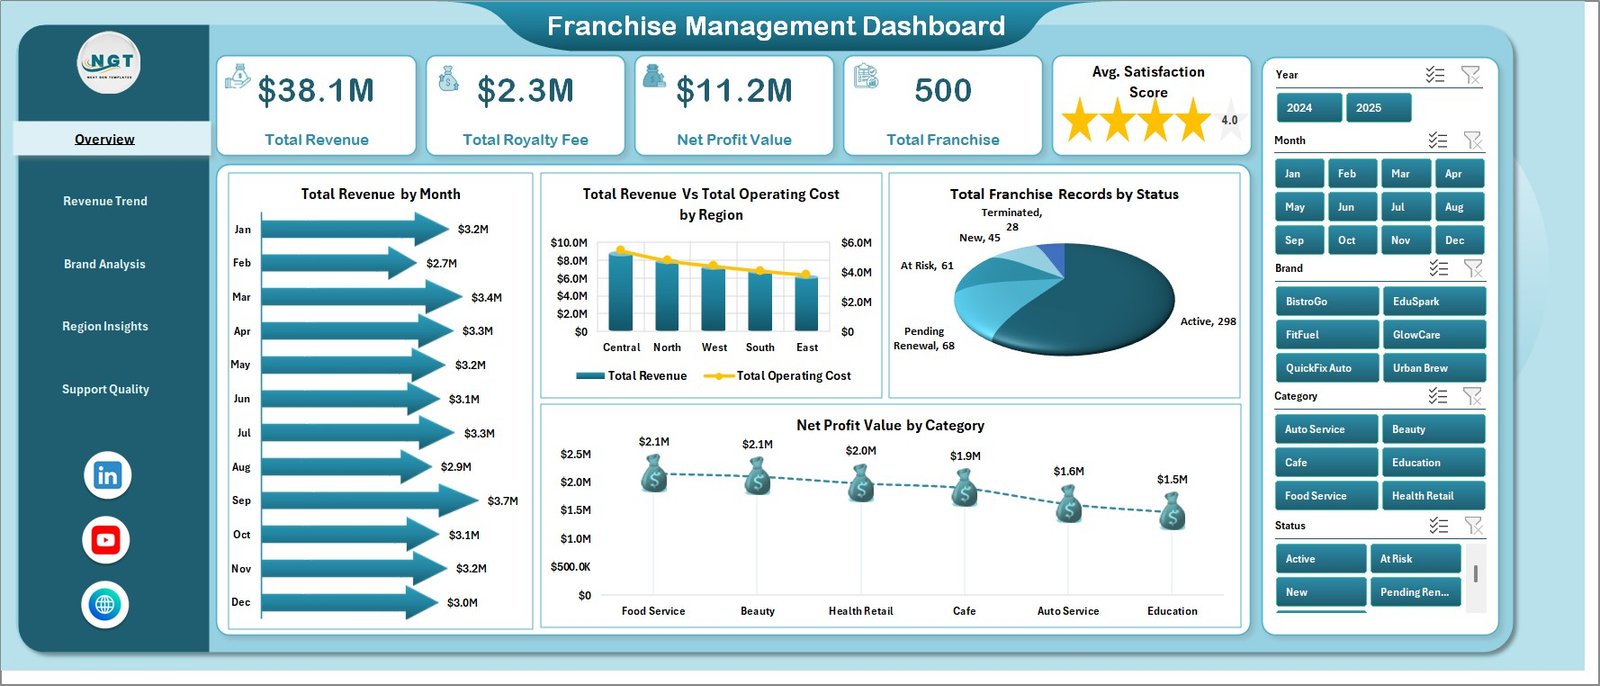
The Overview page is the executive summary. KPI cards show Total Revenue, Total Royalty Fee, Net Profit Value, Total Franchise, and Avg. Satisfaction Score. These cards give leadership a fast snapshot before they move into deeper pages.
Total Revenue by Month: This chart shows revenue movement across months. It helps users identify seasonality, strong growth periods, and months that need deeper review.
Total Revenue Vs Total Operating Cost by Region: This comparison shows whether each region is generating enough revenue against operating cost. It supports regional margin and cost-control discussion.
Total Franchise Records by Status: This chart breaks franchise records by status. It helps managers understand active, inactive, at-risk, or other operational groupings.
Net Profit Value by Category: This chart compares net profit by franchise category. It helps teams identify categories that contribute stronger bottom-line value.
Page 2: Revenue Trend
The Revenue Trend page focuses on time and brand performance. It includes Total Revenue by Quarter, Total Customer Visits by Month, Net Profit Value by Brand, and Total Revenue Vs Total Operating Cost by Brand.
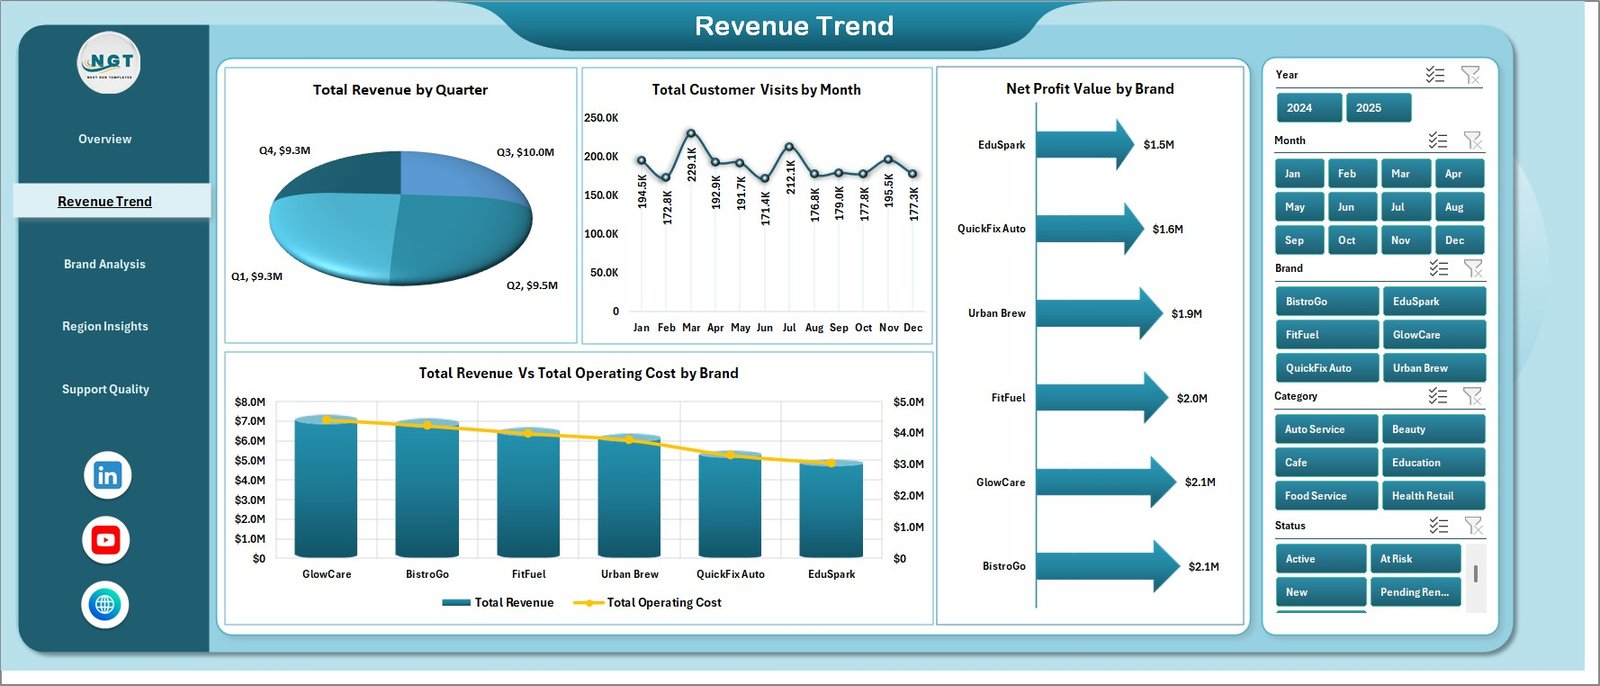
Total Revenue by Quarter makes quarterly performance visible for leadership reporting. Total Customer Visits by Month connects customer traffic with revenue patterns. Net Profit Value by Brand ranks brand profitability, while Total Revenue Vs Total Operating Cost by Brand shows which brands are producing healthier margins.
Page 3: Brand Analysis
The Brand Analysis page compares performance across category, ownership tier, region, and franchisee. It is useful for reviewing brand-level strategy and franchisee performance.
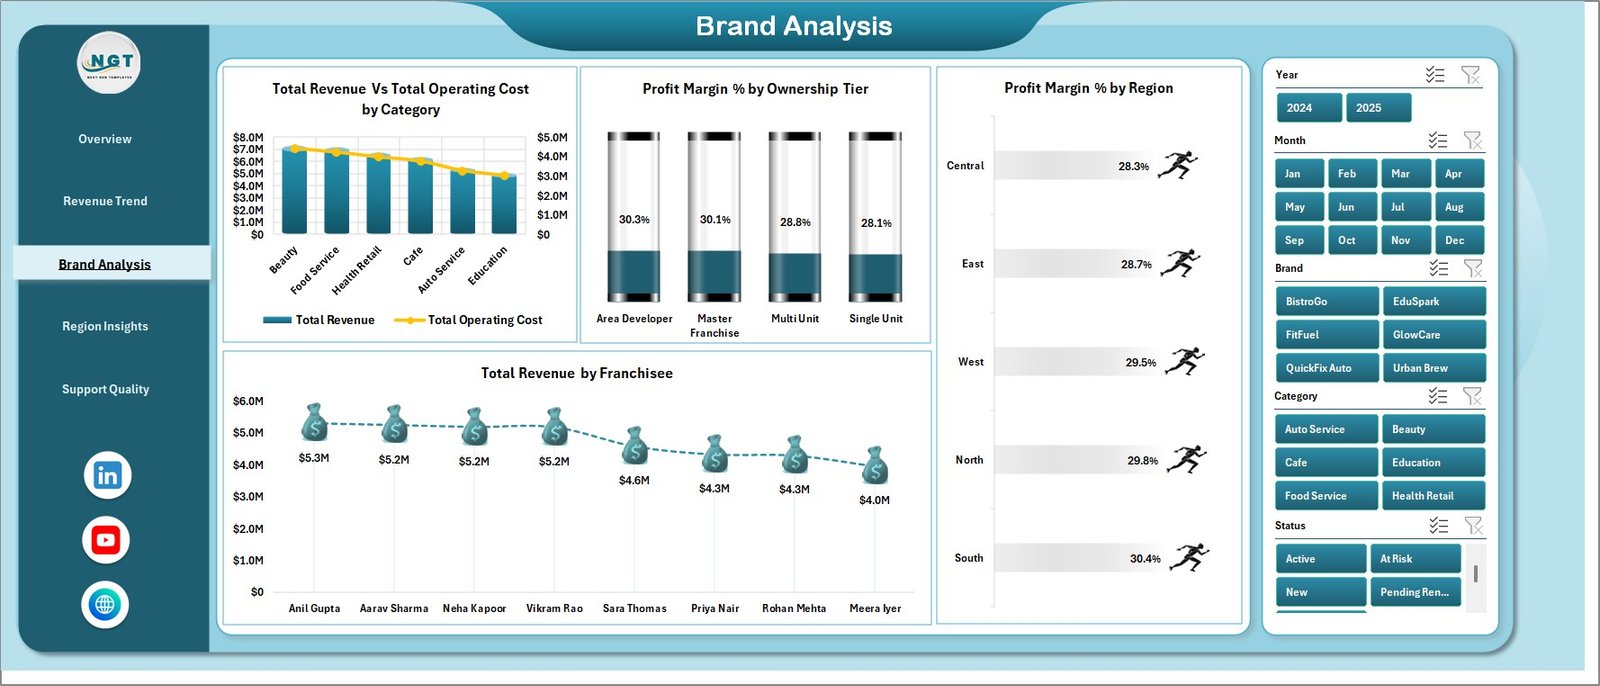
Total Revenue Vs Total Operating Cost by Category shows category-level financial balance. Profit Margin % by Ownership Tier compares profitability across ownership structures. Profit Margin % by Region reveals regional margin differences. Total Revenue by Franchisee helps rank individual franchisees for performance reviews.
Page 4: Region Insights
The Region Insights page shows how franchise performance changes across geographic areas. It is especially useful for regional managers and franchisors overseeing multiple territories.
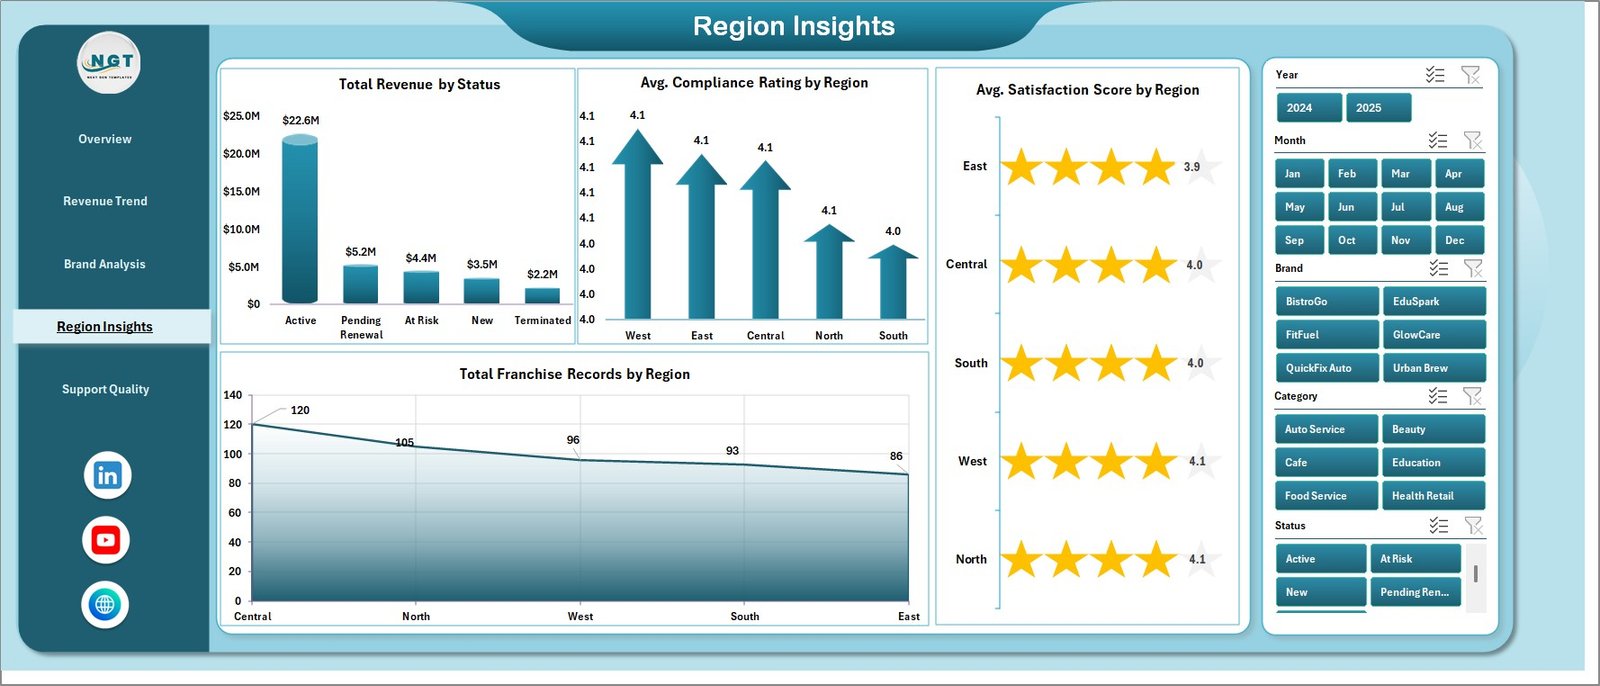
Total Revenue by Status connects revenue with franchise status. Avg. Compliance Rating by Region helps identify areas that may need operational follow-up. Avg. Satisfaction Score by Region reveals experience gaps by geography. Total Franchise Records by Region shows where the franchise network is concentrated.
Page 5: Support Quality
The Support Quality page focuses on operational risk and support prioritization. It includes At Risk Franchise Count by Brand, Profit Margin % by Category, and Active Franchise % by Ownership Tier.
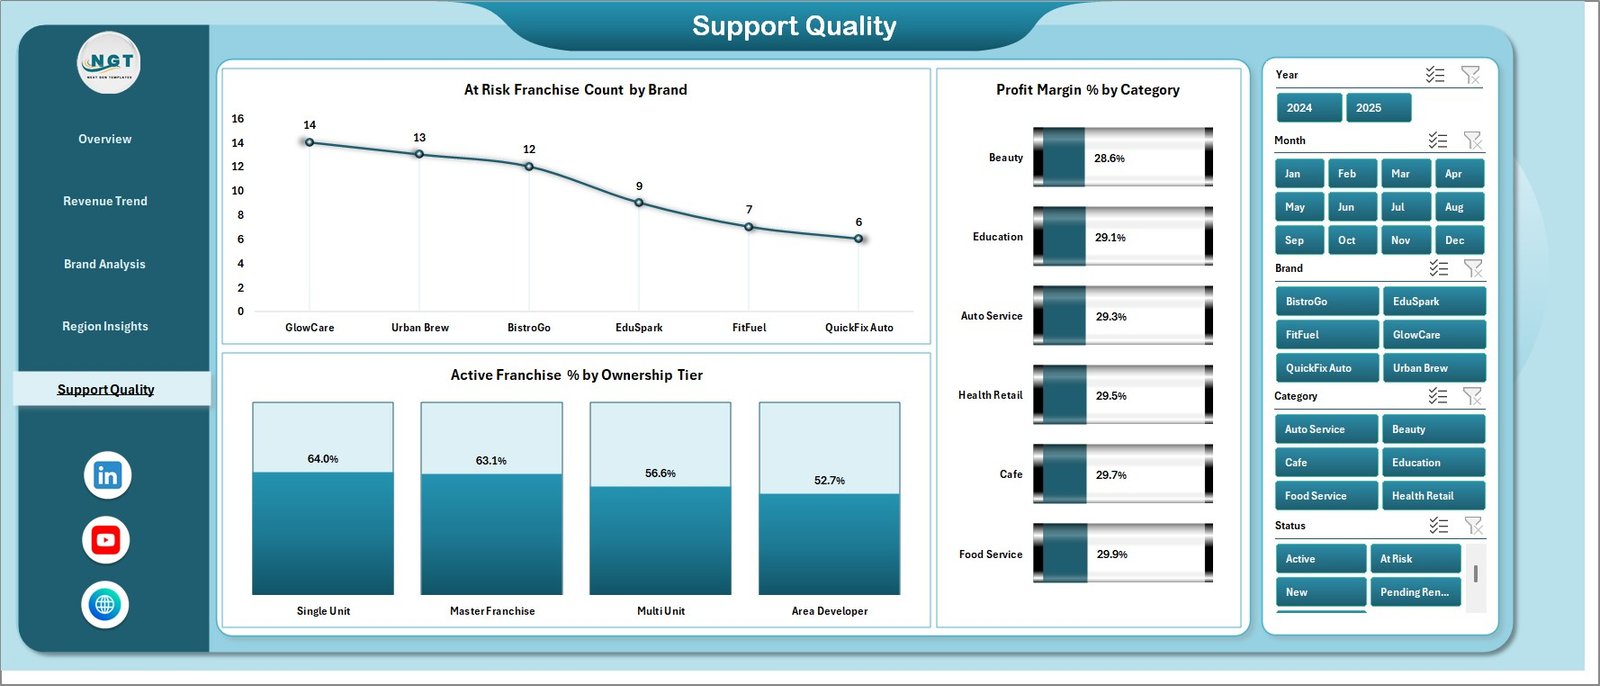
At Risk Franchise Count by Brand helps support teams prioritize the brands that need attention. Profit Margin % by Category supports margin improvement discussions. Active Franchise % by Ownership Tier shows whether ownership tiers differ in active operating health.
Data Sheet Tab
The Data sheet is where users enter or paste franchise records. Keep the same column structure so cards, charts, slicers, and pivot tables continue working correctly.

Support Sheet Tab
The Support sheet contains the pivot tables that power the dashboard. After updating the Data sheet, go to the Excel Ribbon, click Data, then Refresh All. You can keep this sheet hidden once the workbook is ready for users.

Franchise Management Dashboard in Excel vs. Google Sheets vs. Paid Franchise SaaS – Feature Comparison
| Feature | Franchise Management Dashboard in Excel | Google Sheets Alternative | Paid Franchise SaaS |
|---|---|---|---|
| Cost | $17.99 one-time | Low one-time or workspace cost | Monthly or annual subscription |
| Platform | Microsoft Excel | Google Sheets in browser | Vendor cloud platform |
| Setup time | Open workbook, replace data, refresh | Copy sheet and replace data | Implementation and onboarding |
| Real-time team collaboration | Possible with OneDrive or SharePoint | Native Google sharing | Usually included |
| Mobile access | Excel mobile or browser viewer | Google Sheets app | Vendor app or browser |
| Customizable fields | High for Excel users | High for spreadsheet users | Limited by vendor settings |
| Share with link | Possible with Microsoft 365 | Native sharing | Role-based user access |
| Year-1 cost at 5 users | $17.99 total | Low one-time or workspace cost | Often hundreds or thousands |
| Franchise analytics | Revenue, royalty, profit, region, brand, support, and quality reporting | Possible with setup | Depends on plan and module |
Who Should Use This Template
This template is built for franchisors, franchise owners, regional managers, operations leaders, finance analysts, and franchise consultants who need recurring reporting in Excel. It is useful when the team already exports data from POS, accounting, CRM, or operations systems and wants a clean Excel dashboard for monthly or quarterly review.
It is not the right fit if you need live POS API integration, contract management, franchisee onboarding workflows, payment processing, or enterprise role-based cloud access. In those cases, dedicated franchise management software may be needed alongside this reporting workbook.
Real-World Use Cases
Priya, Franchise Operations Manager: updates the Data sheet every month and uses the Overview page for leadership review. Her team can see total revenue, royalty fees, net profit, franchise count, and satisfaction in one place.
Marcus, Multi-Unit Franchise Owner: filters by region and brand to compare operating cost against revenue. The Brand Analysis page helps him decide which franchisees need coaching and which categories are producing better margins.
Elena, Franchise Consultant: uses the Region Insights and Support Quality pages during client engagements. She can quickly point out at-risk brands, lower compliance regions, and ownership tiers that need more attention.
Advantages of Franchise Management Dashboard in Excel
The biggest advantage is speed. Instead of building pivot tables, slicers, cards, and charts from scratch, users start with a complete workbook. The Data sheet keeps the input process structured, while the Support sheet handles the pivot tables behind the dashboard.
The second advantage is ownership. Because it is an Excel file, teams can edit labels, charts, colors, slicers, fields, and calculations as their reporting process changes. There is no vendor lock-in and no recurring per-user fee.
Opportunities for Improvement
This dashboard is not a live database system. Users still need to update the Data sheet manually or paste exported records from another system. For real-time reporting, teams may need Power BI, SQL, or a connected data model.
The workbook also depends on consistent column structure. If users rename headers or remove required fields, pivot tables and charts may need adjustment. The best practice is to change values inside the table but keep the original columns stable.
Best Practices
Keep the Data sheet column layout unchanged. Add new records below the existing table or replace sample rows with your own data, then use Refresh All from the Data tab.
Use slicers during meetings instead of creating multiple duplicate files. One workbook can support brand-level, region-level, ownership-tier, and status-based discussion.
Keep a backup copy before major customization. This makes it easy to return to the original dashboard if a pivot table, slicer, or chart is accidentally changed.
For official Excel refresh guidance, Microsoft explains the Refresh All workflow in its documentation: Refresh an external data connection in Excel.
Explore Relevant Templates
- Franchise Performance Dashboard in Excel
- Franchise Performance Dashboard in Power BI
- Franchise Management KPI Dashboard in Excel
- Browse Excel Dashboard Templates
Frequently Asked Questions
What pages are included in the Franchise Management Dashboard in Excel?
The workbook includes Overview, Revenue Trend, Brand Analysis, Region Insights, Support Quality, Data, and Support sheets.
What KPI cards are shown on the Overview page?
The Overview page shows Total Revenue, Total Royalty Fee, Net Profit Value, Total Franchise, and Avg. Satisfaction Score.
How do I update the dashboard with my own data?
Replace the sample records in the Data sheet, keep the same column structure, then click Refresh All from the Excel Data tab.
Can I hide the Support sheet?
Yes. The Support sheet contains pivot tables used by the dashboard and can stay hidden after setup.
Does this replace franchise management software?
No. It is a reporting dashboard for prepared data, not a CRM, POS, contract management, or franchisee onboarding platform.
Can I customize the dashboard?
Yes. Excel users can customize charts, slicers, colors, labels, fields, and pivot tables.
About the Author
Built by PK – Microsoft Certified Professional with 15+ years of Excel, Google Sheets, and Power BI experience. Founder of NextGenTemplates, reaching 300K+ subscribers across YouTube channels. Every template is hand-built and tested before release.
Conclusion
The Franchise Management Dashboard in Excel turns franchise records into a practical reporting workbook for revenue, royalty fees, net profit, brand analysis, region insights, support quality, and satisfaction tracking. It is a strong fit for teams that want Excel-based reporting without a monthly subscription.
Click here to purchase the Franchise Management Dashboard in Excel.
Visit the YouTube channel for step-by-step Excel dashboard tutorials: YouTube.com/@PKAnExcelExpert.
Last updated: June 15, 2026.