these efficiently requires more than just spreadsheets — it demands data-driven insights. That’s where the Freelancer KPI Dashboard in Power BI becomes a game-changer.
This comprehensive, ready-to-use dashboard enables freelancers to monitor their business performance, identify improvement areas, and make smarter decisions — all through visual, interactive analytics built on Microsoft Power BI.
In this article, we’ll explore everything about the Freelancer KPI Dashboard — its structure, features, advantages, best practices, and how it can transform the way you manage your freelance business.
Click to Purchases Freelancer KPI Dashboard in Power BI
What Is a Freelancer KPI Dashboard in Power BI?
A Freelancer KPI Dashboard in Power BI is a digital performance-monitoring tool that helps freelancers track their business metrics and project efficiency in real time. It connects to a simple Excel data source and transforms raw numbers into interactive visuals — enabling freelancers to focus on what truly matters: growth, client satisfaction, and profitability.
Using Power BI, freelancers can visualize their monthly targets, progress toward goals, and year-over-year comparisons through charts, icons, and slicers. With just a few clicks, you can analyze whether your performance is improving or declining, and take timely corrective actions.
Structure of the Freelancer KPI Dashboard
The Freelancer KPI Dashboard consists of three main pages in the Power BI Desktop file, each designed to deliver a specific level of insight.
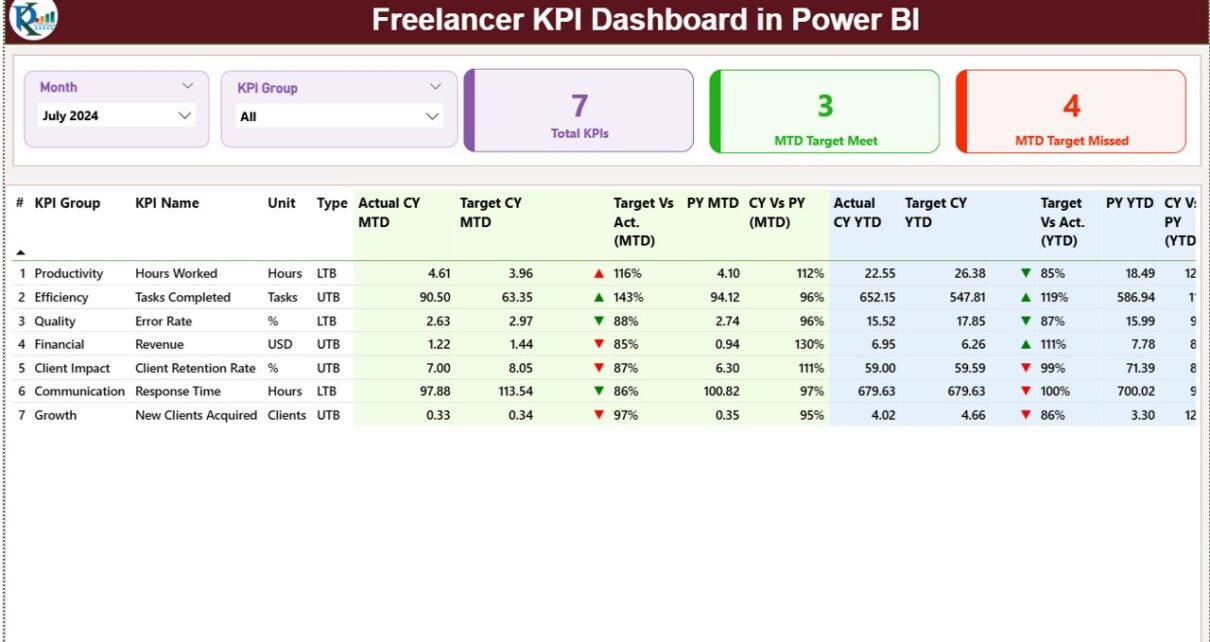
1️⃣ Summary Page – The Central Command Hub
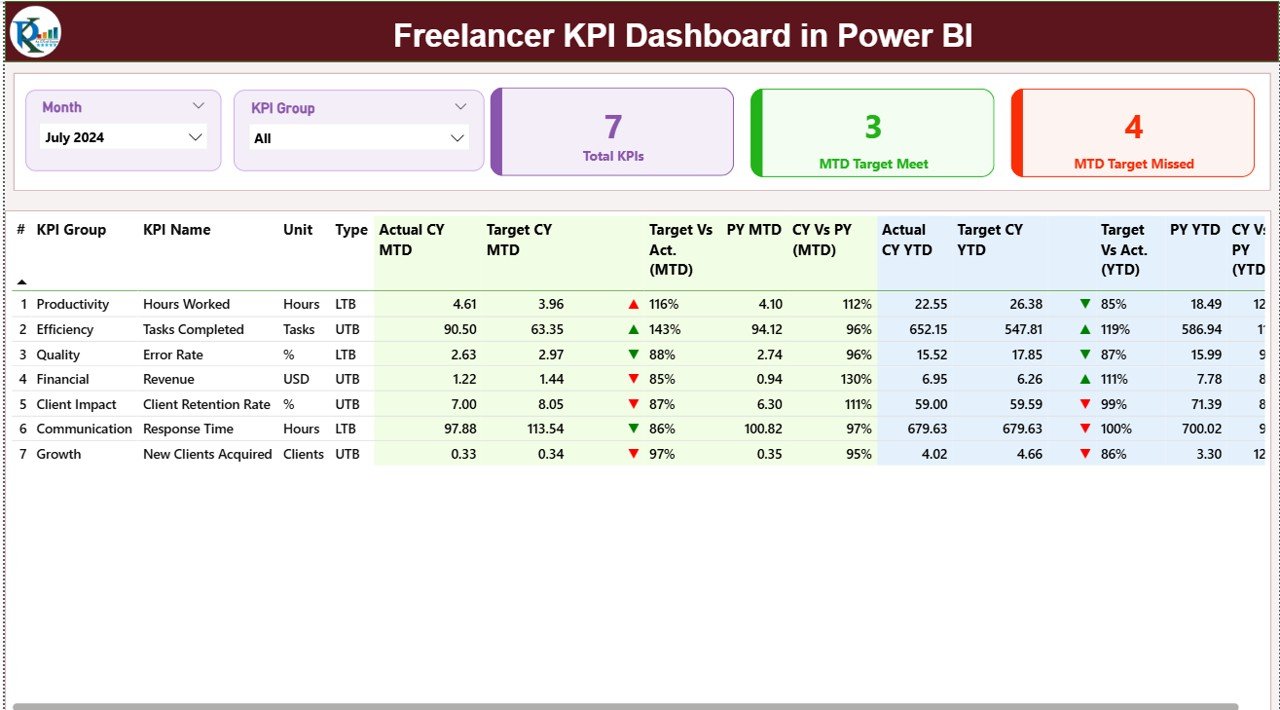
The Summary Page serves as the main performance snapshot of your freelance business. It combines KPIs, charts, and slicers into one clean, interactive view.
Here’s what you’ll find on this page:
-
Month and KPI Group Slicers: Quickly filter data by month or KPI category to focus on specific performance areas.
Performance Cards:
- Total KPIs Count – Displays how many KPIs are being tracked.
- MTD Target Met Count – Shows how many KPIs met the target for the month-to-date.
- MTD Target Missed Count – Highlights the KPIs that didn’t meet their targets.
-
Detailed KPI Table:
This table provides a comprehensive performance breakdown for each KPI: - KPI Number: The unique identifier for each KPI.
- KPI Group: Categorizes metrics (e.g., Finance, Projects, Clients, Productivity).
- KPI Name: The specific metric being tracked, such as “Client Satisfaction Score” or “Revenue Growth.”
- Unit: Defines how the KPI is measured (%, $, hours, etc.).
- Type: Indicates if the KPI is LTB (Lower The Better) or UTB (Upper The Better).
- Actual CY MTD / Target CY MTD: Displays actual versus target values for the current month.
- MTD Icon: Uses colored icons (▲ green or ▼ red) to show performance status.
- Target vs Actual (MTD %): Compares performance to monthly targets.
- PY MTD / CY vs PY (MTD %): Tracks month-over-month improvement versus last year.
- Actual CY YTD / Target CY YTD: Tracks year-to-date achievements against targets.
- YTD Icon: Similar to MTD but for long-term progress.
- Target vs Actual (YTD %): Displays YTD performance ratio.
- PY YTD / CY vs PY (YTD %): Year-over-year comparison of long-term trends.
This page enables freelancers to evaluate whether they are meeting project, income, and efficiency targets — all on one screen.
KPI Trend Page – Visualizing Performance Over Time
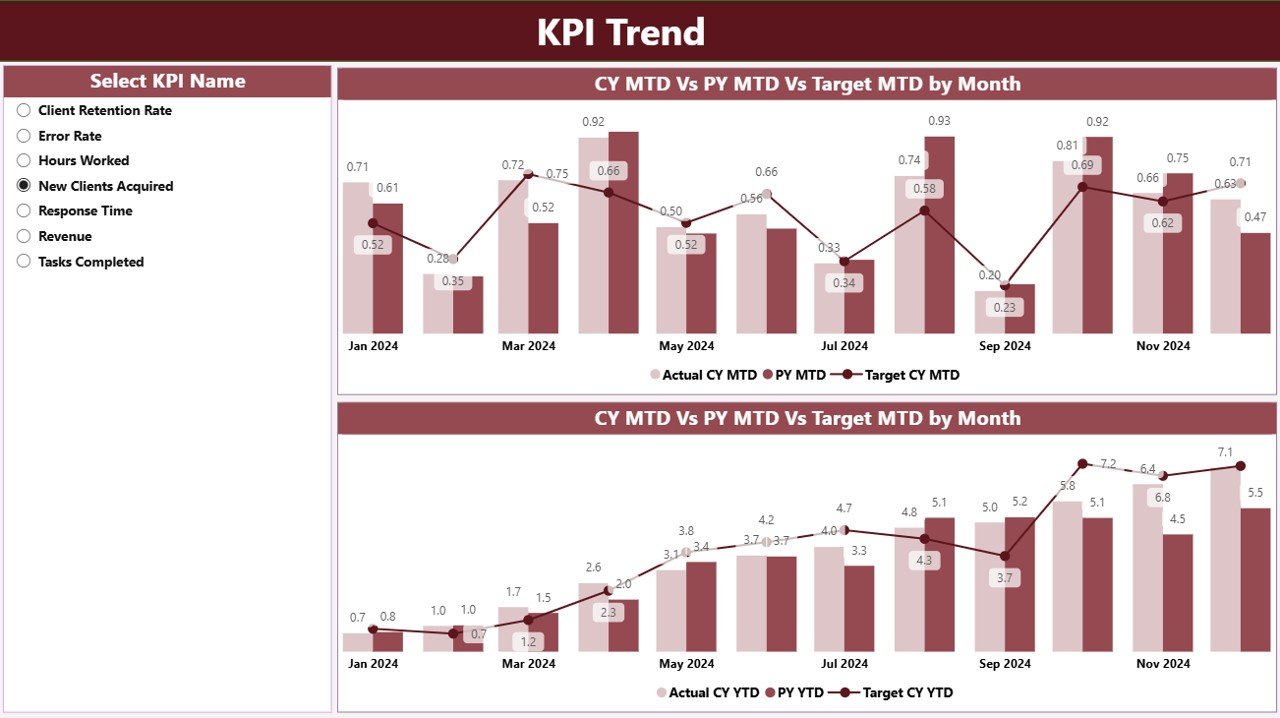
The KPI Trend Page transforms raw data into compelling visuals that reveal performance trends month-by-month and year-over-year.
Here’s what this page includes:
-
Combo Charts: Two charts compare Current Year Actuals, Previous Year Actuals, and Targets for both MTD and YTD.
-
KPI Name Slicer: Allows users to select a specific KPI and instantly view its performance trends.
-
Interactive Insights: Visual charts help freelancers pinpoint seasonal performance dips, rising trends, or deviations from targets.
For example, if your “Billable Hours Utilization” drops below the target during certain months, you can identify patterns and optimize scheduling or client workload distribution accordingly.
Click to Purchases Freelancer KPI Dashboard in Power BI
3️⃣ KPI Definition Page – Understanding the Metrics
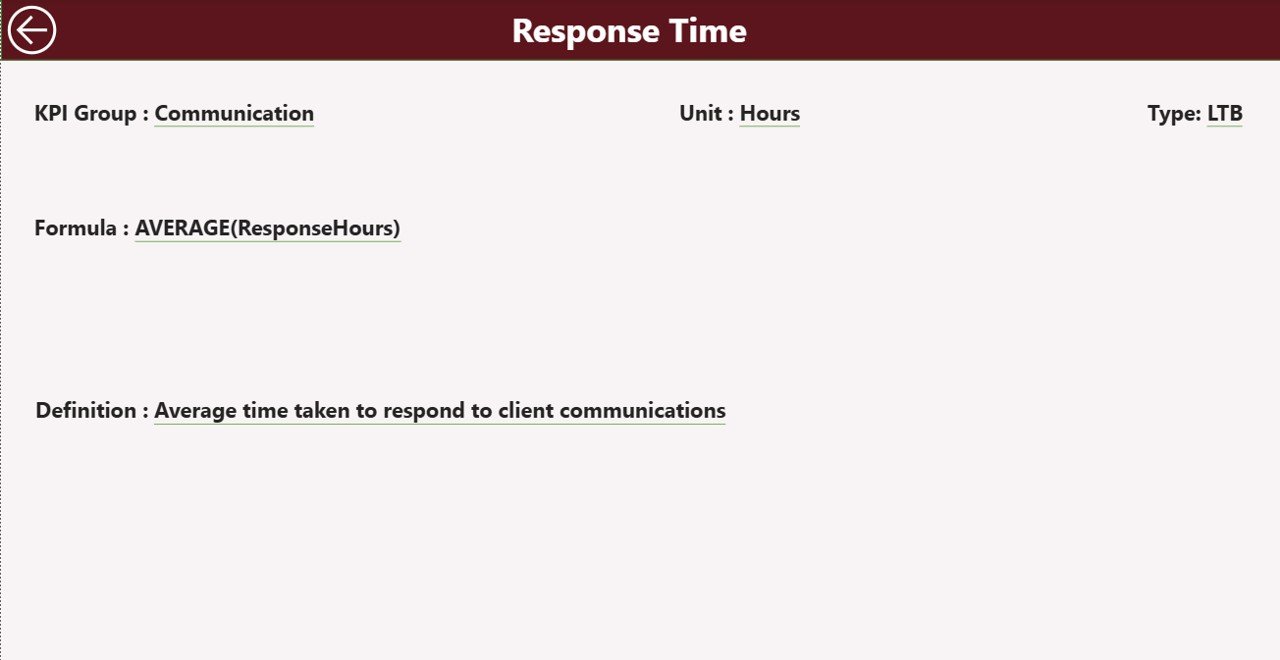
The KPI Definition Page acts as a drill-through reference sheet. It contains detailed information about each KPI’s formula, definition, and type.
This page is hidden by default, but you can access it through a drill-through from the Summary Page. Once you’re there, you’ll see:
-
KPI Number and Group
-
KPI Name
-
Unit of Measurement
-
Formula Used
-
Definition
-
Type (LTB or UTB)
This ensures every metric you track has a clear definition, promoting consistency and transparency in reporting. You can click the Back Button at the top-left corner to return to the Summary Page easily.
📊 Excel Data Structure for the Freelancer KPI Dashboard
The Freelancer KPI Dashboard pulls its data from an Excel workbook, which contains three core sheets:
1️⃣ Input_Actual Sheet
This sheet captures actual performance data.
Columns include:
-
KPI Name
-
Month (use the first date of the month)
-
MTD (Month-to-Date Actuals)
-
YTD (Year-to-Date Actuals)
Freelancers update this sheet monthly with real values.
2️⃣ Input_Target Sheet
This sheet stores target data for each KPI.
Columns include:
-
KPI Name
-
Month
-
MTD Target
-
YTD Target
This helps Power BI calculate variance between actuals and targets to display green/red performance indicators.
3️⃣ KPI Definition Sheet
This sheet contains metadata about every KPI:
-
KPI Number
-
KPI Group
-
KPI Name
-
Unit
-
Formula
-
Definition
-
Type (LTB or UTB)
This ensures every KPI has context and clarity.
Why Freelancers Need a KPI Dashboard
Freelancers often manage multiple projects simultaneously — and without structured performance tracking, they can lose sight of long-term goals.
Here’s why this dashboard is essential:
✅ Better Time Management: Track billable vs. non-billable hours.
💰 Financial Clarity: Analyze income trends, project profitability, and revenue targets.
📈 Productivity Insights: Identify efficiency improvements month over month.
🤝 Client Relationship Tracking: Measure satisfaction scores and client retention.
📅 Consistent Growth: Compare YTD and PY data to maintain steady progress.
In short, this dashboard converts freelance chaos into measurable, actionable insights.
Advantages of Freelancer KPI Dashboard in Power BI
Click to Purchases Freelancer KPI Dashboard in Power BI
Let’s explore why this dashboard is a must-have for freelancers:
1️⃣ Real-Time Visibility
Freelancers can track performance metrics instantly, avoiding delays that come with manual reporting.
2️⃣ Data-Driven Decisions
Power BI visuals make it easy to identify profitable clients, successful projects, or underperforming areas.
3️⃣ Improved Efficiency
Spot inefficiencies in project timelines or client communication and take corrective actions.
4️⃣ Better Financial Planning
Monitor income fluctuations and adjust budgets or project pricing proactively.
5️⃣ Seamless Comparison
Compare current performance with previous years to ensure consistent business growth.
6️⃣ Professional Reporting
Present visual reports to clients to demonstrate accountability and performance transparency.
🧠 How to Use the Freelancer KPI Dashboard Effectively
Follow these steps to maximize your results:
-
Update Excel Sheets Regularly: Input accurate actual and target data each month.
-
Refresh Power BI Data: Use the “Refresh” button in Power BI Desktop to update visuals automatically.
-
Use Filters Wisely: Analyze by month, KPI group, or specific KPI.
-
Interpret Icons: Green arrows (▲) show improvement; red arrows (▼) indicate underperformance.
-
Drill-Through When Needed: View detailed KPI definitions for better understanding.
-
Export Reports: Share interactive or PDF summaries with clients or stakeholders.
🏆 Best Practices for the Freelancer KPI Dashboard in Power BI
To get the most value out of your dashboard, follow these best practices:
💾 Maintain Data Accuracy: Ensure your Excel data is up-to-date and free of duplicates.
📈 Set Realistic Targets: Avoid setting unachievable KPIs; keep goals measurable and attainable.
📊 Use Visual Consistency: Maintain uniform color coding for easy interpretation (e.g., green for good, red for bad).
🔁 Monitor Trends Monthly: Don’t wait for year-end to assess progress; review monthly.
📧 Automate Updates: Use Power BI’s scheduled refresh feature if you upload data to OneDrive or SharePoint.
🎯 Focus on Actionable Insights: Don’t just monitor metrics — take decisions based on insights.
🧩 Customize KPIs: Adjust metrics according to your freelancing niche (design, writing, marketing, etc.).
🔍 Opportunities for Improvement
While the Freelancer KPI Dashboard is robust, freelancers can enhance it further:
-
Integrate Client Feedback Data: Merge client ratings or testimonials for holistic analysis.
-
Add Income Forecasting Charts: Predict next quarter’s earnings using past data trends.
-
Include Time Tracker Integration: Sync with tools like Toggl or Clockify.
-
Automate Data Entry: Use Excel forms or Google Forms to simplify input.
-
Build a Mobile-Responsive View: Use Power BI mobile layouts for performance tracking on the go.
Example Use Case
Imagine a freelance graphic designer tracking the following KPIs:
-
Monthly revenue
-
Project turnaround time
-
Client satisfaction rating
-
Number of new clients
-
Revision requests per project
After using the Freelancer KPI Dashboard for three months, they realize that project turnaround time is increasing. The dashboard’s red arrow alert prompts them to streamline their workflow, improving efficiency by 20% in the next quarter.
This simple, visual insight turns data into action — the essence of Power BI analytics.
Conclusion
The Freelancer KPI Dashboard in Power BI is more than a reporting tool — it’s a strategic partner for your freelance journey. It consolidates financial, operational, and client data into a single interface, empowering you to analyze performance, set goals, and make informed decisions.
By implementing this dashboard, freelancers gain control over their business, improve productivity, and showcase their professionalism through visual performance reports.
Whether you are managing ten clients or two dozen projects, this dashboard ensures you stay on top of every KPI — helping you focus on what truly matters: delivering value and growing your freelance career.
Frequently Asked Questions (FAQs)
1️⃣ What is the main purpose of a Freelancer KPI Dashboard in Power BI?
It helps freelancers track performance metrics such as income, productivity, project success, and client satisfaction — all in one interactive dashboard.
2️⃣ Can I use this dashboard without Power BI Pro?
Yes. You can use it with the free version of Power BI Desktop. However, for online sharing and auto-refresh, Power BI Pro is recommended.
3️⃣ How often should I update the data?
Ideally, update the Excel data monthly to keep your insights current and accurate.
4️⃣ Can I add new KPIs or modify existing ones?
Absolutely. You can customize the KPI Definition sheet in Excel and refresh the data model in Power BI to reflect new metrics.
5️⃣ Is this dashboard suitable for all freelancers?
Yes. Whether you are a content writer, designer, developer, consultant, or marketer, you can adapt it to your niche easily.
6️⃣ How can I download the Freelancer KPI Dashboard in Power BI?
You can download the ready-to-use dashboard from NextGenTemplates.com and start analyzing your performance instantly.
Visit our YouTube channel to learn step-by-step video tutorials