Freight management is not simple anymore. Fuel prices change often. Delivery timelines shift quickly. Customer expectations grow every day. Therefore, logistics companies must track performance closely.
However, many freight businesses still depend on scattered spreadsheets. As a result, they miss delays. They overlook rising costs. They fail to control on-time performance.
So, how can you monitor freight cost, delivery accuracy, carrier performance, transit time, and operational efficiency in one structured system?
The answer is clear.
You need a Freight Management KPI Scorecard in Excel.
In this detailed guide, you will learn:
-
What a Freight Management KPI Scorecard in Excel is
-
Why logistics companies need it
-
Detailed explanation of all 4 worksheets
-
Key KPIs to include
-
Advantages of Freight Management KPI Scorecard in Excel
-
Best Practices for the Freight Management KPI Scorecard
-
Frequently Asked Questions with Answers
Let’s explore everything step by step.
Click to Purchases Freight Management KPI Scorecard in Excel
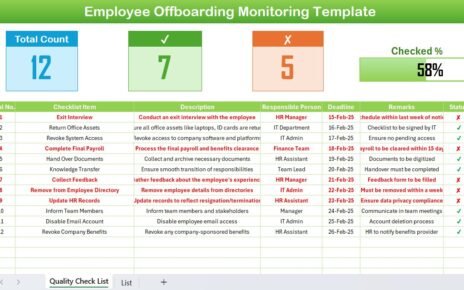
What Is a Freight Management KPI Scorecard in Excel?
A Freight Management KPI Scorecard in Excel is a ready-to-use performance tracking template designed specifically for logistics and freight operations.
It helps you:
-
Track shipment performance
-
Monitor freight costs
-
Compare actual vs target values
-
Analyze Month-to-Date (MTD) and Year-to-Date (YTD) performance
-
Identify delays and inefficiencies
-
Improve carrier and route management
Instead of reviewing freight data randomly, you follow a structured KPI system. Therefore, you gain clarity. Moreover, you improve decision-making.
Why Do Freight Companies Need a KPI Scorecard?
Freight operations involve multiple moving parts. Trucks move daily. Shipments cross states. Costs fluctuate weekly. Therefore, performance tracking becomes essential.
Without KPI monitoring:
-
Costs increase silently
-
Delivery delays go unnoticed
-
Customer complaints rise
-
Profit margins shrink
However, when you use a Freight Management KPI Scorecard in Excel:
-
You monitor performance daily
-
You compare targets vs actual values
-
You detect issues early
-
You improve operational efficiency
As a result, you stay competitive in a demanding logistics market.
Click to Purchases Freight Management KPI Scorecard in Excel
What Are the Key Features of Freight Management KPI Scorecard in Excel?
This ready-to-use template contains 4 structured worksheets. Each worksheet plays a specific role in performance management.
Let’s understand them in detail.
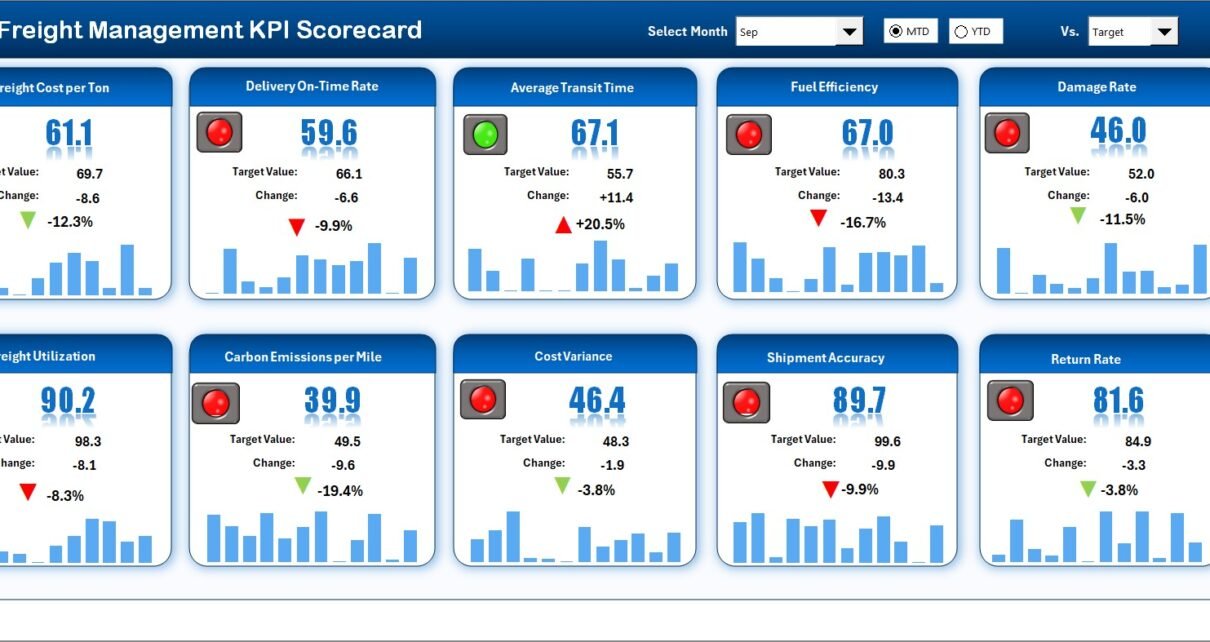
1️⃣ Scorecard Sheet – The Main Performance Dashboard
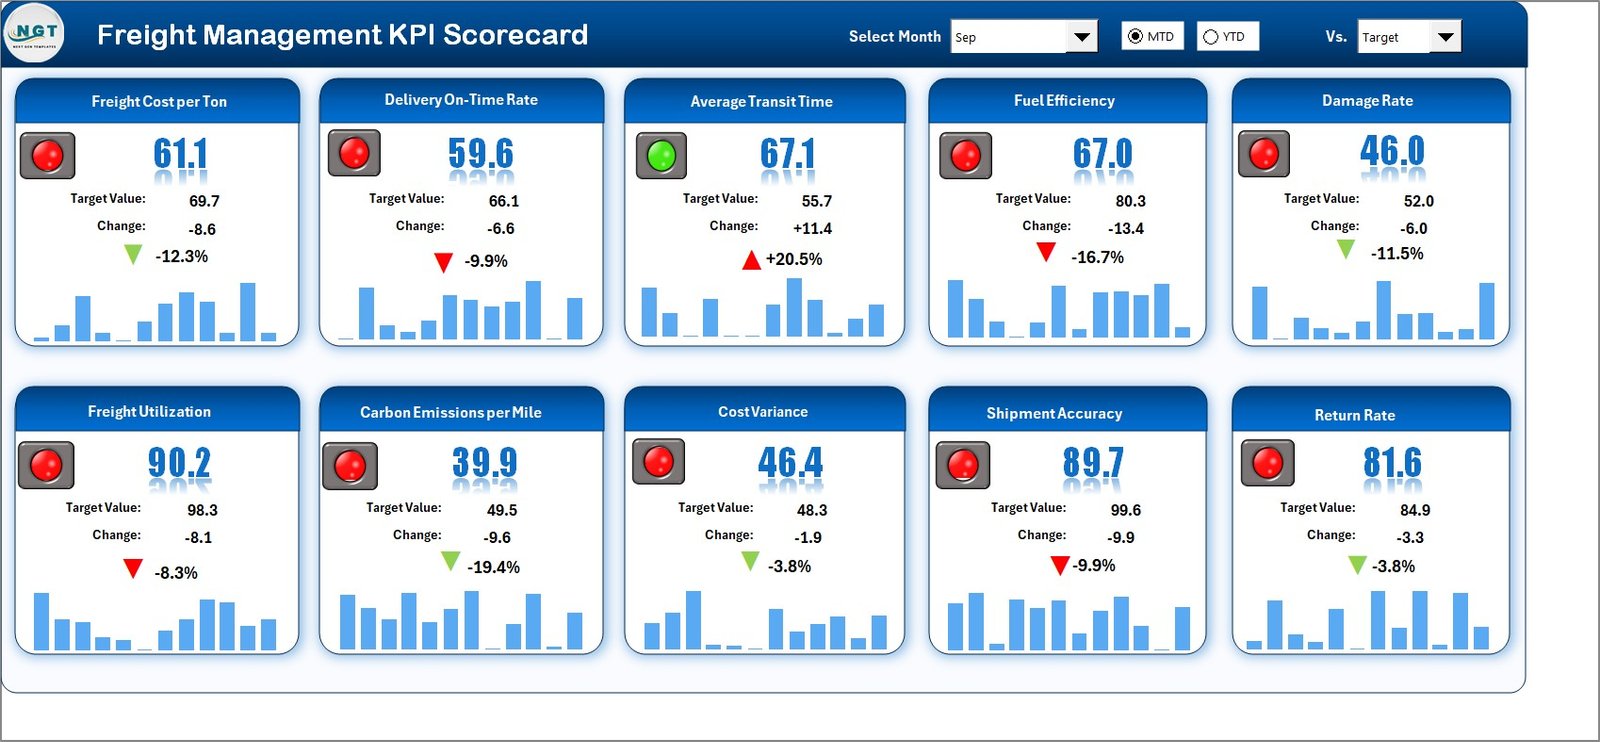
The Scorecard Sheet acts as the main interface. Here, you view all KPI performance in one place.
Key Features of the Scorecard Sheet
✅ Dropdown Menus for Flexible Analysis
You can:
-
Select the Month
-
Choose MTD (Month-to-Date)
-
Choose YTD (Year-to-Date)
As soon as you change the selection, the numbers update automatically. Therefore, you analyze performance instantly.
✅ Actual vs Target Comparison
For each KPI, the sheet shows:
-
Actual value
-
Target value
-
Previous Year value
-
Target vs Actual difference
-
PY vs Actual difference
This structure helps you measure progress clearly.
✅ Visual Indicators for Quick Insights
The scorecard uses:
-
Color-coded indicators
-
Conditional formatting
-
Up and down arrows
Therefore, you immediately see whether performance improves or declines.
✅ Comprehensive KPI Overview
The sheet displays:
-
KPI Name
-
KPI Group
-
Unit of measurement
-
MTD performance
-
YTD performance
As a result, managers get a complete overview without opening multiple sheets.
Click to Purchases Freight Management KPI Scorecard in Excel
2️⃣ KPI Trend Sheet – Performance Over Time
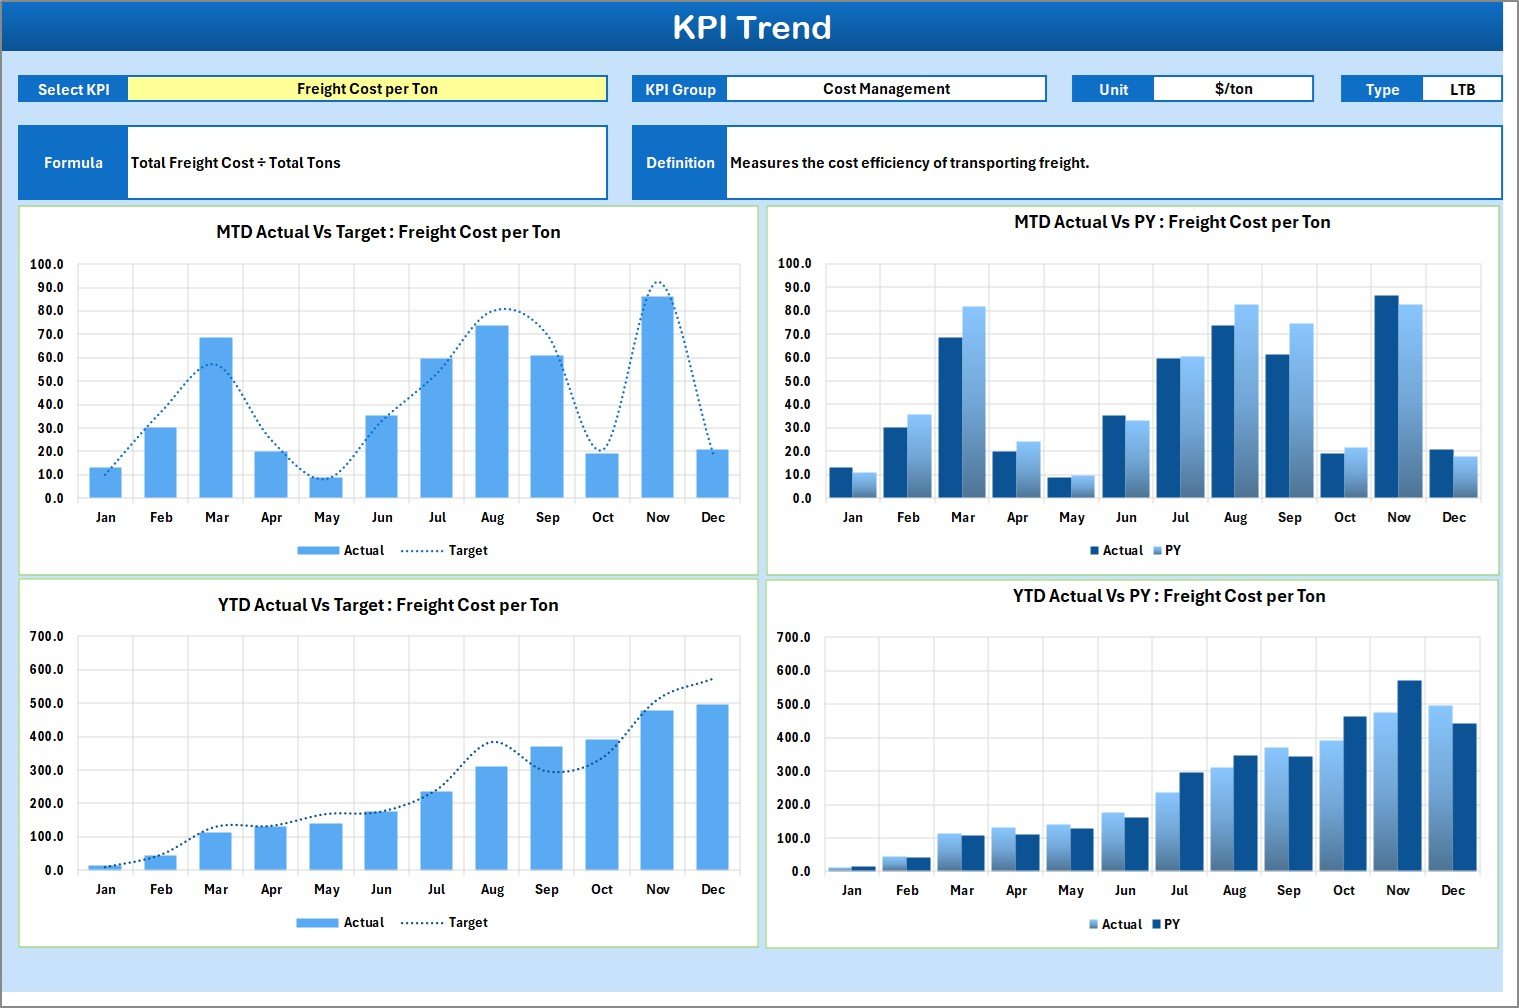
The KPI Trend Sheet helps you analyze trends visually.
How Does It Work?
On cell C3, you select the KPI name from a dropdown list. Immediately, the sheet displays:
-
KPI Group
-
Unit of KPI
-
Type of KPI (Lower the Better / Upper the Better)
-
KPI Formula
-
KPI Definition
Therefore, you understand the KPI before analyzing its performance.
📊 Trend Charts Included
The sheet shows:
-
MTD Trend Chart (Actual vs Target vs Previous Year)
-
YTD Trend Chart (Actual vs Target vs Previous Year)
Because of visual charts, you detect patterns easily. Moreover, you identify seasonal fluctuations quickly.
3️⃣ Input Data Sheet – Where You Enter All KPI Data
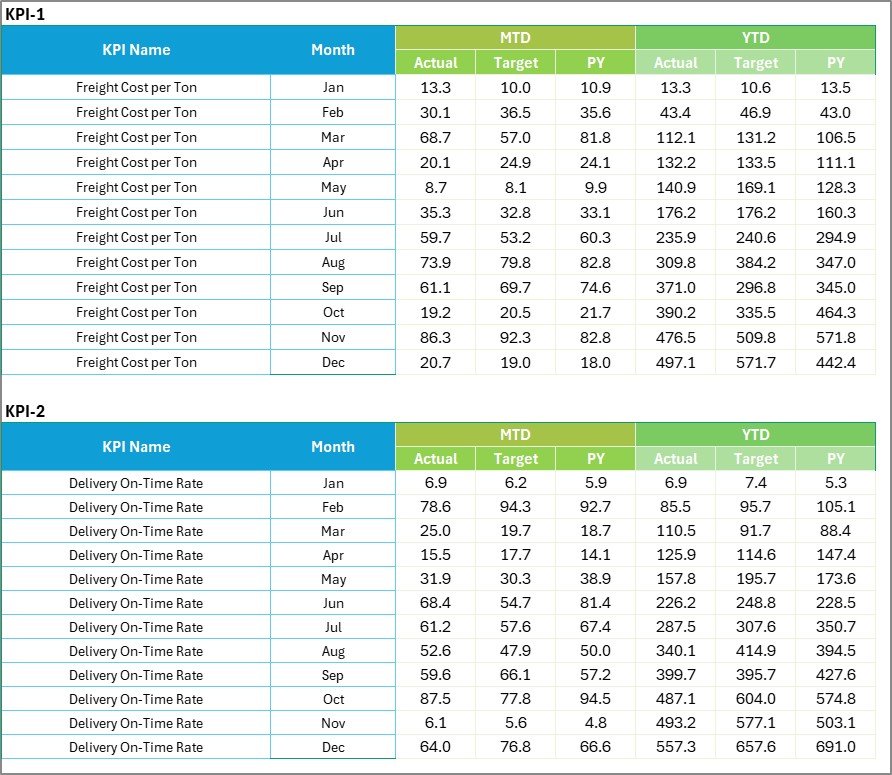
The Input Data Sheet acts as the data entry hub.
What Can You Do Here?
-
Record Actual values
-
Enter Target values
-
Update Previous Year numbers
-
Add monthly performance data
Since Excel allows easy updates, you can modify data anytime. Therefore, the scorecard always reflects current results.
Why Is This Sheet Important?
If you maintain accurate input data:
-
The dashboard stays reliable
-
Calculations remain correct
-
Reports stay consistent
Thus, data accuracy drives performance accuracy.
Click to Purchases Freight Management KPI Scorecard in Excel
4️⃣ KPI Definition Sheet – The KPI Library
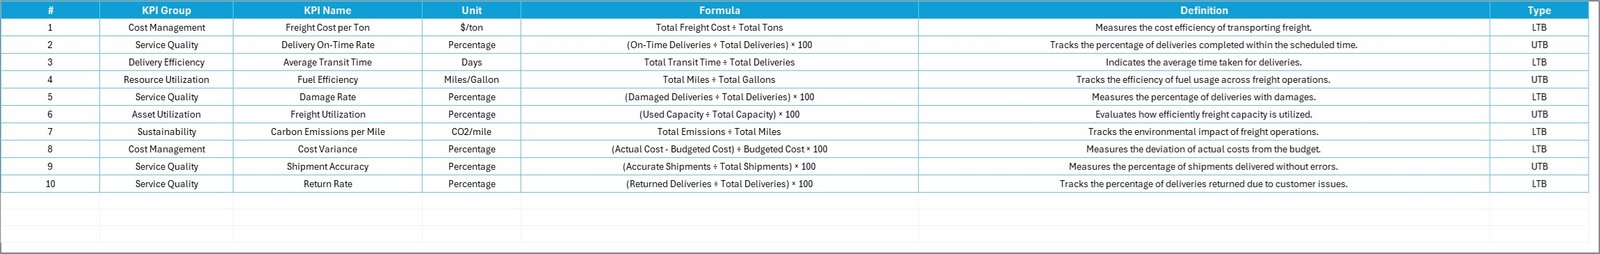
The KPI Definition Sheet stores all KPI details.
Here, you enter:
-
KPI Name
-
KPI Group
-
Unit
-
Formula
-
KPI Definition
This sheet ensures clarity.
For example:
-
Freight Cost per Shipment = Total Freight Cost ÷ Total Shipments
-
On-Time Delivery Rate = On-Time Shipments ÷ Total Shipments × 100
Therefore, every KPI remains standardized.
Which KPIs Should You Track in a Freight Management KPI Scorecard?
You should track both operational and financial KPIs.
🚛 Operational KPIs
-
On-Time Delivery Rate
-
Transit Time
-
Shipment Accuracy
-
Delivery Lead Time
-
Carrier Performance Score
-
Damage Rate
-
Shipment Delay Rate
💰 Financial KPIs
-
Freight Cost per Shipment
-
Cost per Mile
-
Fuel Cost Ratio
-
Transportation Cost as % of Revenue
-
Claims Cost
📦 Efficiency KPIs
-
Load Utilization Rate
-
Route Efficiency
-
Return Load Ratio
-
Capacity Utilization
When you track these KPIs regularly, you improve both cost control and service quality.
Click to Purchases Freight Management KPI Scorecard in Excel
How Does Freight Management KPI Scorecard Improve Decision-Making?
Let’s break this down clearly.
First, It Increases Visibility
You see all KPIs in one sheet. Therefore, you eliminate confusion.
Second, It Highlights Performance Gaps
Conditional formatting shows red indicators for poor performance. Thus, you identify issues instantly.
Third, It Enables Trend Analysis
The KPI Trend sheet displays month-wise and year-wise patterns. Consequently, you plan better.
Fourth, It Supports Target Management
You compare actual vs target continuously. As a result, you adjust strategies quickly.
Advantages of Freight Management KPI Scorecard in Excel
Using this Excel-based scorecard provides many benefits.
1️⃣ Easy to Use
You do not need advanced software knowledge. Excel offers a simple interface. Therefore, anyone can operate it.
2️⃣ Cost-Effective
You avoid expensive freight management systems. Instead, you use Excel. Hence, you save money.
3️⃣ Real-Time Performance Monitoring
As soon as you update input data, the scorecard updates automatically. Therefore, you get real-time insights.
4️⃣ Structured KPI Tracking
You organize KPIs by group and type. Consequently, performance tracking becomes systematic.
5️⃣ Visual Clarity
Charts and indicators make data easy to understand. Thus, management decisions become faster.
6️⃣ Flexible Customization
You can:
-
Add new KPIs
-
Modify formulas
-
Change targets
-
Adjust performance metrics
Therefore, the scorecard grows with your business.
7️⃣ Improved Accountability
When teams see clear KPIs, they take responsibility. As a result, performance improves.
Best Practices for the Freight Management KPI Scorecard
If you want maximum benefit, follow these best practices.
✔ Update Data Regularly
Enter data weekly or monthly. Do not delay updates. Otherwise, analysis loses accuracy.
✔ Define Clear Targets
Set realistic and measurable targets. Therefore, teams understand expectations.
✔ Review KPIs Monthly
Conduct monthly performance reviews. Discuss deviations openly. Then, create improvement plans.
✔ Focus on Critical KPIs
Do not overload the scorecard. Instead, track the most important KPIs first.
✔ Train Your Team
Explain KPI definitions clearly. Ensure everyone understands formulas and calculations.
✔ Use Trend Analysis for Planning
Do not only monitor results. Instead, analyze trends and forecast future performance.
✔ Maintain Data Accuracy
Cross-check numbers before updating. Because wrong data leads to wrong decisions.
How to Implement Freight Management KPI Scorecard Successfully?
Follow these simple steps:
-
Define your key freight KPIs
-
Set measurable targets
-
Enter baseline data
-
Assign KPI ownership
-
Review performance monthly
-
Take corrective actions
-
Monitor improvements continuously
If you follow this process, you will see measurable improvement within 3 to 6 months.
Click to Purchases Freight Management KPI Scorecard in Excel
Who Can Use Freight Management KPI Scorecard in Excel?
This template suits:
-
Freight forwarding companies
-
Logistics service providers
-
Transportation managers
-
Supply chain managers
-
Distribution centers
-
Warehouse managers
-
Fleet operators
Therefore, any freight-based organization can benefit from it.
How Does It Support Long-Term Growth?
A structured KPI system supports growth because:
-
It improves cost control
-
It increases delivery reliability
-
It enhances customer satisfaction
-
It reduces operational waste
-
It strengthens carrier relationships
Consequently, profit margins improve steadily.
Conclusion
Freight management requires constant monitoring. Costs change frequently. Delivery performance impacts customer satisfaction directly. Therefore, companies must track KPIs carefully.
A Freight Management KPI Scorecard in Excel offers a simple yet powerful solution. It provides structured tracking. It improves visibility. It supports better decisions.
Moreover, it allows MTD and YTD comparisons. It highlights performance gaps. It enables trend analysis.
If you want to control freight costs, improve delivery accuracy, and increase operational efficiency, you should implement this scorecard immediately.
Because when you measure performance clearly, you manage performance effectively.
Click to Purchases Freight Management KPI Scorecard in Excel
Frequently Asked Questions with Answers
1️⃣ What is a Freight Management KPI Scorecard in Excel?
It is a structured Excel template that tracks freight-related KPIs such as delivery rate, cost per shipment, and carrier performance.
2️⃣ Can I customize the KPIs?
Yes. You can add, remove, or modify KPIs based on your business needs.
3️⃣ What is the difference between MTD and YTD?
-
MTD means Month-to-Date performance.
-
YTD means Year-to-Date performance.
MTD tracks monthly progress, while YTD tracks yearly performance.
4️⃣ Do I need advanced Excel skills to use this scorecard?
No. Basic Excel knowledge is enough to operate the template.
5️⃣ How often should I update the KPI data?
You should update data monthly or weekly. Regular updates ensure accurate analysis.
6️⃣ Can small freight businesses use this scorecard?
Yes. Small, medium, and large freight companies can use it effectively.
7️⃣ Why is KPI tracking important in freight management?
Because KPI tracking helps control costs, improve delivery performance, and increase customer satisfaction.
Visit our YouTube channel to learn step-by-step video tutorials