Introduction
The Genetic Testing Labs KPI Dashboard is a comprehensive and ready-to-use template designed to streamline the monitoring and evaluation of key performance indicators (KPIs) for genetic testing laboratories. With this dashboard, lab managers and analysts can track monthly and yearly metrics, compare targets with actuals, and analyze trends efficiently. This detailed guide will walk you through the dashboard’s features, its various sheets, and how it supports performance management in genetic testing environments.
Key Features of Genetic Testing Labs KPI Dashboard
- Comprehensive tracking of MTD (Month-to-Date) and YTD (Year-to-Date) KPIs
- Conditional formatting with up and down arrows for easy visual comparison of Actual vs Target and Previous Year
- Interactive dashboards with dropdowns to select specific months and KPIs
- Seven well-structured worksheets for data input, KPI definitions, monthly trends, and summary dashboards
- Fully automated updates based on user inputs for actual, target, and previous year data
- Clear KPI definitions and formulas for transparency and better understanding
- User-friendly navigation with a Home index sheet featuring clickable buttons to jump between sheets
Dashboard Pages Explanation
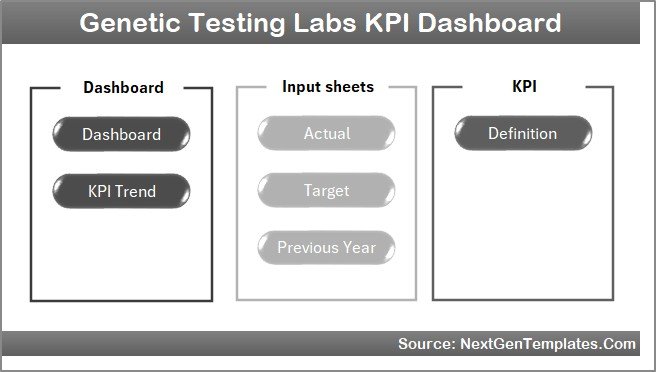
1. Home Sheet
The Home sheet serves as the central navigation hub. It includes six buttons that link directly to the respective worksheets, making it simple to switch between pages.
 Home Page
Click to Buy Genetic Testing Labs KPI Dashboard in Excel
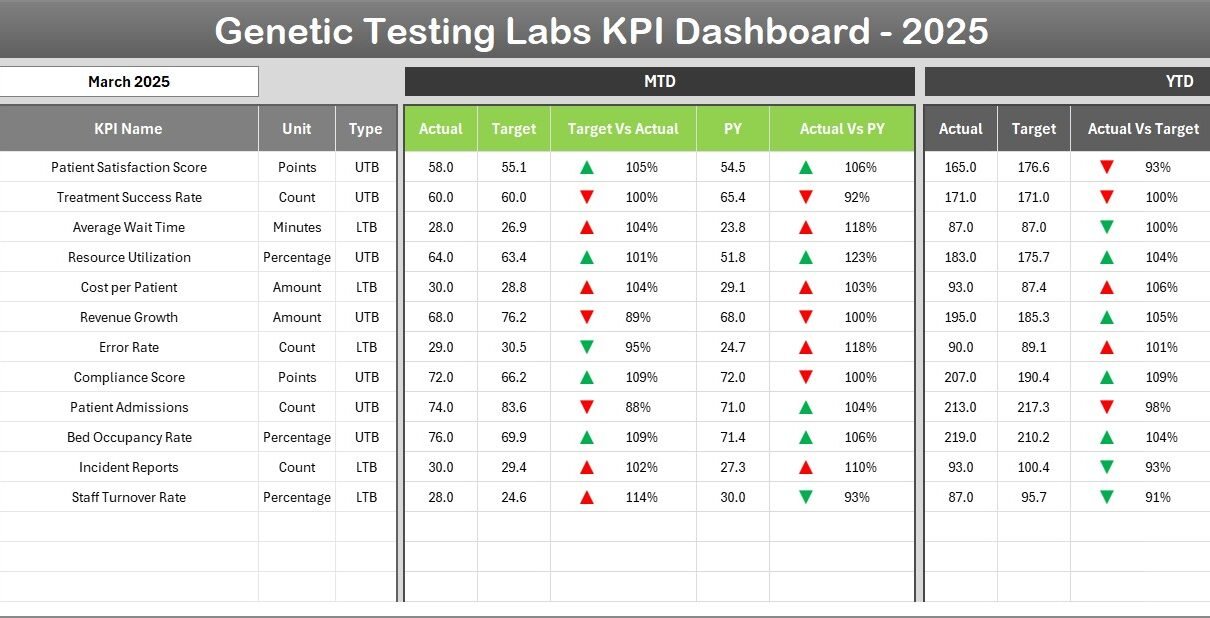
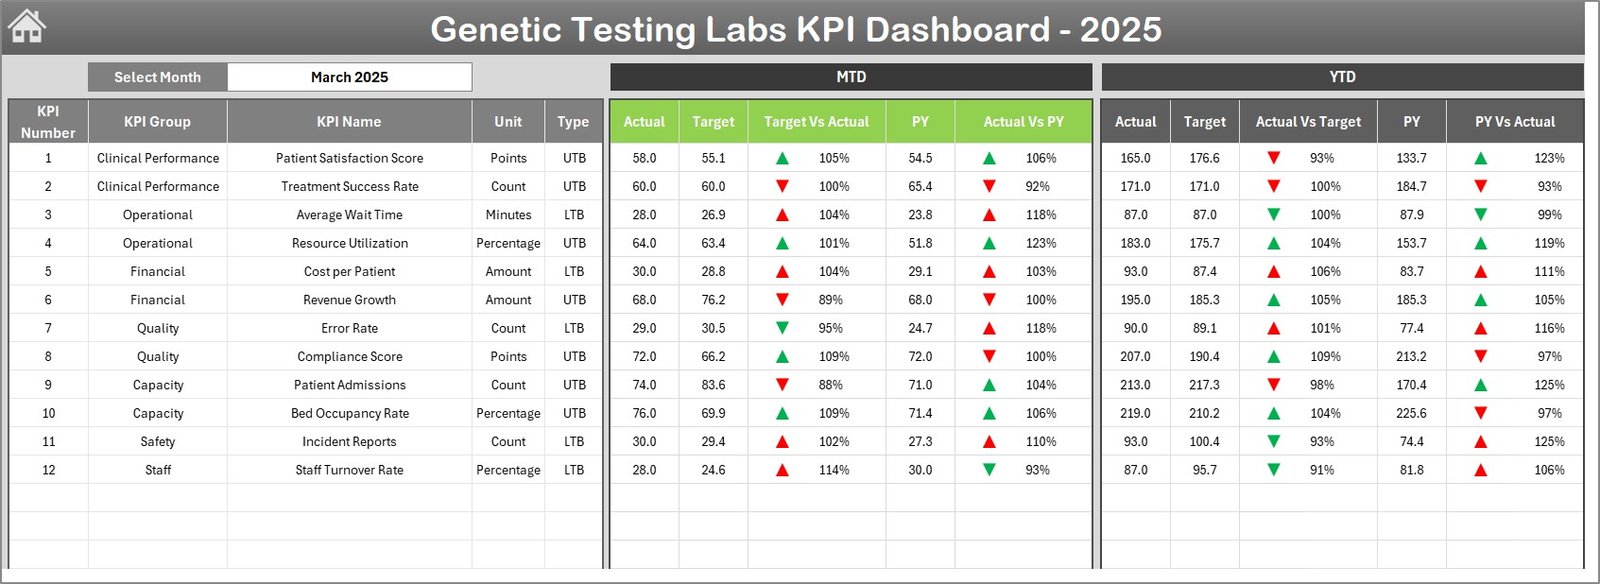
2. Dashboard Sheet Tab
This is the primary dashboard where all the KPIs are summarized. Users can select the desired month from the drop-down at cell D3, triggering an update across all displayed figures. The dashboard details:
- MTD Actual, Target, and Previous Year data with visual conditional formatting marking performance variances
- YTD Actual, Target, and Previous Year data, also with conditional up/down arrows for quick insights
- Side-by-side comparison of Target vs Actual and Previous Year vs Actual to assess progress
 Genetic Testing Labs KPI Dashboard
Click to Buy Genetic Testing Labs KPI Dashboard in Excel
3. KPI Trend Sheet Tab
This sheet offers a detailed view of trends for individual KPIs. Users can select a KPI from the dropdown on cell C3 to explore its group, measurement unit, KPI type (Lower the Better or Upper the Better), formula, and definition.
Additional features include:
- MTD and YTD trend charts showcasing Actual, Target, and Previous Year values
- Clear visual representation aids in understanding patterns and performance over time
 KPI Trend Sheet
Click to Buy Genetic Testing Labs KPI Dashboard in Excel
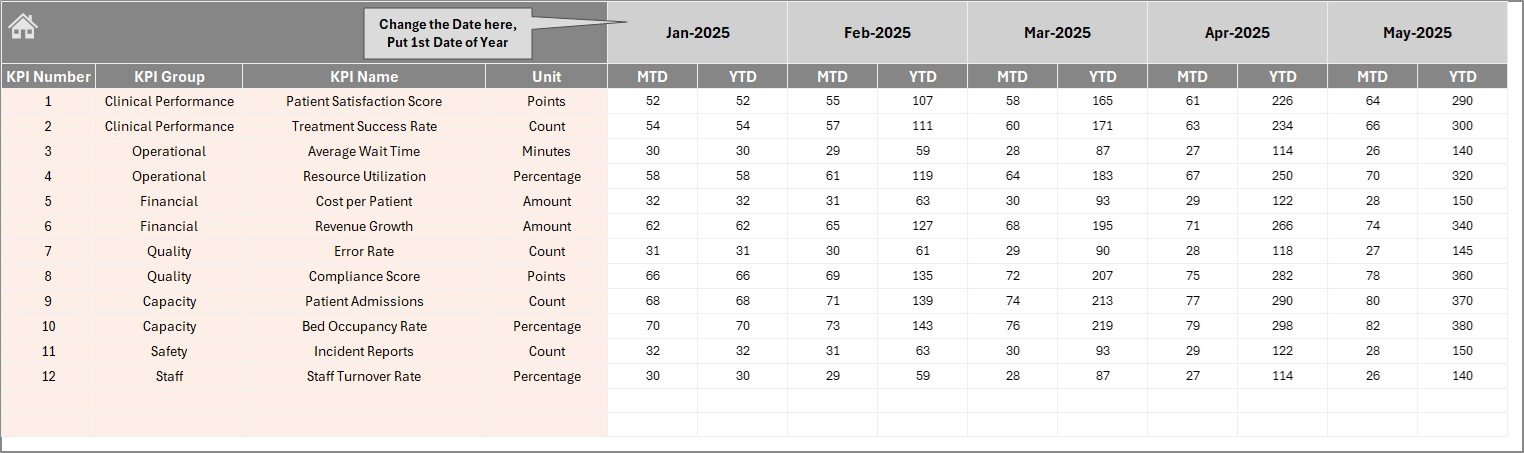
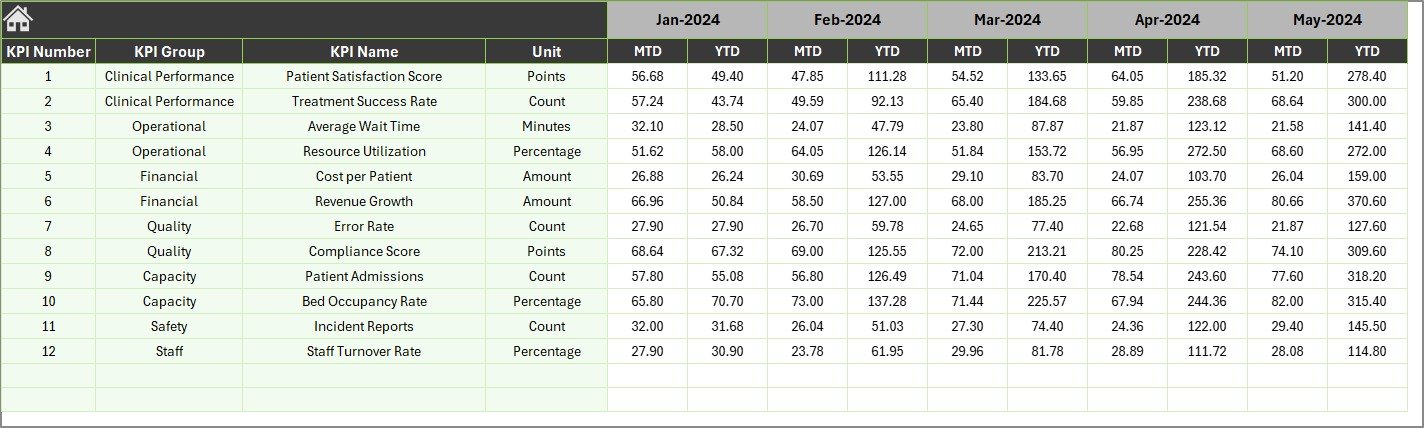
4. Actual Numbers Input Sheet
Enter the actual collected data for each KPI both on a month-to-date and year-to-date basis. The month selection can be adjusted by changing the first month of the year in cell E1.
 Actual Numbers Input sheet
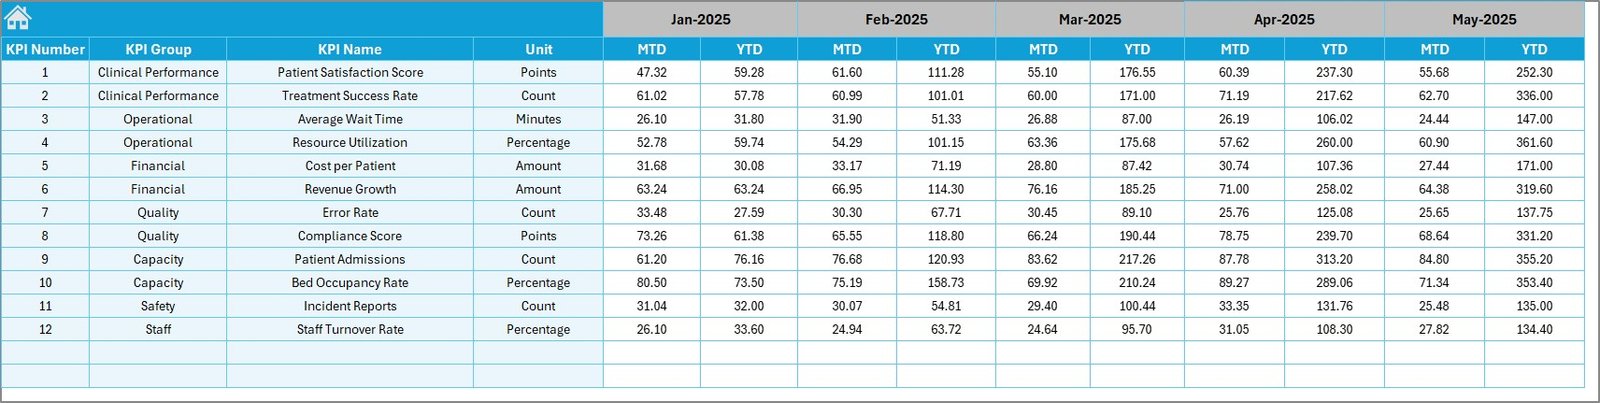
5. Target Number Input Sheet
This tab functions similarly but for inputting target values for KPIs, for both MTD and YTD. Enter the expected goals here to benchmark performance.
 Target Number Input sheet
Click to Buy Genetic Testing Labs KPI Dashboard in Excel
6. Previous Year Number Sheet Tab
Records last year’s KPI figures for comparative analysis. This is essential for year-over-year performance insights.
 Previous Year Number Input sheet
Click to Buy Genetic Testing Labs KPI Dashboard in Excel
7. KPI Definition Sheet Tab
This sheet documents essential details for each KPI, including:
- KPI Name and Group
- Unit of measurement
- Formula used to calculate the KPI
- Clear KPI definition for context
- KPI Type – whether Lower The Better (LTB) or Upper The Better (UTB)
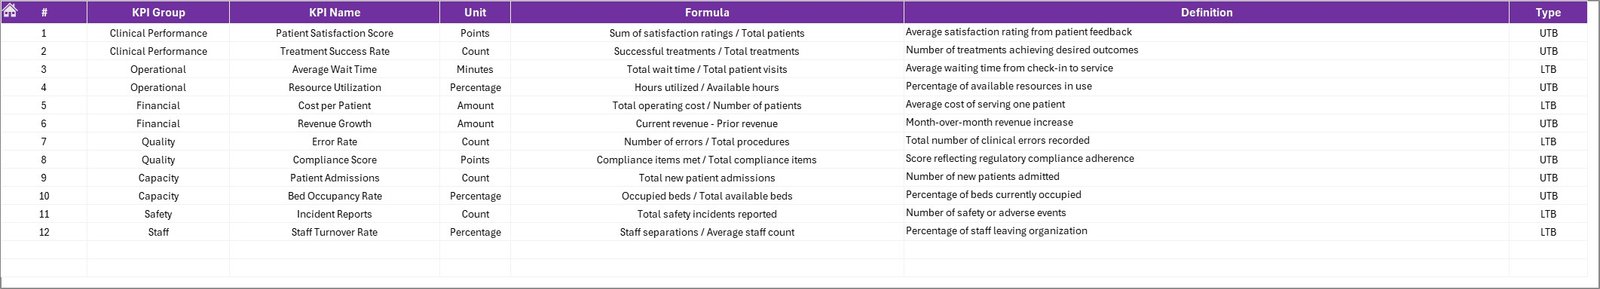 KPI Definition sheet
Advantages of Genetic Testing Labs KPI Dashboard
- Efficient performance tracking: Consolidates KPIs into an easy-to-read format for faster decision-making.
- Customization friendly: Allows custom entry of actuals, targets, and previous year’s data providing flexibility.
- Dynamic date selection: Enables quick performance review of any month with automatic recalculations.
- Visual aids: Use of arrows and color codes helps identify areas of concern or success instantly.
- KPI clarity: With well-defined KPI descriptions, teams can understand what is being measured and why.
Opportunities for Improvement
Click to Buy Genetic Testing Labs KPI Dashboard in Excel
- Integration with laboratory information systems (LIMS) for automated data import.
- Enhanced mobile responsiveness for on-the-go KPI tracking.
- Addition of predictive analytics to forecast trends based on current data.
- Multi-lingual support for global lab teams.
- Incorporation of alert systems to notify stakeholders of KPI deviations in real-time.
Best Practices
- Keep KPI definitions clear and agreed upon by stakeholders to avoid confusion.
- Regularly update actual, target, and previous year data to maintain dashboard relevance.
- Train users on dashboard navigation, especially the dropdown selections for months and KPIs.
- Use dashboard insights to drive continuous improvement initiatives and quality controls.
- Regularly backup dashboard data to prevent accidental loss.
FAQs
Click to Buy Genetic Testing Labs KPI Dashboard in Excel
Can this dashboard be customized for different genetic tests?
Yes, the dashboard is designed to be flexible. You can add or modify KPI definitions to suit various genetic tests or lab workflows.
Is prior Excel experience required to use this KPI dashboard?
A basic understanding of Excel is helpful but not mandatory. The dashboard includes dropdowns and buttons for ease of use.
Can I share this dashboard with my team?
Absolutely. This is designed to be a collaborative tool to enhance team performance and transparency.
Does the dashboard support multiple years of data?
Currently, it supports the current year and the previous year. However, it can be extended to include more years with slight modifications.
Conclusion
Click to Buy Genetic Testing Labs KPI Dashboard in Excel
The Genetic Testing Labs KPI Dashboard is an invaluable tool for genetic testing laboratories aiming to improve performance visibility and operational efficiency. Its intuitive design, combined with robust data tracking features, empowers users to make informed decisions and continuously enhance lab outcomes. By leveraging this dashboard, genetic testing labs can better monitor key metrics, drive improvements, and maintain high standards of testing quality.
For more detailed information and tutorials on using KPI dashboards, visit the official Microsoft Excel support page.
Visit our YouTube channel to watch the demo.
Click to Buy Genetic Testing Labs KPI Dashboard in Excel