The renewable energy sector continues to grow as organizations shift toward sustainable power generation. Among renewable sources, geothermal energy plays a critical role because it provides continuous and reliable electricity with minimal environmental impact. However, managing geothermal operations requires accurate monitoring, performance evaluation, and real-time insights.
Without structured analytics, energy companies struggle to measure operational efficiency, compare performance against targets, and identify improvement opportunities. Therefore, organizations increasingly adopt Power BI dashboards to transform raw data into actionable insights.
The Geothermal Energy KPI Dashboard in Power BI offers a ready-to-use, interactive solution designed to track and analyze geothermal plant performance using powerful visual analytics. In this detailed guide, you will learn how this dashboard works, why it matters, which KPIs it tracks, and how organizations can improve decision-making using Power BI.
Click to Purchases Geothermal Energy KPI Dashboard in Power BI
What Is a Geothermal Energy KPI Dashboard in Power BI?
A Geothermal Energy KPI Dashboard in Power BI is an interactive business intelligence solution that helps organizations monitor operational, financial, and performance KPIs using dynamic visual reports.
Instead of analyzing multiple spreadsheets, users access all performance indicators in one centralized dashboard. As a result, managers quickly evaluate performance trends, compare targets with actual results, and make data-driven decisions.
Moreover, Power BI provides advanced visualization capabilities. Therefore, users can explore performance data using slicers, drill-through pages, and interactive charts.
The dashboard uses an Excel file as a data source, which makes it simple to maintain and update.
Why Do Geothermal Energy Companies Need KPI Dashboards?
Geothermal plants operate continuously. However, operational efficiency depends on monitoring multiple variables such as energy output, equipment performance, and cost efficiency.
Without KPI tracking:
-
Performance issues remain hidden.
-
Reporting becomes slow and manual.
-
Decision-making relies on assumptions.
-
Historical comparison becomes difficult.
Therefore, KPI dashboards help organizations maintain operational transparency.
Key benefits include:
-
Real-time performance monitoring
-
Faster decision-making
-
Improved operational efficiency
-
Accurate target tracking
-
Better sustainability reporting
Key Features of the Geothermal Energy KPI Dashboard in Power BI
This Power BI dashboard contains three interactive report pages, each designed to deliver specific insights.
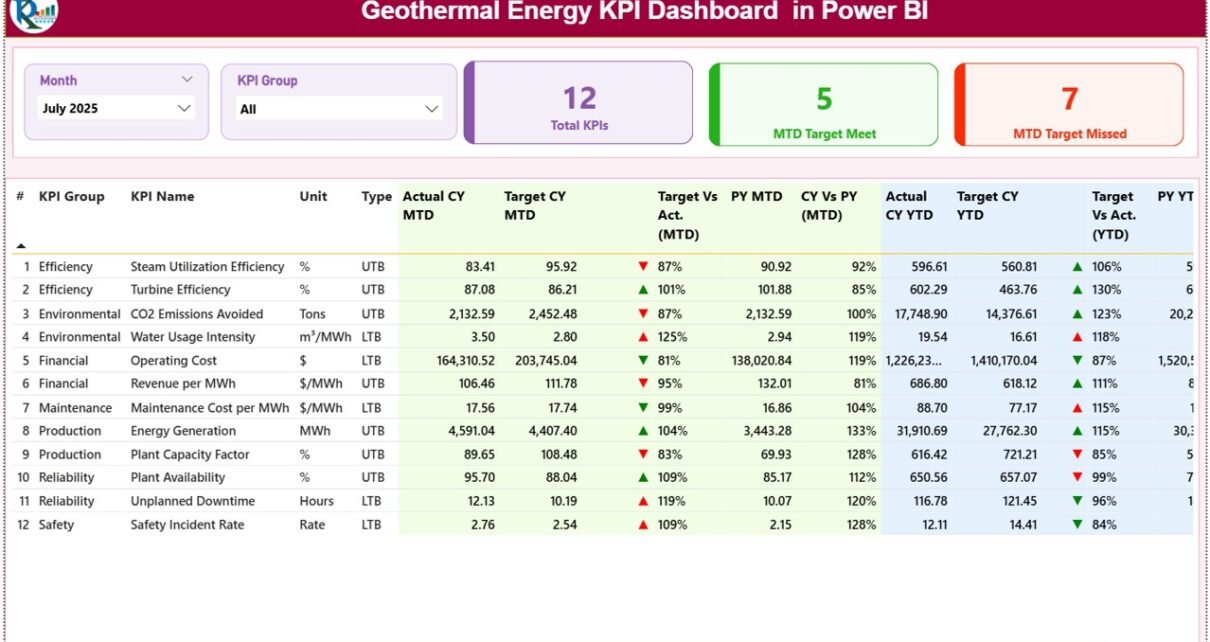
1. Summary Page – Complete KPI Overview
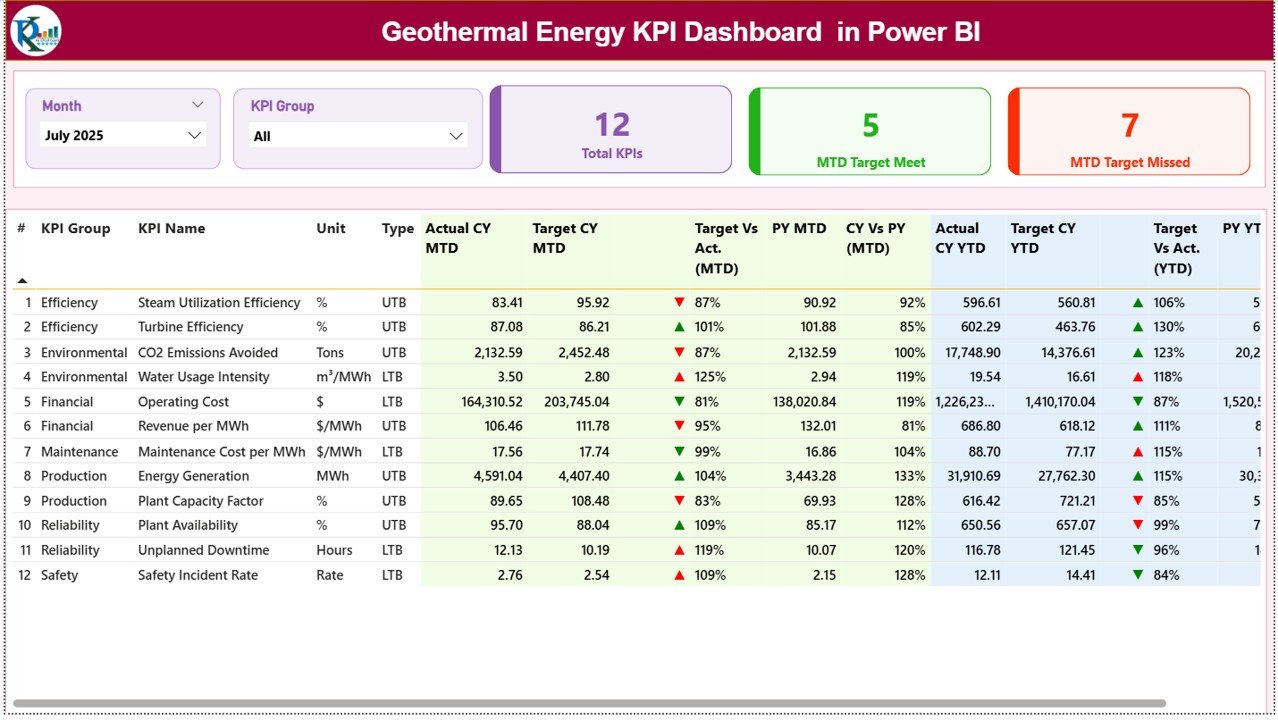
The Summary Page acts as the main control center of the dashboard.
At the top, users find two slicers:
-
Month slicer
-
KPI Group slicer
These filters allow users to analyze performance dynamically.
KPI Performance Cards
The dashboard displays three important KPI cards:
-
Total KPIs Count
-
MTD Target Meet Count
-
MTD Target Missed Count
These indicators instantly show overall performance health.
Detailed KPI Performance Table
Below the cards, a detailed table presents complete KPI information.
Columns Included:
-
KPI Number – Unique sequence number
-
KPI Group – KPI category
-
KPI Name – Performance metric name
-
Unit – Measurement unit
-
Type – LTB (Lower the Better) or UTB (Upper the Better)
Month-To-Date (MTD) Performance Metrics
The dashboard displays:
-
Actual CY MTD (Current Year Actual)
-
Target CY MTD
-
MTD Icon indicators (▲ Green / ▼ Red)
-
Target vs Actual % (MTD)
-
Previous Year MTD
-
Current Year vs Previous Year %
The percentage calculation uses:
Actual ÷ Target
Therefore, users instantly understand whether KPIs meet expectations.
Year-To-Date (YTD) Performance Metrics
Similarly, the dashboard tracks long-term performance.
Displayed metrics include:
-
Actual CY YTD
-
Target CY YTD
-
YTD Status Icons
-
Target vs Actual % (YTD)
-
Previous Year YTD
-
CY vs PY Comparison %
Consequently, decision-makers evaluate both short-term and annual performance trends.
Click to Purchases Geothermal Energy KPI Dashboard in Power BI
2. KPI Trend Page – Performance Trend Analysis
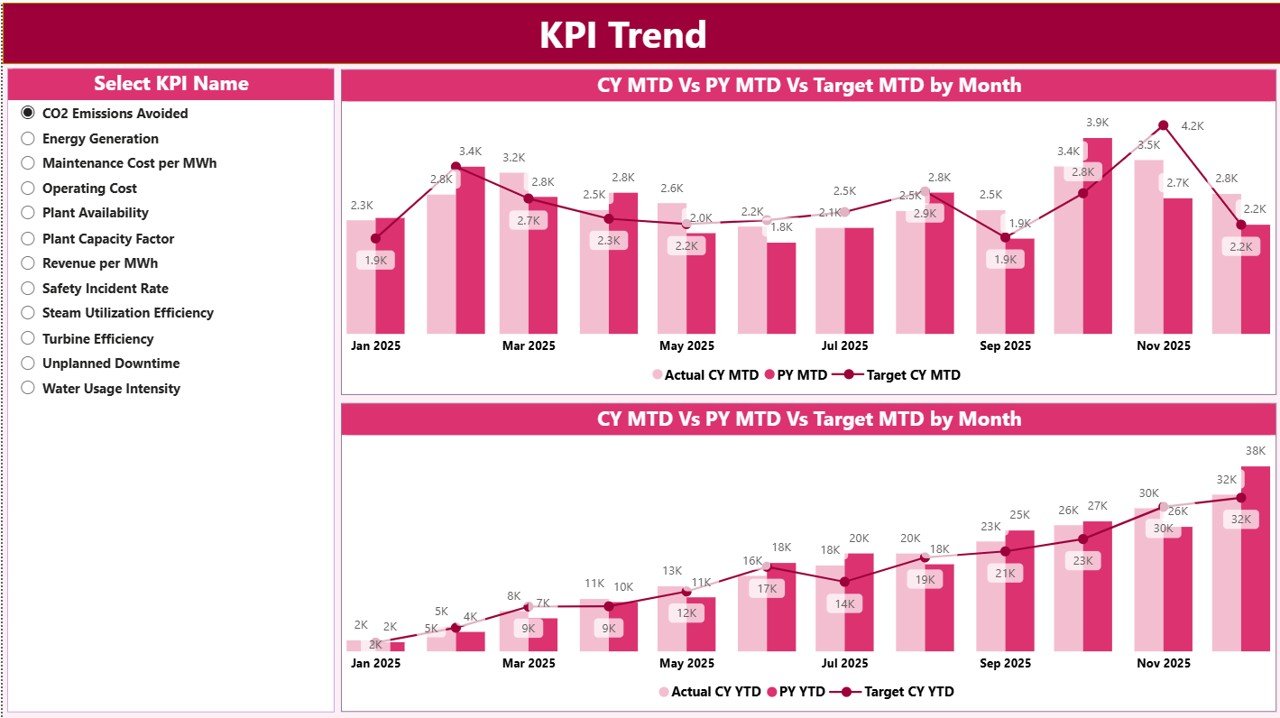
The KPI Trend Page provides deeper analytical insights.
Users select a KPI using the slicer available on the left side. Immediately, Power BI updates the visualizations.
Visual Elements:
-
Two combo charts
-
MTD performance comparison
-
YTD performance comparison
Each chart compares:
-
Current Year Actual
-
Previous Year Actual
-
Target values
Therefore, users easily identify performance patterns and trends.
Click to Purchases Geothermal Energy KPI Dashboard in Power BI
3. KPI Definition Page – Drill-Through KPI Details
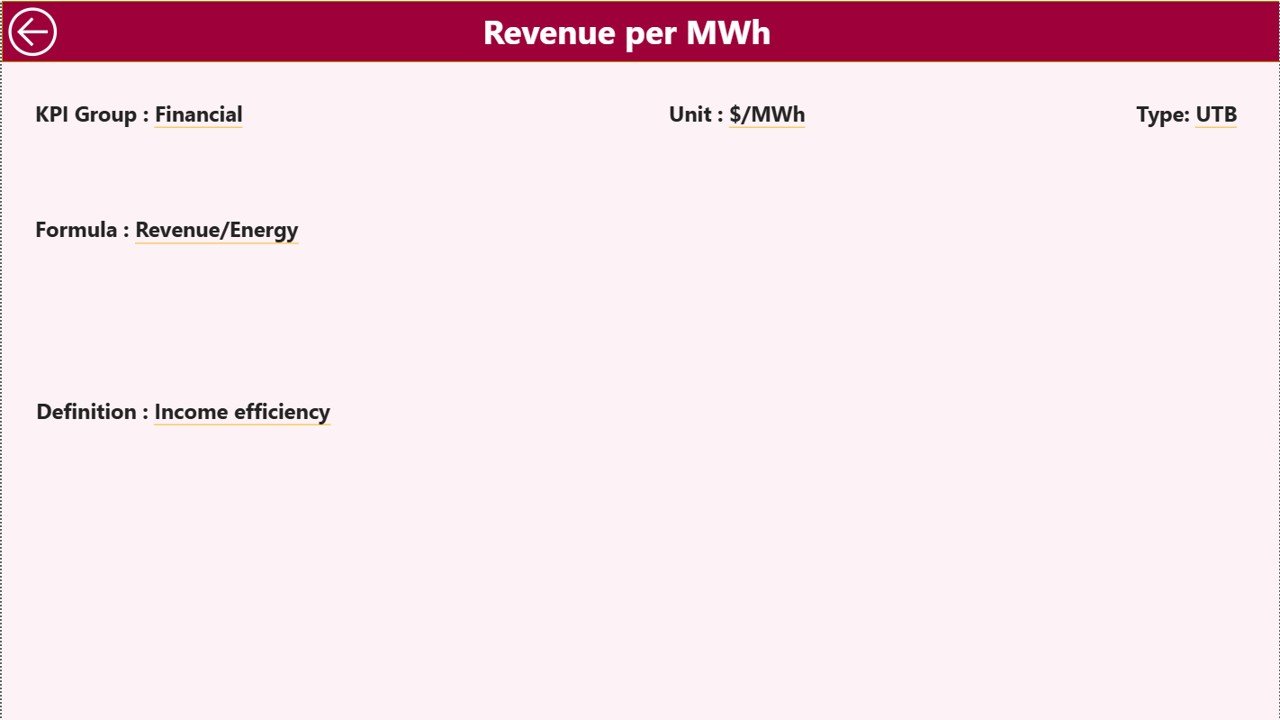
The KPI Definition Page works as a hidden drill-through page.
From the Summary Page, users can drill through to view detailed KPI information such as:
-
KPI Formula
-
KPI Definition
-
Measurement logic
To return to the main page, users simply click the Back button located at the top-left corner.
This feature improves clarity and ensures consistent KPI understanding across teams.
Excel Data Source Structure
The dashboard connects to an Excel file that stores all KPI data. Users only need to update Excel sheets, and Power BI refreshes automatically.
The Excel file contains three worksheets.
1. Input_Actual Sheet
Users enter actual performance values.
Required fields:
-
KPI Name
-
Month (First date of month)
-
MTD value
-
YTD value
This sheet captures real operational results.
2. Input_Target Sheet
This sheet stores target performance values.
Users enter:
-
KPI Name
-
Month
-
Target MTD
-
Target YTD
Targets enable performance comparison.
3. KPI Definition Sheet
This sheet defines KPI metadata.
Users enter:
-
KPI Number
-
KPI Group
-
KPI Name
-
Unit
-
Formula
-
Definition
-
KPI Type (LTB or UTB)
Therefore, the dashboard maintains standardized KPI documentation.
Click to Purchases Geothermal Energy KPI Dashboard in Power BI
Which KPIs Should Be Included in a Geothermal Dashboard?
Organizations typically track multiple KPI categories.
Operational KPIs
-
Energy production output
-
Plant availability rate
-
Capacity utilization
-
Equipment downtime
Financial KPIs
-
Cost per MWh
-
Revenue efficiency
-
Maintenance costs
-
Operational expenses
Environmental KPIs
-
Emission reduction
-
Resource utilization efficiency
-
Sustainability performance
Maintenance KPIs
-
Equipment reliability
-
Maintenance response time
-
Failure frequency
Tracking balanced KPIs ensures holistic performance evaluation.
Click to Purchases Geothermal Energy KPI Dashboard in Power BI
Advantages of Geothermal Energy KPI Dashboard in Power BI
✅ Interactive Data Visualization
Power BI transforms complex data into easy visuals.
✅ Real-Time Insights
Users refresh data instantly.
✅ Advanced Filtering
Slicers allow flexible analysis.
✅ Automated Calculations
Performance metrics calculate automatically.
✅ Historical Comparison
Current performance compares with previous year results.
✅ Drill-Through Analytics
Users explore KPI definitions instantly.
✅ Scalable Reporting
Dashboard adapts to growing datasets.
How Does Power BI Improve Renewable Energy Analytics?
Power BI enhances analytics because it provides:
-
Interactive dashboards
-
Dynamic filtering
-
Advanced visualization
-
Automated reporting
-
Data integration capabilities
Therefore, organizations move from static reporting to intelligent analytics.
Click to Purchases Geothermal Energy KPI Dashboard in Power BI
How to Use the Geothermal Energy KPI Dashboard?
Step 1: Update Excel Data
Enter actual and target KPI numbers.
Step 2: Refresh Power BI Dataset
Click Refresh in Power BI Desktop.
Step 3: Select Month
Use slicer to filter analysis.
Step 4: Analyze KPI Status
Check icons and performance percentages.
Step 5: Review Trends
Open KPI Trend page for deeper analysis.
Step 6: Drill Through Details
View KPI definitions when required.
Best Practices for the Geothermal Energy KPI Dashboard
To achieve maximum value, follow these practices.
✔ Maintain Clean Data Structure
Avoid inconsistent KPI names.
✔ Update Data Regularly
Monthly updates ensure accuracy.
✔ Focus on Key KPIs
Avoid tracking unnecessary metrics.
✔ Use KPI Groups
Categorize KPIs logically.
✔ Monitor Trends Continuously
Trend analysis provides better insights.
✔ Train Dashboard Users
Ensure teams understand interpretation.
Click to Purchases Geothermal Energy KPI Dashboard in Power BI
Who Should Use This Dashboard?
This dashboard benefits multiple roles.
-
Renewable energy plant managers
-
Operations engineers
-
Energy analysts
-
Sustainability managers
-
Financial planners
-
Renewable energy consultants
Each stakeholder gains actionable insights.
Why Choose Power BI for Energy KPI Monitoring?
Compared to traditional reporting, Power BI offers:
-
Interactive visuals
-
Faster analytics
-
Data storytelling capabilities
-
Professional reporting layouts
-
Easy sharing across teams
Therefore, organizations achieve smarter performance management.
Future of Geothermal Energy Analytics
As renewable technology evolves, KPI dashboards will become more advanced.
Future enhancements may include:
-
IoT sensor integration
-
Predictive maintenance analytics
-
AI-based forecasting
-
Automated data pipelines
However, Power BI dashboards already provide a strong analytical foundation today.
Conclusion
The Geothermal Energy KPI Dashboard in Power BI provides a powerful and structured approach to monitoring geothermal plant performance. By combining Excel data sources with Power BI visualization, organizations gain clear insights into operational efficiency, target achievement, and historical performance trends.
Moreover, interactive slicers, drill-through pages, and automated calculations simplify complex analysis. As a result, managers make faster decisions, improve efficiency, and support sustainability goals.
Therefore, this dashboard serves as an essential tool for modern geothermal energy management.
Click to Purchases Geothermal Energy KPI Dashboard in Power BI
Frequently Asked Questions (FAQs)
What is a Geothermal Energy KPI Dashboard?
It is a Power BI dashboard used to monitor geothermal plant performance using measurable KPIs.
Does the dashboard require Power BI Service?
No. It works in Power BI Desktop, although sharing becomes easier using Power BI Service.
How is data updated?
Users update Excel sheets and refresh the dashboard.
What does LTB and UTB mean?
LTB means Lower the Better, while UTB means Upper the Better.
Can KPIs be customized?
Yes. Users can modify KPI definitions and formulas easily.
Is this dashboard suitable for other renewable energy sectors?
Yes. The structure adapts to solar, wind, and hydro energy monitoring.
Click to Purchases Geothermal Energy KPI Dashboard in Power BI
Visit our YouTube channel to learn step-by-step video tutorials