Green building is no longer a trend—it has become a necessity. Organizations across industries are under constant pressure to reduce their environmental footprint, manage energy consumption, and ensure sustainable operations. Measuring sustainability progress requires reliable data and clear reporting tools.
This is where a Green Building KPI Dashboard in Power BI makes the difference. By consolidating sustainability metrics into one visual platform, businesses can track progress, compare performance against targets, and make data-driven decisions for a greener future.
In this article, we will explore every aspect of the Green Building KPI Dashboard in Power BI—its features, advantages, data requirements, best practices, and practical use cases.
Click to Purchases Green Building KPI Dashboard in Power BI
What Is a Green Building KPI Dashboard in Power BI?
A Green Building KPI Dashboard is a performance management tool built in Power BI. It connects to an Excel-based dataset and visualizes Key Performance Indicators (KPIs) for sustainability, energy efficiency, water use, and compliance.
The dashboard is divided into three main pages:
-
Summary Page – for quick KPI performance monitoring
-
KPI Trend Page – for visual analysis of trends over time
-
KPI Definition Page – for detailed KPI descriptions and formulas
Together, these pages help facility managers, compliance officers, and sustainability teams keep a close eye on performance while driving continuous improvement.
Key Features of the Green Building KPI Dashboard
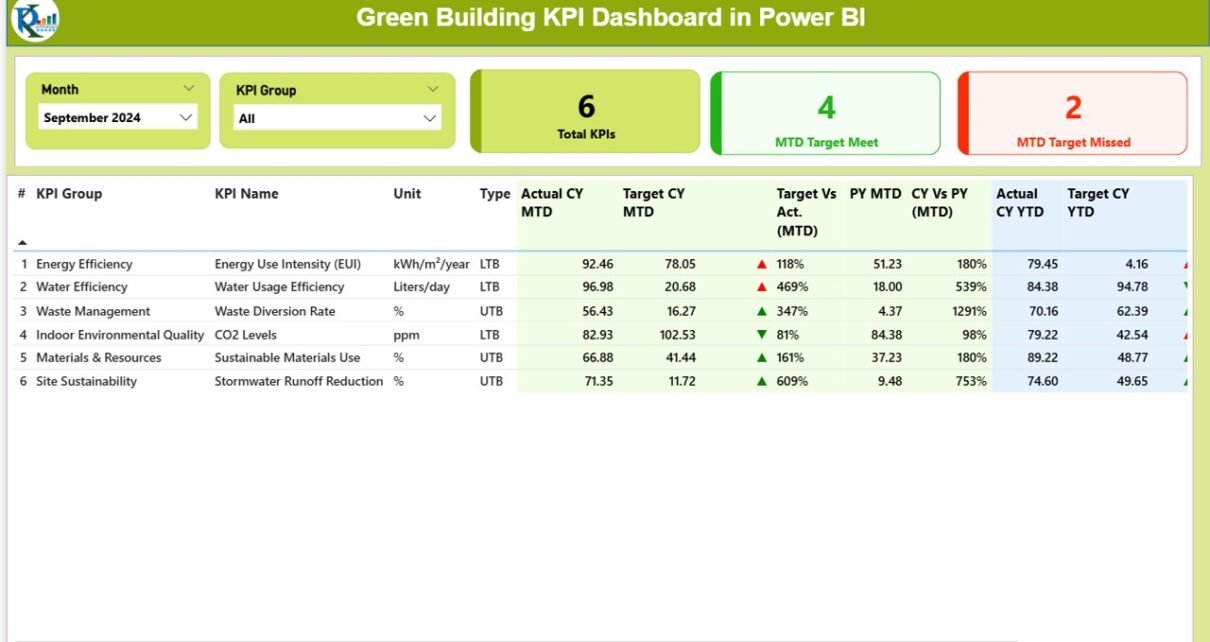
Summary Page – At-a-Glance KPI Monitoring
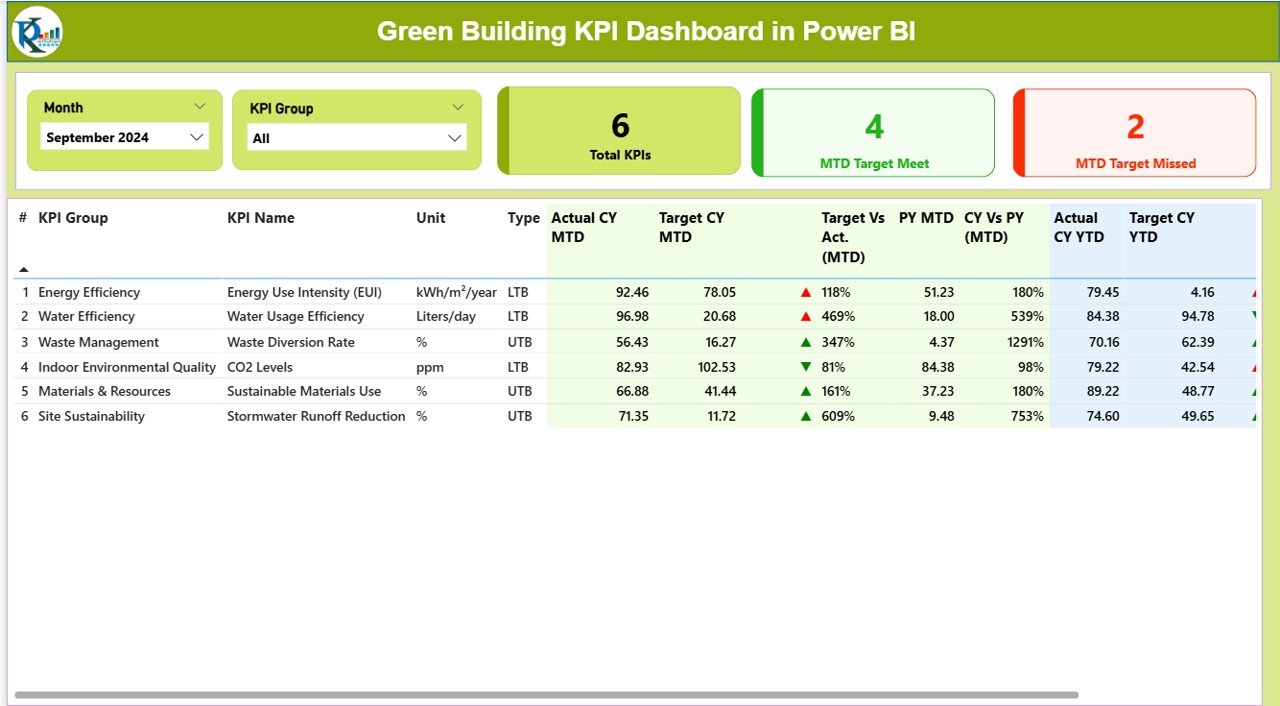
The Summary Page serves as the control center of the dashboard. It includes:
-
Month and KPI Group slicers – Easily filter results by specific periods or categories.
-
Performance Cards – Show Total KPI count, MTD (Month-to-Date) Target Met, and MTD Target Missed.
Detailed KPI Table – Displays:
KPI Number & Name
KPI Group & Unit
Type (UTB – Upper the Better, LTB – Lower the Better)
Actual CY (Current Year) MTD & YTD values
Target CY MTD & YTD values
Performance Icons (green ▲ or red ▼)
Target vs Actual % (for both MTD and YTD)
Previous Year comparisons
Click to Purchases Green Building KPI Dashboard in Power BI
KPI Trend Page – Visualizing Performance Over Time
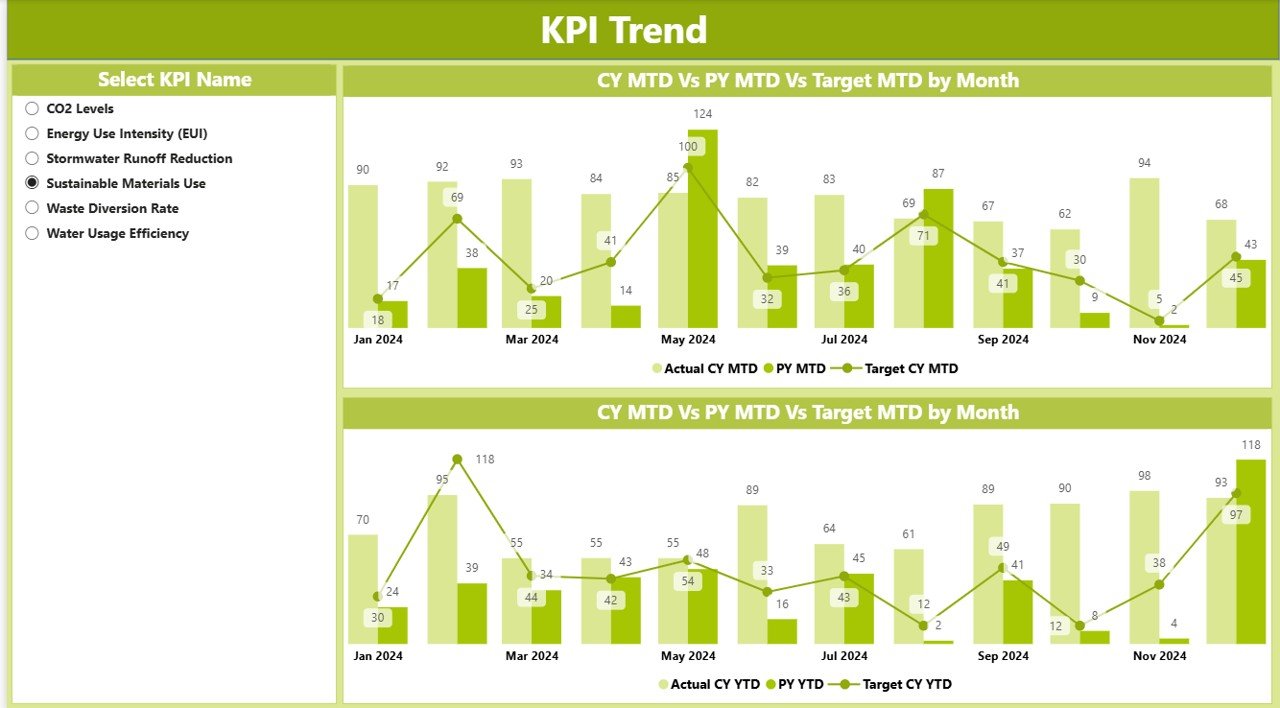
On this page, users can:
-
Select a specific KPI from the slicer.
-
View combo charts comparing:
- Current Year (Actuals)
- Previous Year (Actuals)
- Targets (MTD and YTD)
KPI Definition Page – Understanding the Metrics
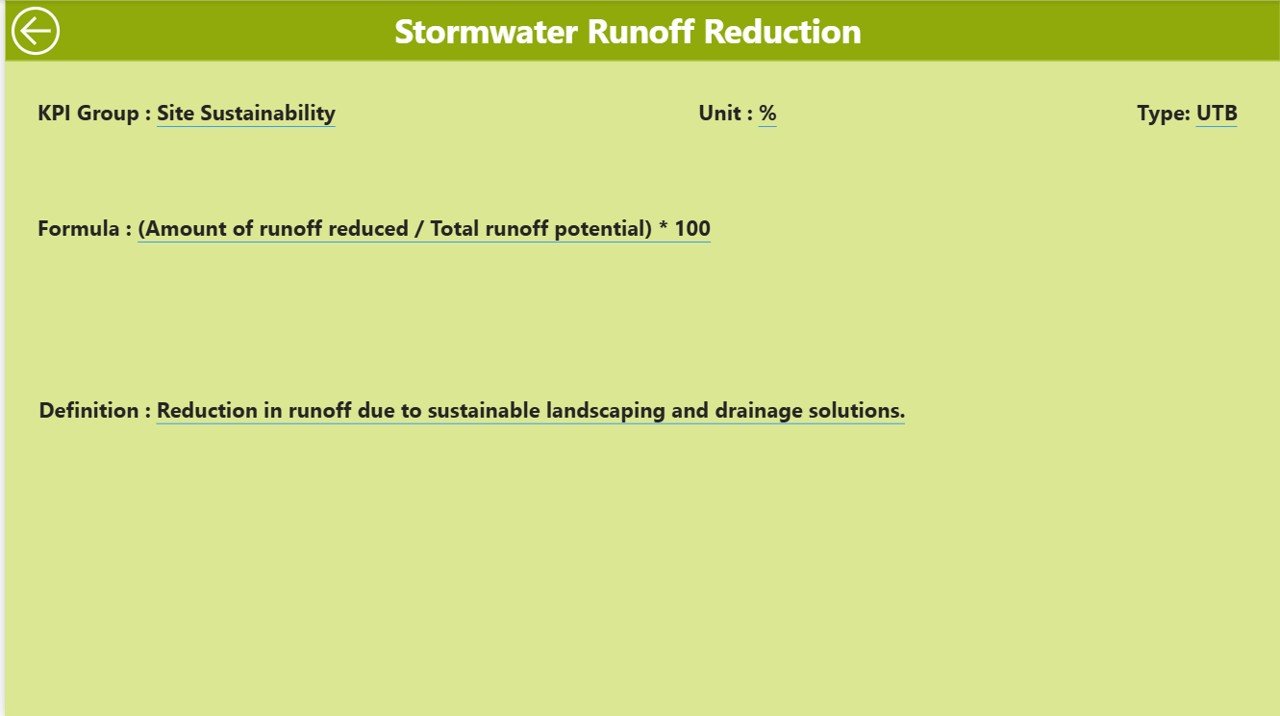
The KPI Definition Page is hidden by default but accessible via drill-through. It provides:
-
KPI Number, Group, and Name
-
Unit of Measurement
-
Formula used for calculation
-
Clear KPI Definition
-
KPI Type (LTB or UTB)
Data Source: Excel File Integration
The dashboard connects to a structured Excel file. The file includes three critical sheets:
1. Input_Actual Sheet
-
Fields: KPI Name, Month (first day of month), MTD number, YTD number
-
Purpose: Captures actual KPI performance
2. Input_Target Sheet
-
Fields: KPI Name, Month (first day of month), MTD number, YTD number
-
Purpose: Stores target values for comparison
3. KPI Definition Sheet
-
Fields: KPI Number, KPI Group, KPI Name, Unit, Formula, Definition, Type (LTB/UTB)
-
Purpose: Provides metadata and structure to KPIs
Advantages of Green Building KPI Dashboard in Power BI
✅ Centralized Performance Tracking – All KPIs are in one place, reducing manual reporting.
✅ Data-Driven Sustainability – Enables teams to align building performance with environmental goals.
✅ Real-Time Monitoring – Quickly see if performance is above or below target.
✅ Historical Comparisons – Compare current year vs. previous year for better insights.
✅ Clear Visualization – Icons, charts, and cards make results easy to interpret.
✅ Scalability – Works for a single building or an entire portfolio of facilities.
✅ User-Friendly Navigation – Slicers, drill-through, and intuitive layout make it easy for non-technical users.
Opportunities for Improvement
While this dashboard is powerful, organizations can enhance it further by:
🔹 Adding Forecasting Models – Predict future sustainability outcomes using Power BI’s AI features.
🔹 Integrating IoT Sensors – Automate data collection from smart meters and building sensors.
🔹 Expanding KPI Coverage – Include water recycling, waste reduction, or indoor air quality.
🔹 Mobile Optimization – Ensure the dashboard is optimized for tablets and smartphones.
🔹 Automated Alerts – Trigger email or Teams alerts when critical KPIs drop below thresholds.
Best Practices for Using the Green Building KPI Dashboard
-
Define Clear KPIs – Ensure each KPI has a measurable definition and unit.
-
Update Data Regularly – Keep Actuals and Targets updated monthly for accuracy.
-
Standardize KPI Groups – Use consistent naming conventions for better filtering.
-
Leverage Slicers – Filter by month or group to uncover hidden insights.
-
Use Color Coding Wisely – Stick with green/red indicators for easy recognition.
-
Train Users – Conduct training sessions to help staff interpret results correctly.
-
Review Trends, Not Just Snapshots – Combine summary results with trend analysis for long-term planning.
Real-World Applications of the Dashboard
🏢 Corporate Offices – Track energy efficiency, recycling rates, and compliance.
🏭 Manufacturing Plants – Monitor emissions, waste, and resource utilization.
🏫 Educational Institutions – Ensure sustainable campus operations.
🏨 Hospitality Industry – Reduce water and energy consumption across properties.
🌍 Government & NGOs – Measure sustainability efforts in public infrastructure projects.
Conclusion
The Green Building KPI Dashboard in Power BI is a game-changer for organizations aiming to achieve sustainability goals. By integrating data from Excel and visualizing it in Power BI, businesses can monitor KPIs in real time, compare with targets, and take corrective actions before it’s too late.
In today’s world of climate awareness and green certifications, such a dashboard is not just a reporting tool—it is a strategic asset.
Frequently Asked Questions (FAQs)
1. What is a Green Building KPI Dashboard?
It is a Power BI dashboard that tracks sustainability KPIs like energy, water, waste, and compliance for buildings.
2. Can I customize the KPIs in the dashboard?
Yes. You can edit the KPI Definition sheet in Excel to add or remove KPIs.
3. Do I need coding knowledge to use it?
No. The dashboard is user-friendly. You only need to update Excel sheets with actual and target values.
4. How often should I update the data?
Ideally, update it monthly to keep MTD and YTD values accurate.
5. Can this dashboard handle multiple buildings?
Yes. You can include location-based KPIs or add a Building filter in Power BI for portfolio tracking.
6. Is this dashboard suitable for small businesses?
Absolutely. Even small offices can benefit from tracking sustainability KPIs using this tool.
Visit our YouTube channel to learn step-by-step video tutorials