Managing finances in the healthcare sector is no easy task. With increasing operational costs, evolving regulations, and rising patient expectations, healthcare organizations need a precise, real-time method to track their financial performance. This is where the Healthcare Financial Health KPI Dashboard in Excel comes into play.
In this detailed guide, we’ll walk you through everything you need to know about this powerful dashboard. From key features to best practices, we’ve got it all covered to help you gain clear insights and make smarter financial decisions.
Click to Purchases Healthcare Financial Health KPI Dashboard in Excel
What is a Healthcare Financial Health KPI Dashboard?
A Healthcare Financial Health KPI Dashboard is an Excel-based tool designed to monitor, analyze, and visualize critical financial metrics in the healthcare industry. These KPIs (Key Performance Indicators) help stakeholders assess the organization’s financial strength, stability, and overall health.
Whether you’re managing a hospital, clinic, or healthcare group, this dashboard gives you an organized, data-driven way to stay informed and act quickly.
Why Use Excel for Healthcare KPIs?
You might wonder why Excel is still a go-to tool. Here’s why:
- ✅ Familiar Interface: Most users already know how to use Excel.
- ✅ Customizable: Easy to tailor to specific hospital or clinic requirements.
- ✅ Cost-Effective: No need for expensive software subscriptions.
- ✅ Data Control: Keep sensitive financial data within your systems.
Key Features of the Healthcare Financial Health KPI Dashboard
Let’s explore what makes this dashboard both powerful and user-friendly:
Home Sheet
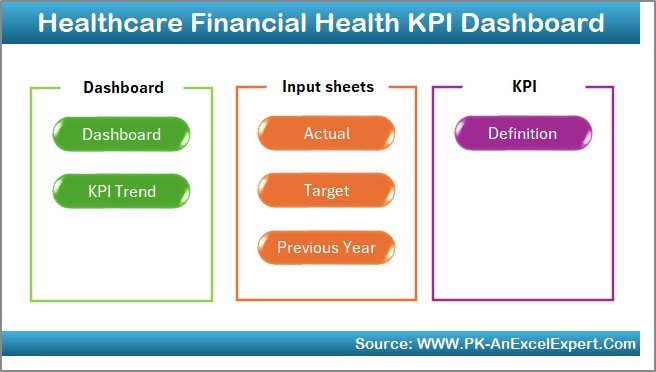
This acts as the central hub. It includes 6 buttons for quick navigation to each sheet. It ensures users can jump to the desired tab without scrolling endlessly.
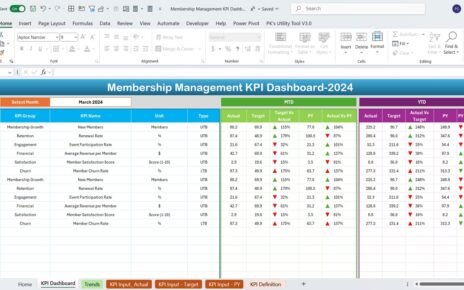
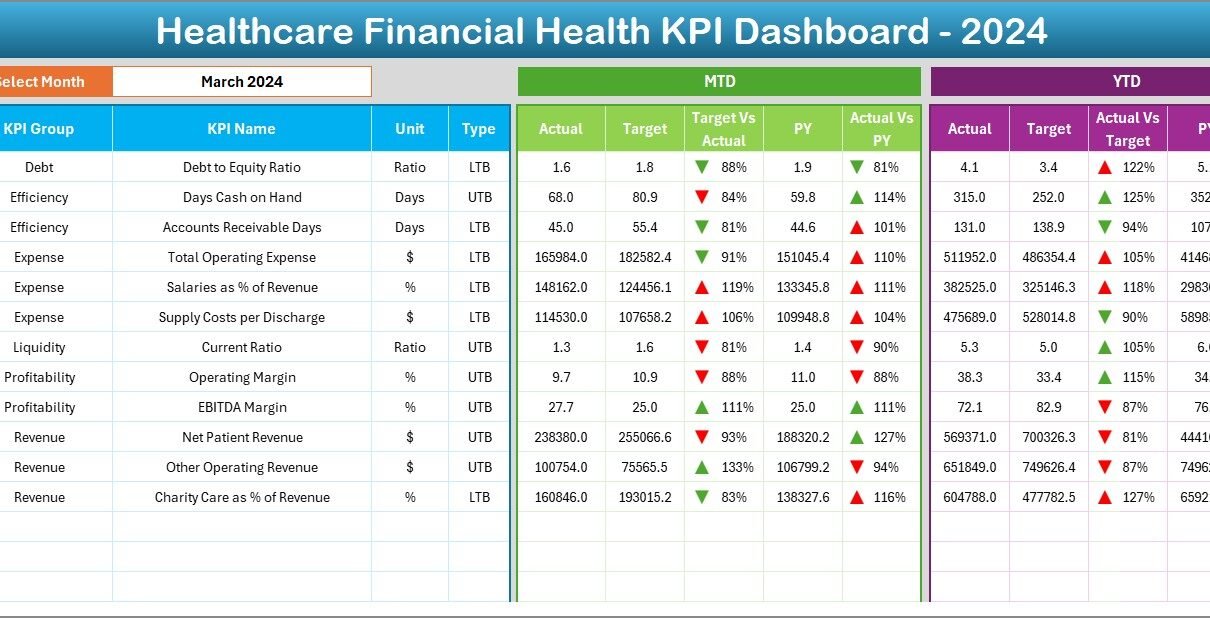
Dashboard Sheet
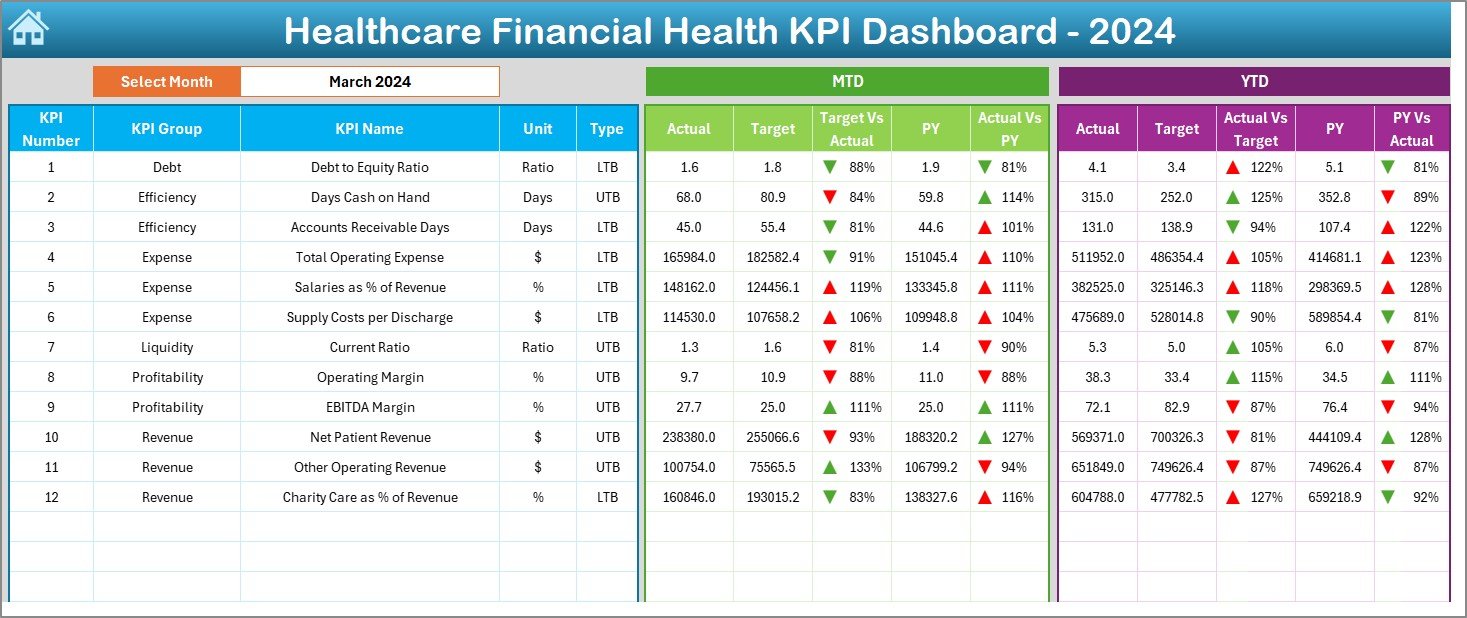
This is the heart of the entire dashboard. You can select any month using the dropdown at cell D3. Once selected, all KPI numbers update instantly. It displays:
- MTD (Month-to-Date) Actual, Target, and Previous Year Data
- YTD (Year-to-Date) Actual, Target, and Previous Year Data
- Conditional formatting using arrows for Target vs Actual and PY vs Actual
KPI Trend Sheet
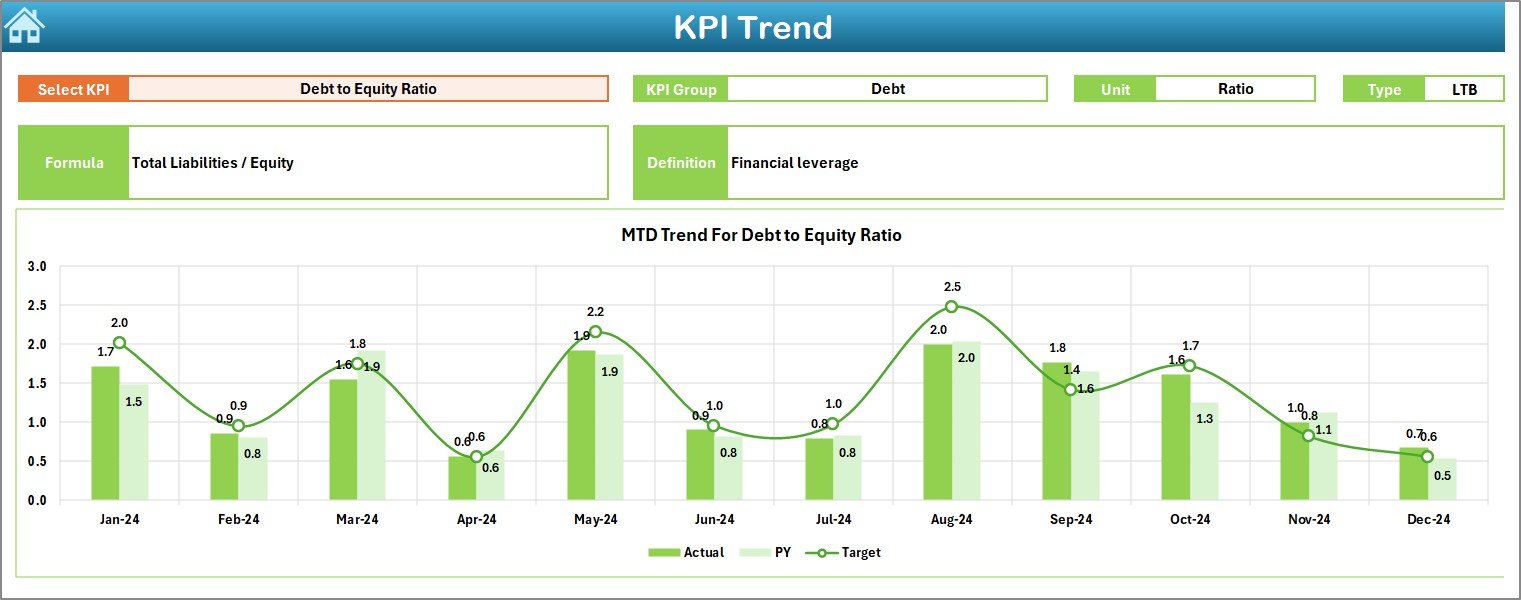
You can select a KPI name from the dropdown (cell C3) to view detailed trends. This sheet includes:
- KPI Group, Unit, Type (LTB/UTB), Formula, and Definition
- Charts showing MTD and YTD values for Actual, Target, and PY data
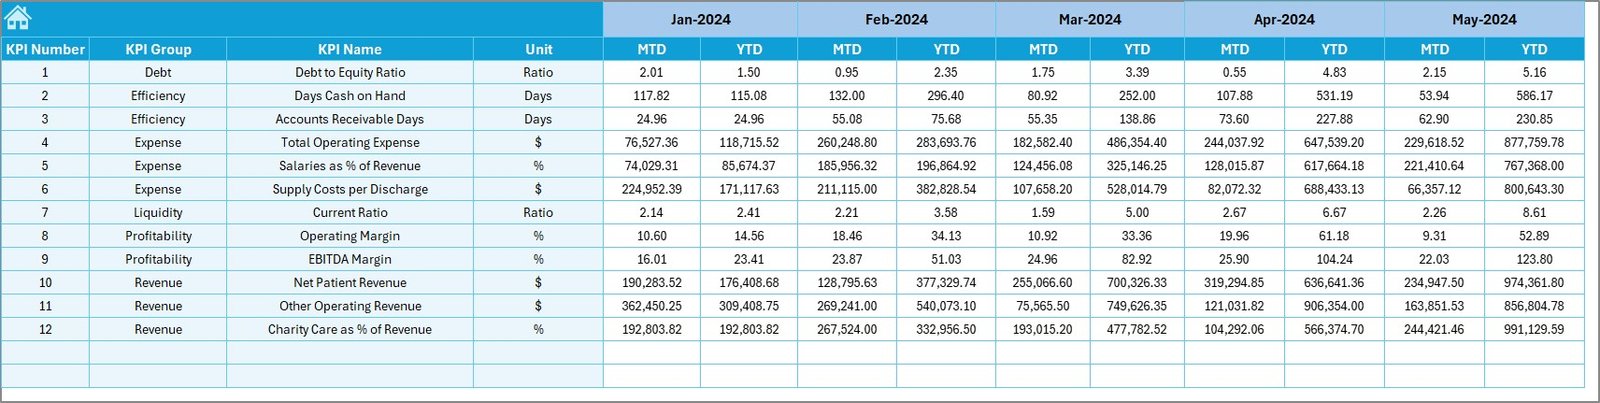
Actual Numbers Input Sheet
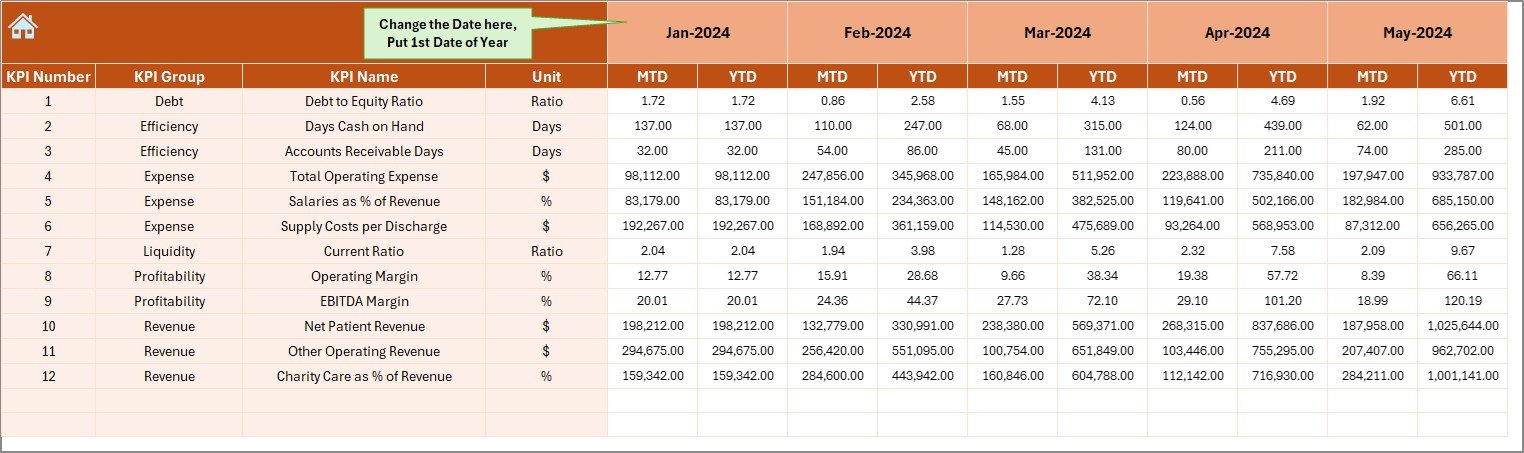
This is where you input monthly actual data. Change the starting month in cell E1, then enter values for each KPI accordingly.
Click to Purchases Healthcare Financial Health KPI Dashboard in Excel
Target Sheet
Use this sheet to enter MTD and YTD target values for each KPI by month. It’s essential for accurate comparisons.
Previous Year Numbers Sheet
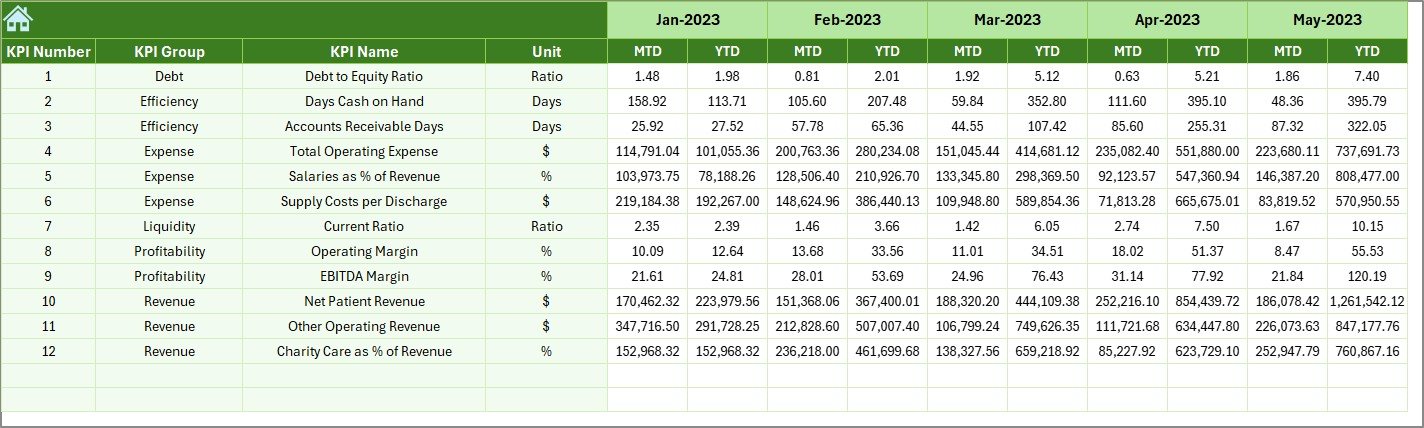
Enter last year’s values to establish a benchmark for financial comparisons.
KPI Definition Sheet
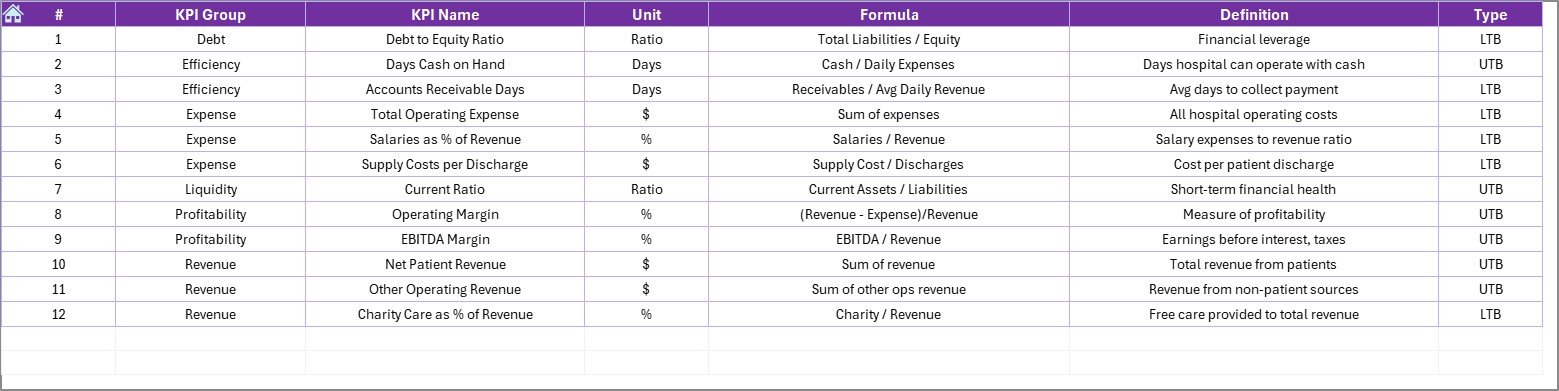
Define all KPIs here with the following details:
- KPI Name
- KPI Group
- Unit of Measure
- Formula
- Short and clear definition
Advantages of Using a Healthcare Financial KPI Dashboard
📊 Real-Time Monitoring
Instantly track how each KPI is performing for the current month and year.
🔍 Better Decision Making
With visual charts and numeric insights, managers can act quickly on underperforming areas.
📆 Historical Comparisons
Compare current performance with the previous year to identify trends.
🤝 Enhanced Collaboration
Everyone from finance teams to department heads can view and align around the same numbers.
📊 KPI-Based Strategy
Focus on what matters most. Use real financial data to drive policy and resource allocation.
Best Practices for the Healthcare Financial Health KPI Dashboard
To get the most out of your dashboard, follow these best practices:
1. Keep Your Data Updated
Enter actuals and targets monthly to ensure the dashboard reflects the latest performance.
2. Use Consistent Units
Stick to one unit type per KPI (e.g., dollars, percentage) to avoid confusion.
3. Train Your Team
Make sure everyone who uses the dashboard knows how to navigate and interpret it.
4. Validate Input Data
Double-check monthly entries to ensure accuracy.
5. Review Trends Monthly
Take time to analyze KPI trends to identify early warning signs or positive improvements.
How to Customize the Dashboard for Your Organization?
Every healthcare organization is different, so here are tips to tailor the dashboard:
- ✅ Add or Remove KPIs: Include KPIs that match your strategic goals.
- ✅ Rename Sheets or Labels: Use terms that your team is familiar with.
- ✅ Create Department Views: Filter by department or unit to drill down.
- ✅ Add Alerts: Use Excel’s conditional formatting to highlight red flags.
How Does This Dashboard Support Healthcare Leaders?
Healthcare leaders must juggle cost-efficiency, care quality, and compliance. This dashboard supports them by:
- Providing a snapshot of financial health in one place
- Helping set and monitor financial targets
- Ensuring data-driven decisions rather than gut-feeling
- Improving transparency and accountability among departments
Conclusion
The Healthcare Financial Health KPI Dashboard in Excel is more than a spreadsheet. It’s a strategic tool that enables hospitals and healthcare providers to measure what matters, monitor performance trends, and make timely improvements. By combining real-time data input with visual insights, this dashboard offers everything healthcare leaders need to stay ahead in a competitive and regulated industry.
Whether you are optimizing costs, tracking revenues, or setting new goals, this dashboard will keep you informed, focused, and ready for action.
Frequently Asked Questions (FAQs)
Q1: What are Healthcare Financial KPIs?
A: These are key metrics that help healthcare providers measure their financial performance. Examples include Net Patient Revenue, Operating Margin, and AR Days.
Q2: Why should I use Excel instead of other BI tools?
A: Excel is flexible, familiar, and cost-effective. It works well for small to mid-size teams and doesn’t require special licenses.
Q3: Can I add new KPIs to the dashboard?
A: Yes! The dashboard is fully customizable. You can add or remove KPIs based on your organization’s needs.
Q4: Is it suitable for multi-location hospitals?
A: Absolutely. You can duplicate the sheets for each branch or use slicers and filters to analyze location-specific data.
Q5: How often should I update the dashboard?
A: Monthly updates are recommended to track both MTD and YTD trends effectively.
Q6: Is the dashboard difficult to use?
A: Not at all. With dropdowns, buttons, and clean navigation, it’s designed for ease of use—even for non-finance users.
Q7: Can I share this dashboard with others?
A: Yes. You can protect data with passwords and share it as a read-only file for transparency without compromising data entry.
Click to Purchases Healthcare Financial Health KPI Dashboard in Excel
Visit our YouTube channel to learn step-by-step video tutorials