Managing performance in the healthcare insurance sector requires precision, transparency, and real-time insights. Whether you are a health insurer, claims manager, or financial analyst, tracking the right Key Performance Indicators (KPIs) is crucial for making data-driven decisions.
That’s where the Healthcare Insurance KPI Scorecard in Excel comes in — a smart, ready-to-use tool that turns complex data into actionable insights. It helps you monitor claim efficiency, policy growth, financial stability, and customer satisfaction — all within a single, interactive Excel environment.
Let’s dive deep into how this scorecard works, its features, advantages, and best practices to help your healthcare insurance organization achieve operational excellence.
Click to Purchases Healthcare Insurance KPI Scorecard in Excel
🔍 What Is a Healthcare Insurance KPI Scorecard in Excel?
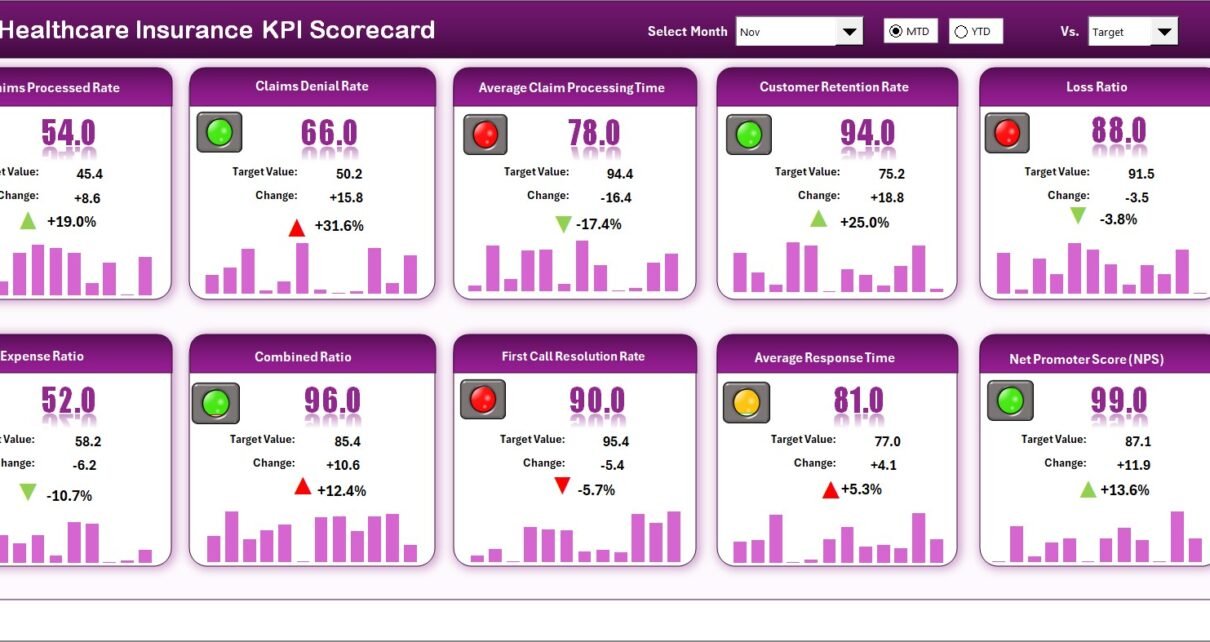
A Healthcare Insurance KPI Scorecard is a performance management tool designed to track and analyze the key metrics that drive success in healthcare insurance operations. Built in Microsoft Excel, this scorecard consolidates all essential KPIs in one place — from claim turnaround time to loss ratios and policy renewal rates.
It provides visual clarity and a structured framework for measuring performance, ensuring that every department aligns with organizational goals. With Excel’s built-in formulas, charts, and conditional formatting, you can analyze performance trends instantly — without relying on expensive BI software.
📊 Key Features of the Healthcare Insurance KPI Scorecard Template
This Excel-based KPI Scorecard includes four structured worksheet tabs, each serving a specific analytical purpose:
1. Scorecard Sheet
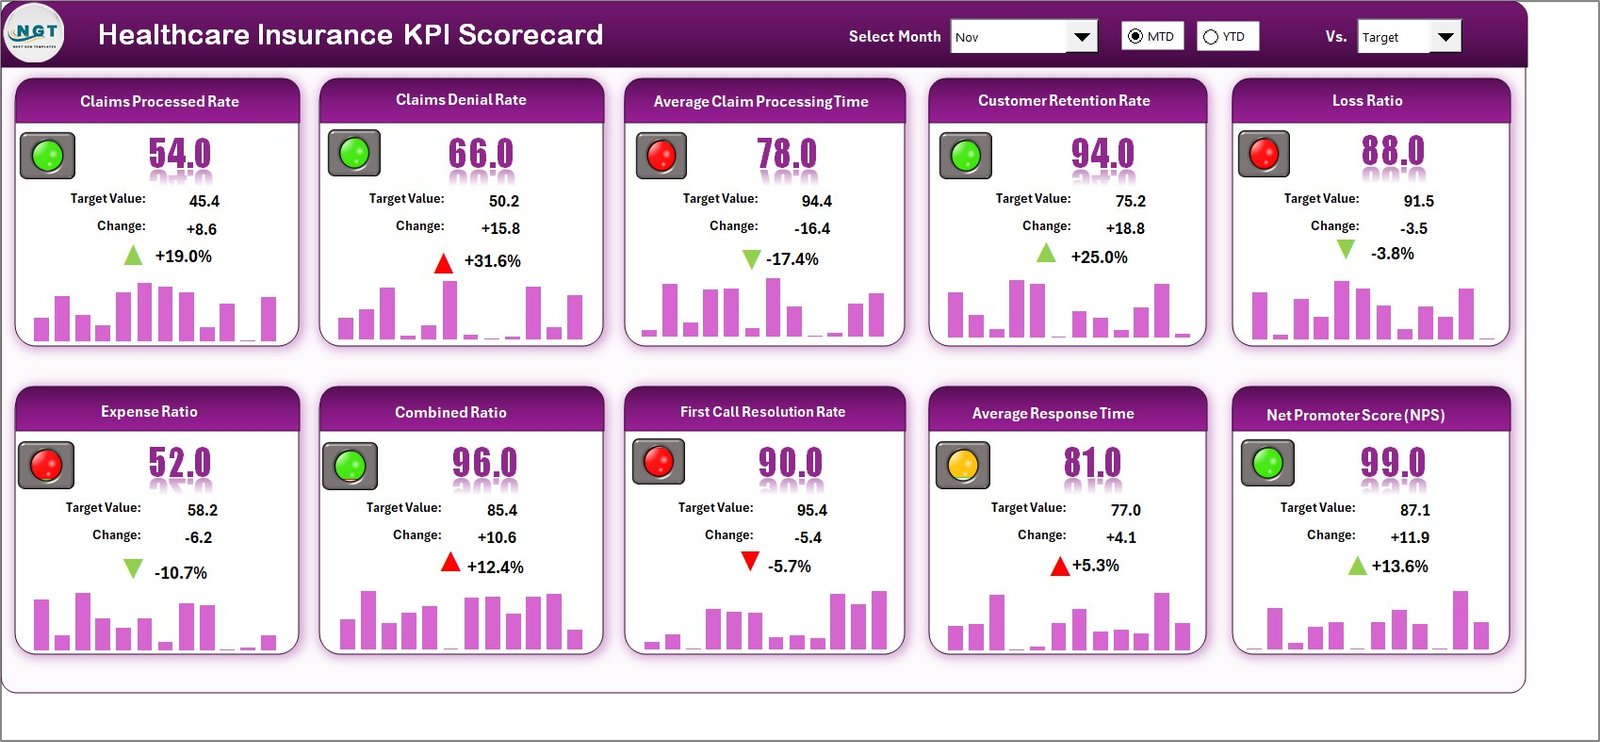
The Scorecard sheet acts as the central dashboard — your command center for performance monitoring.
Key highlights include:
-
✅ Dropdown Menus: Select the desired month, or switch between MTD (Month-to-Date) and YTD (Year-to-Date) performance.
-
📈 Actual vs Target Comparison: Track real performance against defined targets for every KPI.
-
🟩 Visual Indicators: Color-coded formats make it easy to identify strong or weak performance at a glance.
-
📊 Comprehensive Overview: Instantly review all KPIs, including definitions, units, and performance values.
This sheet helps users make fast, informed decisions by showing exactly where improvements or interventions are needed.
2. KPI Trend Sheet
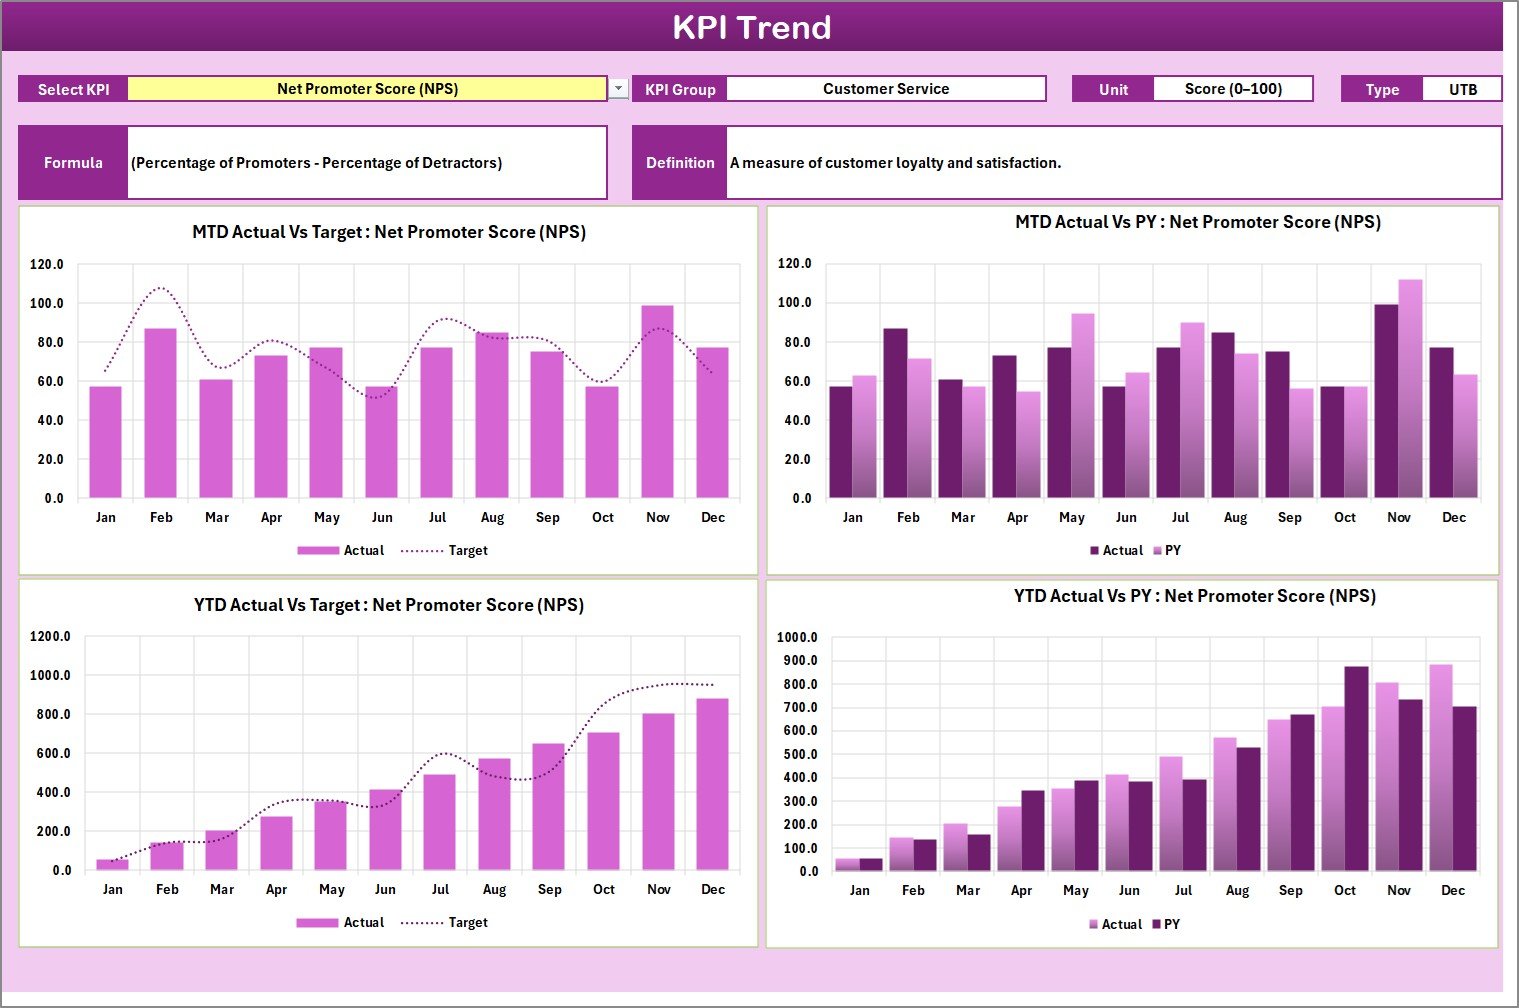
The KPI Trend sheet visualizes progress over time. It adds analytical depth through charts and KPI-level details.
Key features include:
-
📋 KPI Selection: Choose any KPI from a dropdown (cell C3).
-
🔍 KPI Details: Automatically display the KPI Group, Unit, Type (Upper/Lower the Better), Formula, and Definition.
-
📉 Trend Analysis: View interactive trend charts comparing Actual, Target, and Previous Year (PY) data for both MTD and YTD performance.
This view highlights not just where performance stands — but how it evolves month after month.
3. Input Data Sheet
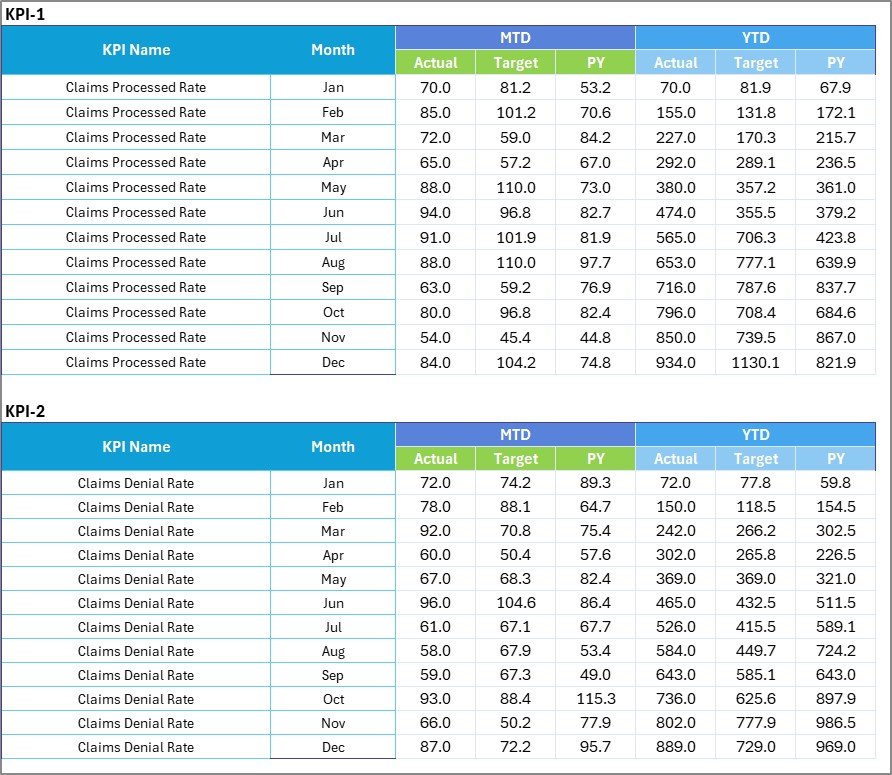
The Input Data sheet is where data entry happens. It allows continuous updating of KPIs without disrupting the scorecard layout.
Key functions:
-
✏️ Easy Data Entry: Record monthly KPI values, targets, and related attributes.
-
🔄 Flexible Updates: Add or modify data easily when new performance figures are available.
-
🧮 Formula Integration: Automatically link input data with Scorecard and Trend sheets for real-time visualization.
This sheet ensures that your scorecard remains dynamic, accurate, and up-to-date.
Click to Purchases Healthcare Insurance KPI Scorecard in Excel
4. KPI Definition Sheet
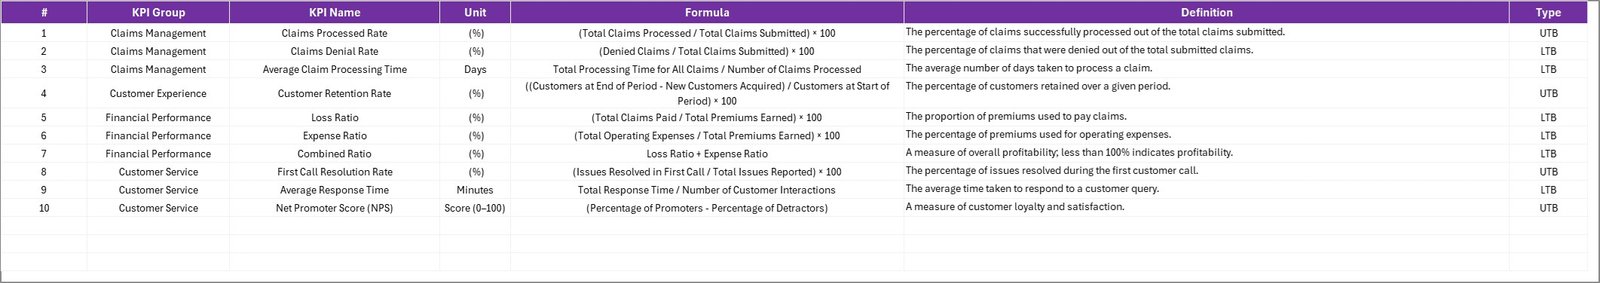
This tab serves as the KPI reference library — defining what each metric means and how it’s calculated.
You can include columns like:
-
KPI Name
-
KPI Group
-
Unit
-
Formula
-
Definition
By maintaining this sheet, you guarantee clarity and standardization across departments, preventing confusion or data misinterpretation.
⚙️ How the Healthcare Insurance KPI Scorecard Works
Using the Healthcare Insurance KPI Scorecard is simple yet powerful:
-
Enter data in the Input Sheet (actuals, targets, and PY values).
-
The Scorecard and Trend Sheets automatically pull that data.
-
Users select a time range or KPI for instant visual insights.
-
Conditional formatting shows green for good, yellow for average, and red for poor performance.
-
MTD and YTD analysis helps identify both short-term trends and long-term consistency.
This structure turns Excel into a full-fledged performance management system — no complex setup or coding required.
💡 Why Use Excel for a Healthcare Insurance Scorecard?
Excel remains one of the most versatile tools for KPI tracking. It’s widely available, easy to customize, and integrates seamlessly with existing systems.
Here’s why Excel is ideal for your scorecard:
-
📊 Built-in charting tools for visualization.
-
🔢 Advanced formulas for MTD, YTD, and variance calculations.
-
💾 No software installation or licensing required.
-
🔗 Easy integration with data sources like CSVs or databases.
-
💼 Suitable for small, medium, or large insurance organizations.
🩺 Essential KPIs to Track in a Healthcare Insurance Scorecard
Tracking the right metrics ensures that your analysis remains focused on what truly matters. Here are some commonly used Healthcare Insurance KPIs:
1. Claim Turnaround Time
Measures the average time to process and settle a claim.
Formula: Total Processing Days ÷ Total Claims
Goal: Lower is better.
2. Claim Approval Rate (%)
Percentage of total claims approved within the review process.
Formula: (Approved Claims ÷ Total Claims) × 100
Goal: Higher is better.
3. Claim Denial Rate (%)
Tracks the percentage of claims denied due to incomplete or invalid data.
Formula: (Denied Claims ÷ Total Claims) × 100
Goal: Lower is better.
4. Loss Ratio (%)
Compares claim costs to earned premiums.
Formula: (Claims Paid ÷ Premiums Earned) × 100
Goal: Maintain below 80% for healthy profitability.
5. Policy Renewal Rate (%)
Measures the percentage of customers renewing their health insurance policies.
Formula: (Renewed Policies ÷ Expiring Policies) × 100
Goal: Higher is better.
6. Customer Satisfaction Score (CSAT)
Reflects how satisfied policyholders are with claim services.
Formula: (Positive Feedback ÷ Total Feedback) × 100
Goal: Aim for 85% or above.
7. Expense Ratio (%)
Monitors administrative and operational expenses relative to earned premiums.
Formula: (Operating Expenses ÷ Premiums Earned) × 100
Goal: Lower is better.
8. Premium Growth Rate (%)
Tracks growth in earned premiums compared to the previous period.
Formula: ((Current Premium − Previous Premium) ÷ Previous Premium) × 100
Goal: Higher indicates positive growth.
These KPIs combine financial, operational, and customer-centric perspectives, ensuring a 360-degree performance view.
🌟 Advantages of Healthcare Insurance KPI Scorecard in Excel
Implementing a KPI scorecard provides immense value to healthcare insurers.
✅ 1. Real-Time Performance Insights
Instantly analyze your claim and policy performance using dynamic visuals and charts.
✅ 2. Improved Decision-Making
Decision-makers can compare actual vs target values, helping prioritize areas that need attention.
✅ 3. Easy Customization
Add or remove KPIs as your organization evolves — Excel’s flexibility supports full personalization.
✅ 4. Cost-Effective Solution
No additional tools or licenses are required; Excel provides everything you need for professional analysis.
✅ 5. Enhanced Accountability
Each department’s performance becomes measurable and transparent, improving responsibility across teams.
✅ 6. Trend Visualization
Identify long-term patterns through MTD and YTD charts to forecast future performance accurately.
✅ 7. Data Integrity and Standardization
The KPI Definition sheet ensures consistent formulas and interpretations across users.
✅ 8. Ease of Sharing
Excel files are portable and easy to share with management, auditors, or team members.
Click to Purchases Healthcare Insurance KPI Scorecard in Excel
🚀 How to Customize the Healthcare Insurance KPI Scorecard
Customization helps align the scorecard with your organization’s unique structure.
Follow these steps:
-
Update KPI definitions to match company standards.
-
Add business-specific metrics such as Claim Cost per Employee or Average Hospitalization Duration.
-
Modify color coding or visual formats for your brand.
-
Create additional charts for department-wise or regional analysis.
-
Link Excel with your internal database or ERP system for automated updates.
With minimal effort, the template becomes a powerful business-specific analytics tool.
🧭 Best Practices for the Healthcare Insurance KPI Scorecard
To maximize results, follow these best practices when using your Excel scorecard:
1. Define Clear KPI Ownership
Assign each KPI to a specific department or manager to ensure accountability.
2. Set SMART Targets
Every KPI target must be Specific, Measurable, Achievable, Relevant, and Time-bound.
3. Automate Data Updates
Use Excel formulas or links to auto-fetch monthly data, reducing manual errors.
4. Review Data Monthly
Analyze MTD and YTD results regularly to stay on track with business goals.
5. Visualize the Data
Leverage conditional formatting, bar charts, and trend lines for easy interpretation.
6. Ensure Data Accuracy
Cross-verify inputs before updating the scorecard to maintain reliability.
7. Keep Stakeholders Informed
Share updated scorecards with senior management to support strategic decisions.
8. Monitor KPI Relevance
Periodically review your KPIs to ensure they align with current business priorities.
By adopting these practices, you transform the scorecard from a static file into a living performance management system.
📈 Example Analysis Using the Scorecard
Let’s consider a practical example.
If the Claim Denial Rate has increased in the last three months, the Trend sheet will immediately show this negative trend.
Management can drill down into specific causes — whether it’s incomplete documents, inaccurate policy data, or provider issues.
Similarly, if Customer Satisfaction improves following process automation, the scorecard visualizes this success with green indicators and rising trend lines.
Such insights make continuous improvement possible without manual effort.
🧠 How This Scorecard Supports Decision-Making
The Healthcare Insurance KPI Scorecard bridges the gap between data and decisions.
It empowers management to:
-
Identify underperforming areas before they escalate.
-
Track profitability through loss and expense ratios.
-
Improve claim efficiency and customer retention.
-
Allocate resources effectively based on data insights.
-
Present visual performance summaries during board meetings.
When used consistently, the scorecard becomes an integral part of operational strategy.
Click to Purchases Healthcare Insurance KPI Scorecard in Excel
🪄 Tips to Make the Most Out of Your KPI Scorecard
📌 Use Excel slicers to filter data by region, month, or department.
🔍 Add dynamic charts that update automatically when new data is entered.
🧩 Incorporate variance columns (Actual – Target) for deeper analysis.
💬 Include comments or action items for each KPI row.
📅 Maintain a version history to track improvements over time.
🏁 Conclusion
The Healthcare Insurance KPI Scorecard in Excel is more than just a reporting tool — it’s a complete performance management framework.
It helps insurers and administrators monitor efficiency, reduce costs, improve service quality, and ensure compliance. With interactive visuals, standardized KPIs, and flexible customization, this template brings clarity and control to complex healthcare insurance operations.
By consistently updating and reviewing your KPIs, you ensure that every decision is backed by real-time data and strategic insight.
Click to Purchases Healthcare Insurance KPI Scorecard in Excel
❓ Frequently Asked Questions (FAQs)
1. What is a Healthcare Insurance KPI Scorecard?
It’s an Excel-based performance monitoring tool that tracks and visualizes key insurance metrics such as claim approval rate, loss ratio, and policy renewal rate.
2. Who can use this KPI Scorecard?
It’s ideal for insurance companies, brokers, claims departments, and financial analysts managing healthcare insurance data.
3. How often should the scorecard be updated?
You should update it monthly to maintain accuracy and relevance for MTD and YTD analysis.
4. Can I add my own KPIs?
Yes, the template is fully customizable — you can add new KPIs or modify existing ones as needed.
5. Is Excel sufficient for KPI tracking?
Yes, Excel offers formulas, charts, and data validation tools, making it a cost-effective alternative to Power BI or Tableau for many organizations.
6. What kind of charts are used in the scorecard?
Typically, bar charts, line charts, and conditional color indicators are used to visualize trends and performance.
7. How does it support strategic decision-making?
The scorecard highlights trends and variances, enabling leaders to take timely corrective actions.
8. Can the scorecard integrate with other systems?
Yes, you can link Excel to databases, CSV files, or cloud data sources for automated updates.
9. What are the major benefits of using this scorecard?
It simplifies reporting, enhances accountability, supports data-driven decisions, and improves overall operational transparency.
10. Where can I get this ready-to-use template?
You can download the Healthcare Insurance KPI Scorecard in Excel directly from NextGenTemplates.com — your trusted source for professional business dashboards and templates.
Click to Purchases Healthcare Insurance KPI Scorecard in Excel
Visit our YouTube channel to learn step-by-step video tutorials