In today’s fast-paced healthcare industry, effective inventory management plays a critical role in maintaining seamless operations and delivering quality patient care. From medication stocks to medical equipment, tracking supplies accurately ensures no delays in treatment or operational disruptions. To streamline this process, we have designed a Healthcare Inventory Management KPI Dashboard in Excel—a powerful, ready-to-use solution that simplifies monitoring and decision-making.
This comprehensive guide will walk you through the features, benefits, and best practices of using the Excel-based Healthcare Inventory KPI Dashboard. Additionally, we will explore how you can leverage its insights to improve efficiency and cut down unnecessary inventory costs.
What Is a Healthcare Inventory Management KPI Dashboard?
A Healthcare Inventory Management KPI Dashboard is a centralized tool used to track and monitor inventory-related performance indicators within a healthcare organization. Built using Excel, this dashboard helps healthcare administrators and supply chain managers visualize critical data such as stock levels, inventory turnover, reorder rates, and wastage.
Click to Purchases Healthcare Inventory Management KPI Dashboard in Excel
By using this dashboard, users can:
-
View MTD (Month-To-Date) and YTD (Year-To-Date) performance.
-
Monitor targets vs actuals and previous year comparisons.
-
Analyze trends through charts.
-
Improve inventory planning and forecasting.
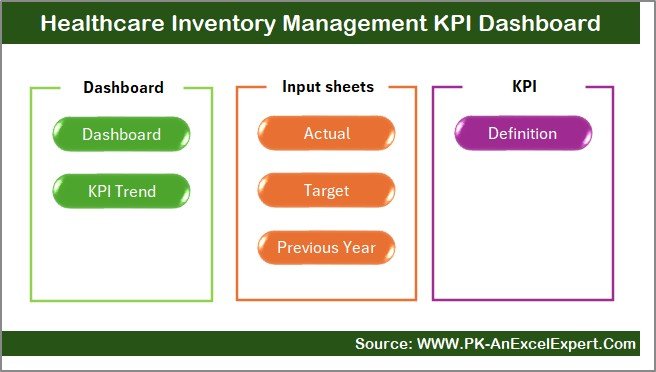
What’s Included in the Dashboard?
The dashboard consists of 7 dynamic worksheet tabs that together offer a seamless experience for data entry, analysis, and reporting. Let’s explore each component.
Home Sheet
This is the main index of the dashboard. It includes 6 navigation buttons that allow users to quickly jump to relevant sheets. Think of it as your personal control panel for smooth access.
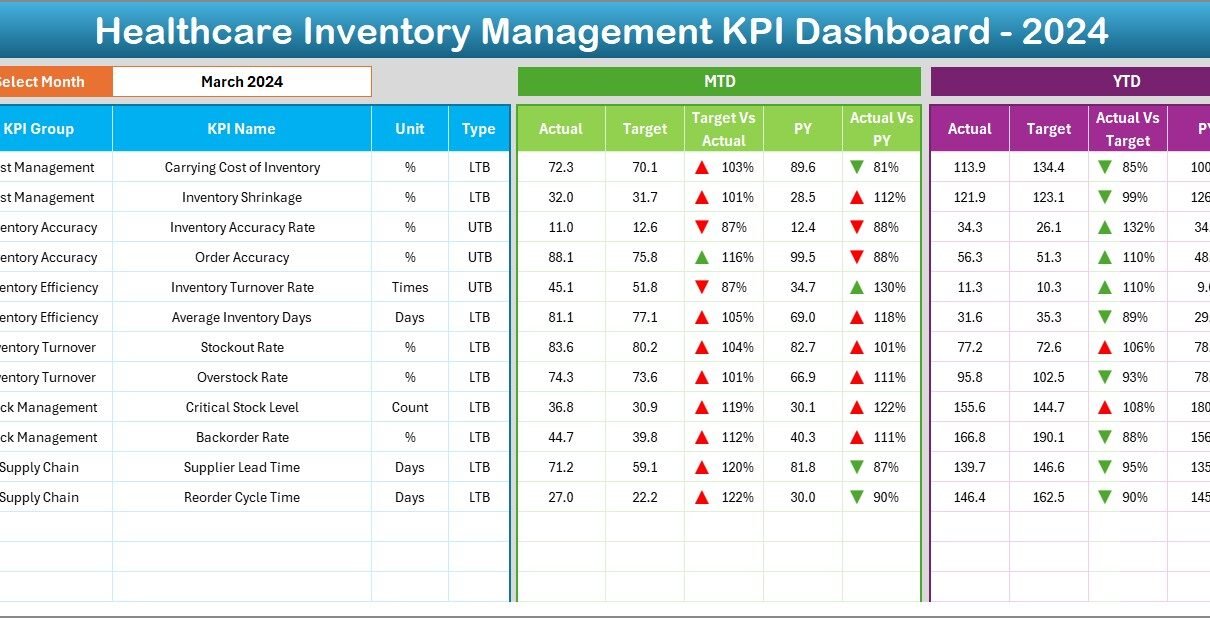
Dashboard Sheet Tab
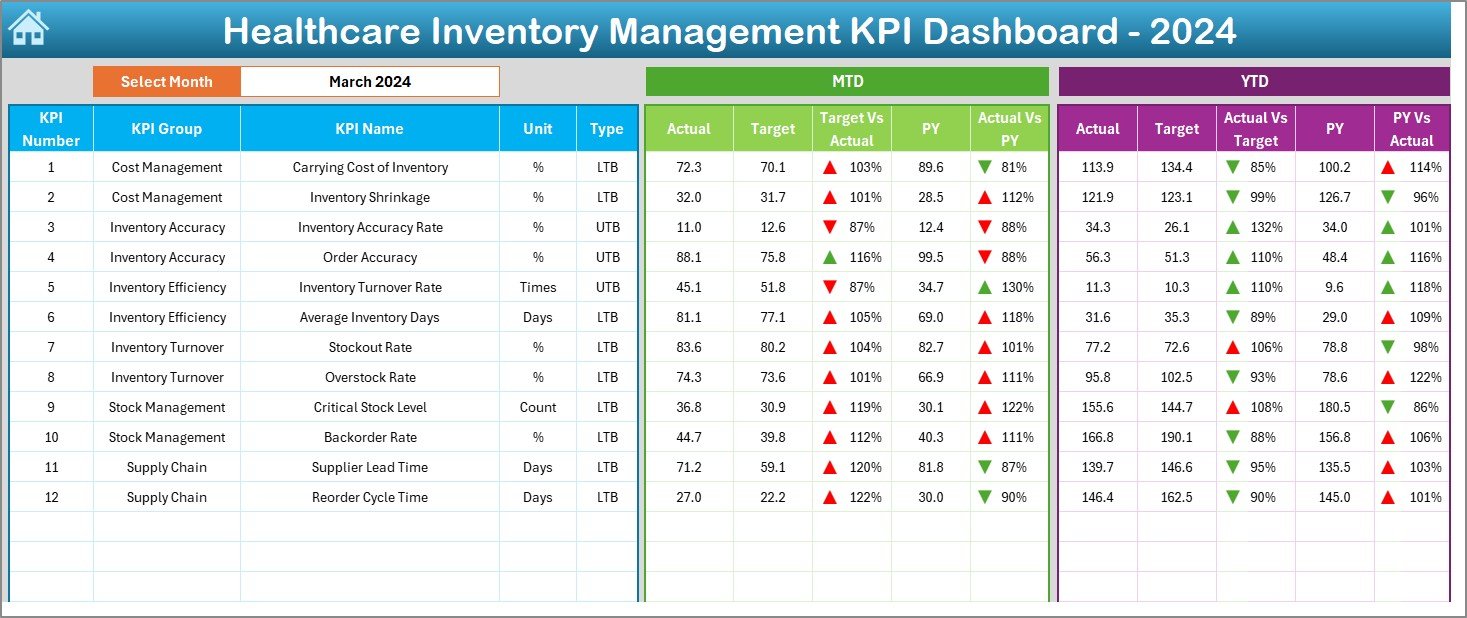
This is the heart of the KPI Dashboard. You can select a month from the dropdown in cell D3 to view performance metrics for that specific period.
The sheet displays:
-
MTD Actual vs Target vs Previous Year
-
YTD Actual vs Target vs Previous Year
-
Conditional formatting with up and down arrows to highlight positive or negative trends
This visual representation ensures that performance insights are easy to digest.
KPI Trend Sheet Tab
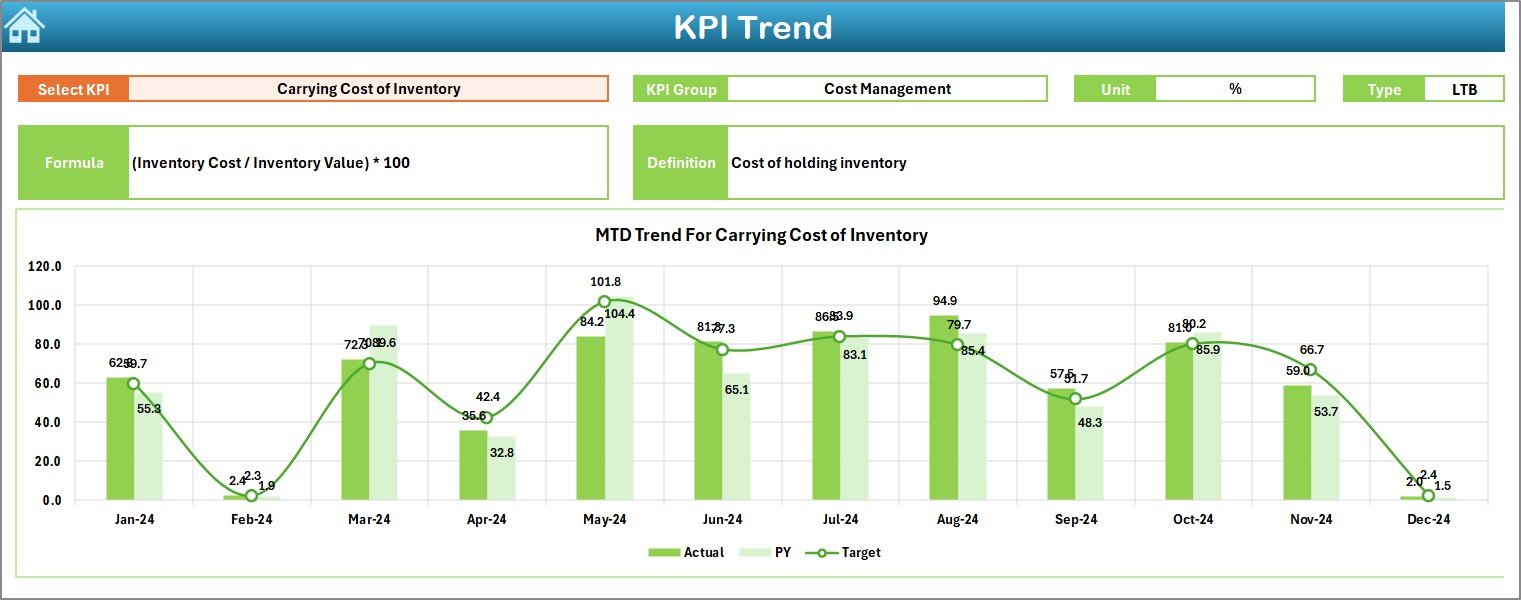
This sheet lets you dive deep into individual KPIs. You can select any KPI name from the dropdown in cell C3 to view:
-
KPI Group
-
Unit of measurement
-
Type (LTB: Lower the Better or UTB: Upper the Better)
-
Formula used
-
Short definition
You will also find MTD and YTD trend charts comparing Actual, Target, and Previous Year values—perfect for tracking performance over time.
Click to Purchases Healthcare Inventory Management KPI Dashboard in Excel
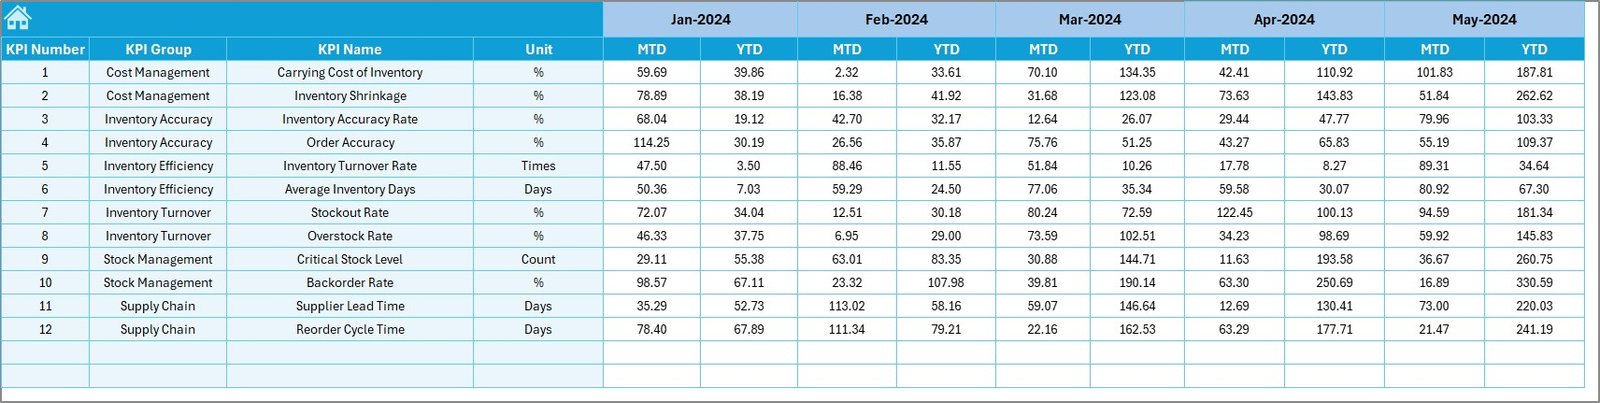
Actual Numbers Input Sheet
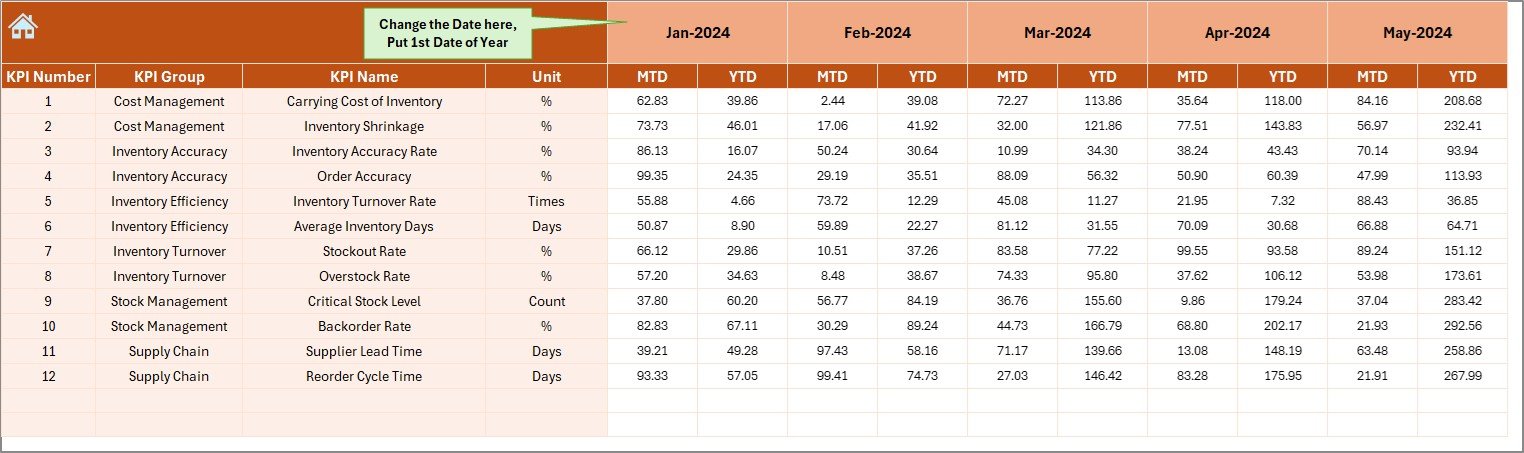
This sheet is used to manually enter inventory performance numbers. You can change the fiscal start month in cell E1, then fill in MTD and YTD values for each KPI accordingly.
Target Sheet Tab
Here, you can input target numbers for every KPI. These targets can be set monthly (MTD) or on a cumulative basis (YTD).
Previous Year Number Sheet
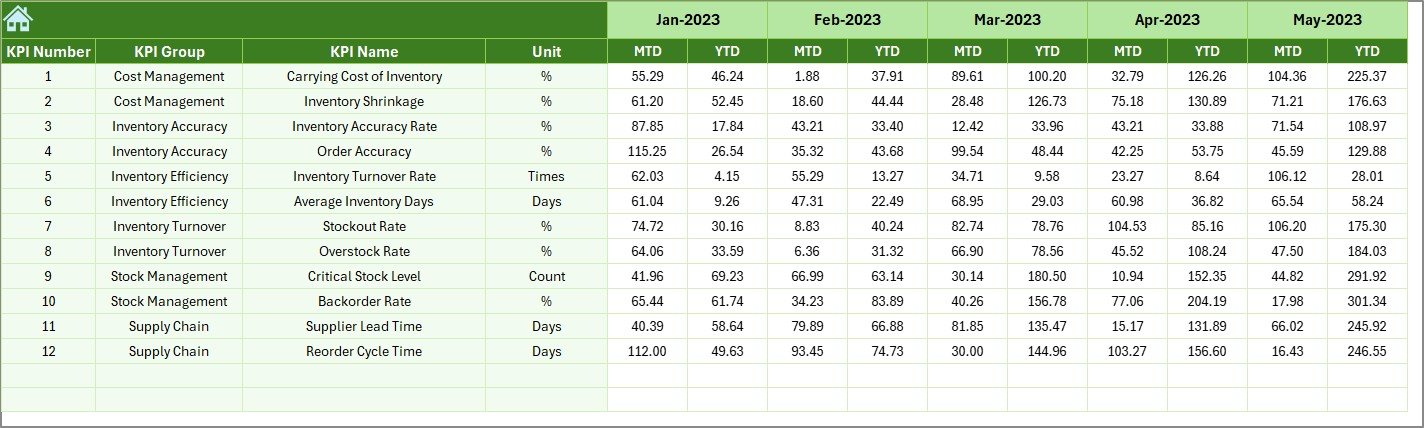
This sheet holds historical performance data for benchmarking and analysis. It mirrors the structure of the actual and target sheets to enable seamless comparisons.
KPI Definition Sheet Tab
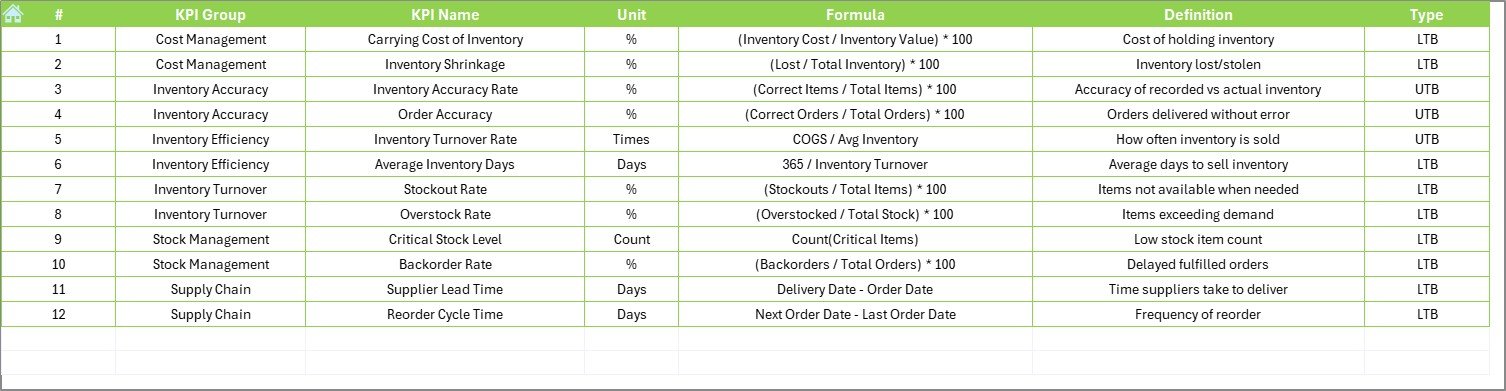
All KPIs used in the dashboard are defined here. For each KPI, this sheet contains:
-
KPI Name
-
KPI Group
-
Unit
-
Formula
-
Definition
This acts as a reference point for users and ensures consistency in data interpretation.
Advantages of Using a Healthcare Inventory Management KPI Dashboard
Now that you know what the dashboard contains, let’s explore the core benefits:
📦 Improved Inventory Visibility
You can view real-time performance of essential KPIs, helping you monitor stock levels, usage, and wastage with precision.
🔄 Enhanced Forecasting
With historical trends and target comparisons, forecasting future inventory needs becomes easier and more accurate.
💡 Data-Driven Decisions
Instead of guessing, you now make strategic decisions based on actual data and defined goals.
💰 Cost Reduction
By identifying overstocked or underutilized items, you can significantly reduce unnecessary spending.
📊 Trend Analysis Over Time
MTD and YTD trend charts help you spot patterns and anomalies—empowering you to take corrective actions early.
Best Practices for Using the KPI Dashboard Effectively
To get the most out of this Excel dashboard, follow these best practices:
1. Update Data Regularly
Make it a habit to update actual numbers at the end of every month. This will ensure accurate insights.
2. Set Realistic Targets
Use historical data and team input to set achievable monthly and yearly goals for each KPI.
3. Benchmark with Previous Year
Always compare current numbers with the previous year to track growth or areas of concern.
4. Keep KPI Definitions Updated
Ensure that everyone understands what each KPI means. Keep definitions simple and accessible in the dedicated tab.
5. Leverage Conditional Formatting
Use the color-coded arrows and indicators to immediately spot areas needing attention.
This dashboard is highly versatile and can be used by:
-
Hospital inventory managers
-
Healthcare supply chain teams
-
Clinic and pharmacy administrators
-
Procurement professionals
-
Biomedical engineering departments
Whether you’re running a small clinic or a large hospital network, this tool simplifies your reporting and inventory decisions.
Why Use Excel for Inventory Management KPIs?
You might wonder, “Why Excel?”
Here’s why:
-
🖥 Excel is readily available and widely used
-
📈 It supports dynamic charts and formulas
-
🧮 You can customize everything without coding
-
🔒 Easily protect and share the file across departments
-
💸 Most importantly—no recurring cost!
So, Excel offers flexibility and affordability—making it an ideal tool for healthcare organizations.
How to Customize the Dashboard for Your Needs
Even though the dashboard is ready to use, you can easily modify it. Here’s how:
-
Add or Remove KPIs: Just update the KPI Definition and other sheets accordingly
-
Change Color Themes: Use Excel’s conditional formatting and theme settings
-
Link to External Data: Use Power Query to pull data from your ERP system or databases
-
Add More Departments: Expand rows to track department-wise inventory KPIs
This dashboard grows with your needs!
Conclusion
Managing healthcare inventory efficiently is not just about counting supplies—it’s about tracking performance, reducing waste, and improving patient care. Our Healthcare Inventory Management KPI Dashboard in Excel simplifies this complex task through its intuitive design and data-driven insights.
❓ Frequently Asked Questions (FAQs)
1. Can I use this dashboard for multiple departments in a hospital?
Yes, you can add department-wise KPIs or create separate sheets to manage them independently.
2. Is this dashboard compatible with older versions of Excel?
Absolutely. It works with Excel 2010 and above. Some dynamic features may perform best in Excel 2016+.
3. How often should I update the actual numbers?
Ideally, at the end of every month. This ensures that MTD and YTD values reflect the most current performance.
4. Can I add my own KPIs to the dashboard?
Yes! You can easily update the KPI Definition, Actual, Target, and Previous Year sheets with new KPIs.
5. What if I want to add automation or buttons?
You can enhance the dashboard using Excel VBA, macros, or form controls to streamline inputs and reports.
6. Does it require any training to use?
Not at all. The dashboard is designed for easy use with dropdowns, charts, and labeled tabs for intuitive navigation.
Visit our YouTube channel to learn step-by-step video tutorials