In today’s rapidly evolving healthcare industry, expanding into new markets isn’t just about launching services—it’s about making smart, data-driven decisions. That’s where a Healthcare Market Expansion KPI Dashboard in Excel becomes an essential tool.
Whether you’re managing a hospital chain, opening a new clinic, or launching new services in underserved areas, this dashboard helps you monitor and evaluate key performance indicators (KPIs) that matter most to your growth journey.
Let’s dive into how this dashboard can help streamline your market expansion plans.
Click to Purchases Healthcare Market Expansion KPI Dashboard in Excel
What Is a Healthcare Market Expansion KPI Dashboard?
A Healthcare Market Expansion KPI Dashboard is an Excel-based tool designed to track, visualize, and evaluate performance metrics specific to expanding healthcare services into new regions or markets.
This dashboard makes it easy to compare actuals with targets, assess progress against previous years, and analyze trends month-over-month or year-to-date—all in one interactive interface.
Key Features of the Dashboard
The dashboard is spread across 7 well-structured worksheet tabs, each serving a specific function:
Home Sheet
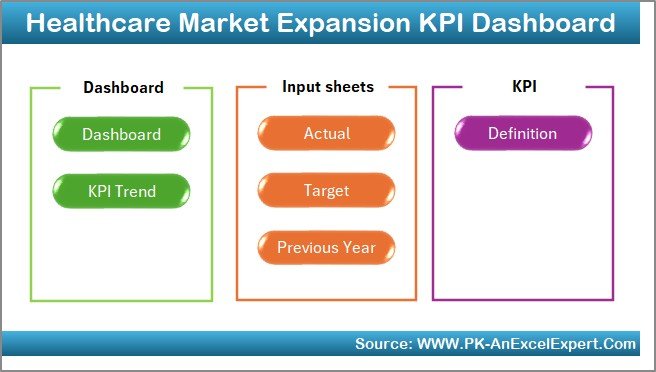
This acts as your command center. It includes 6 navigation buttons to help you instantly jump to any part of the dashboard.
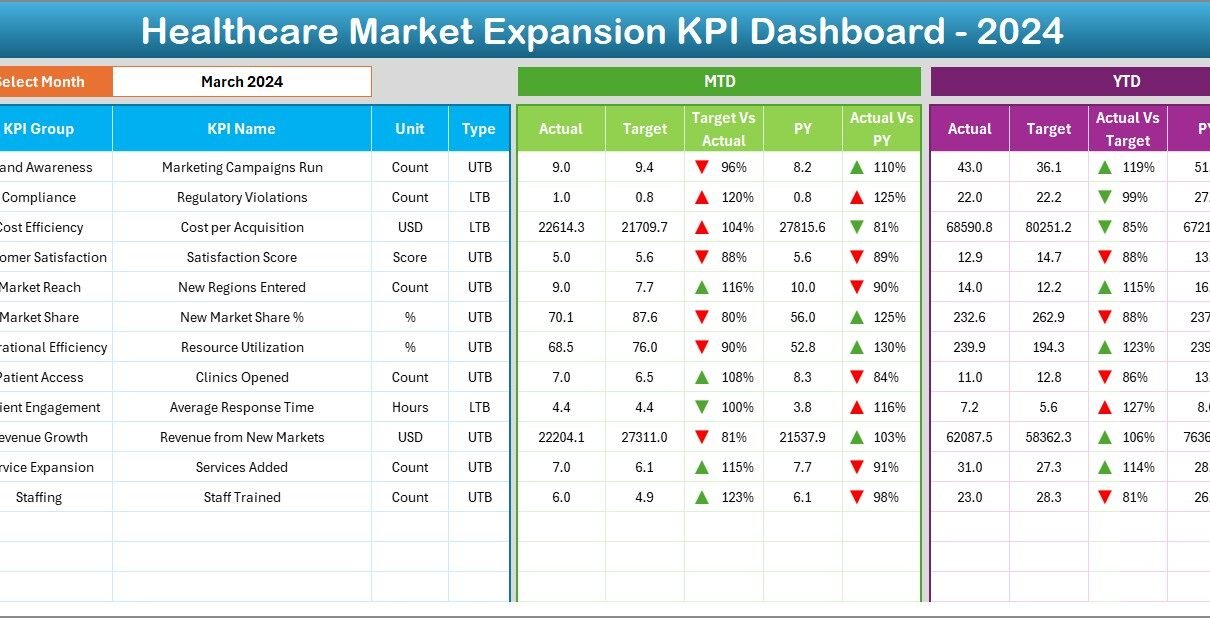
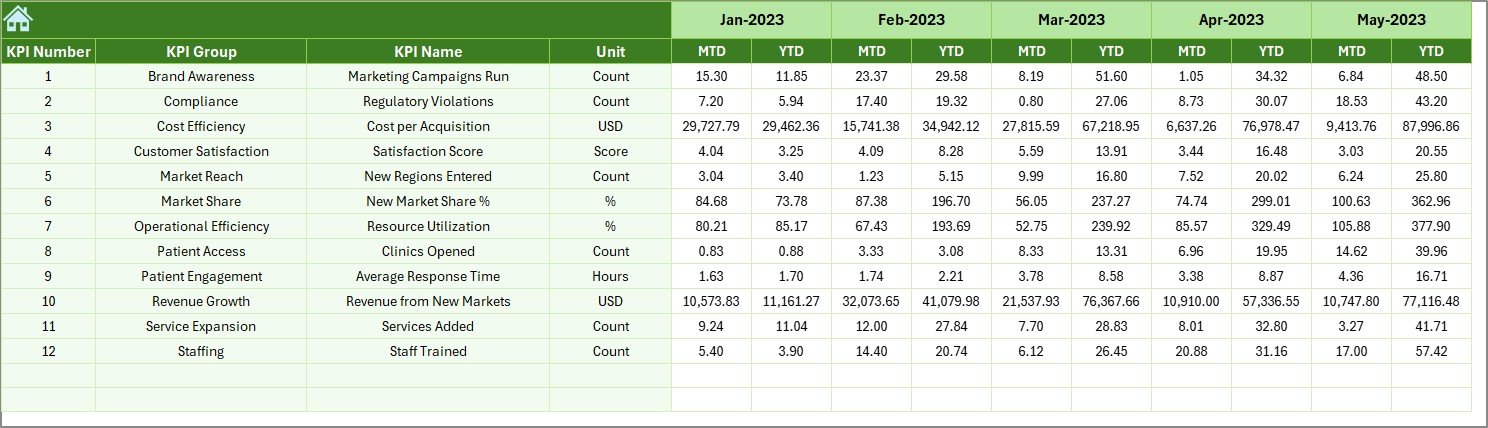
Dashboard Sheet Tab
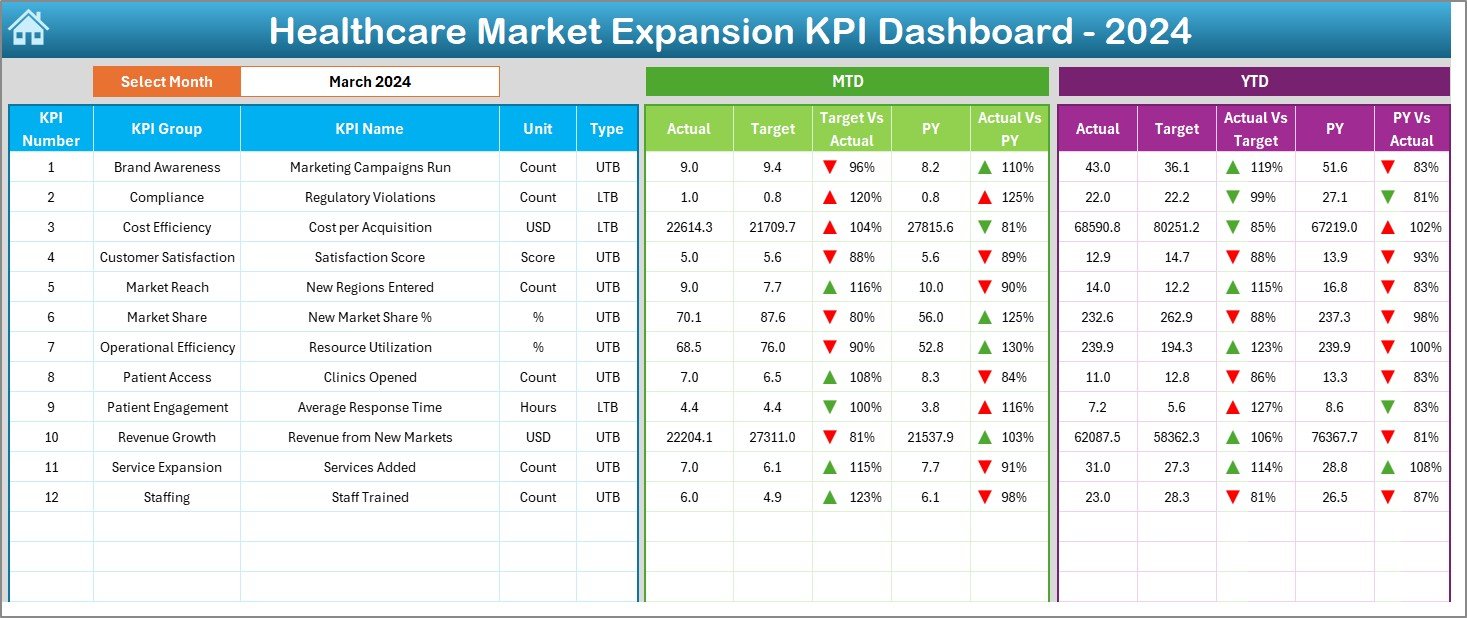
This is the heart of the dashboard. Here, you can:
-
Select the month from a drop-down in cell D3
-
Instantly view all KPI metrics for that month
-
See MTD (Month-to-Date) and YTD (Year-to-Date) values
-
Compare Actual vs Target and Actual vs Previous Year with conditional formatting arrows that visually indicate performance
KPI Trend Sheet
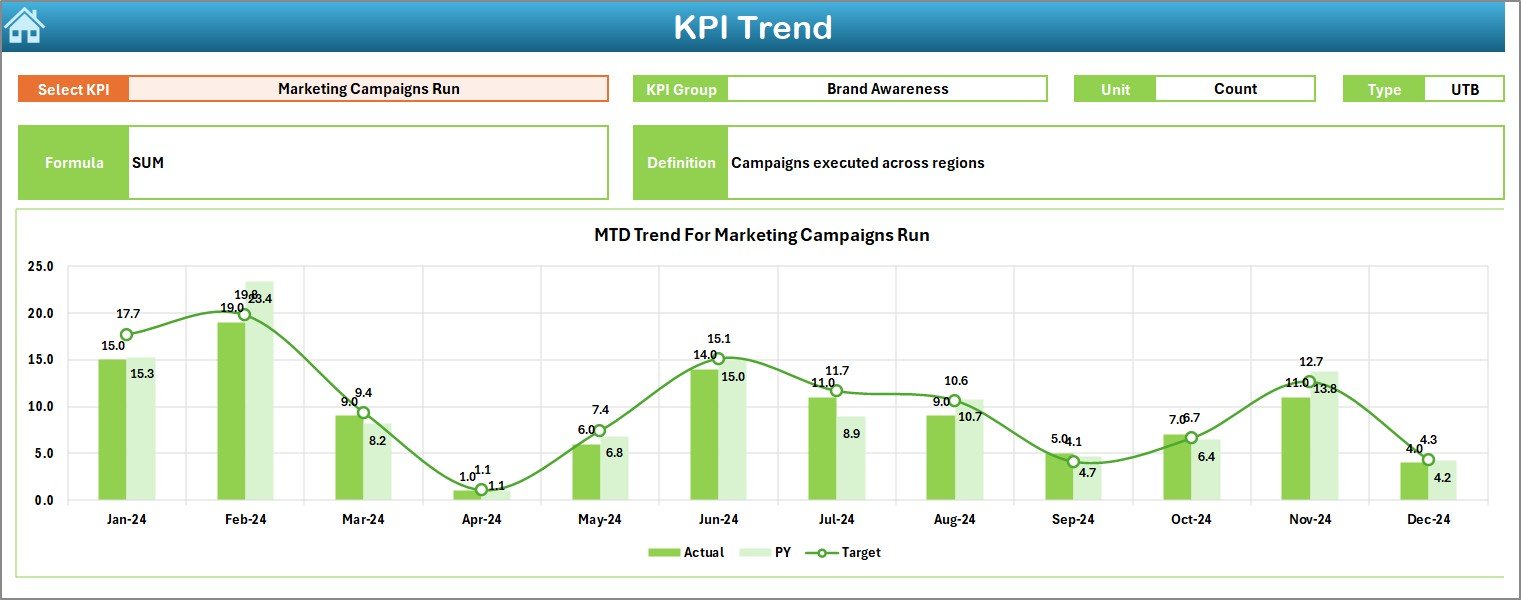
Want to zoom in on a specific KPI? Select it from a drop-down in cell C3 and:
-
View detailed KPI information (group, unit, type, formula, definition)
-
Explore MTD and YTD trend charts for actuals, targets, and previous year numbers
Actual Numbers Input Sheet
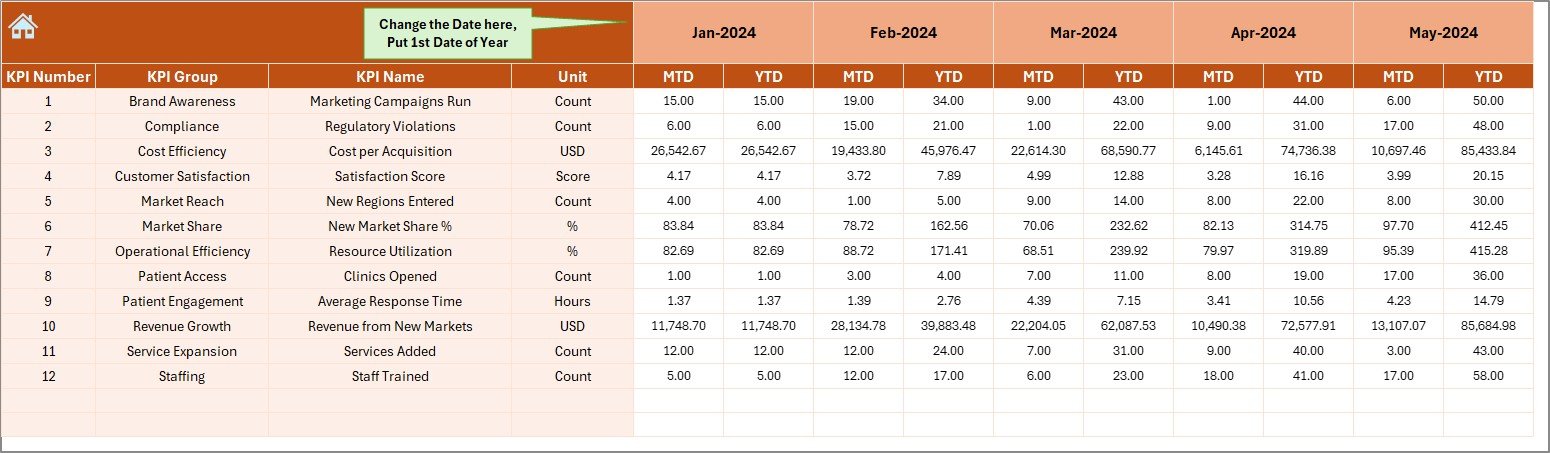
Input your actual performance data for both MTD and YTD. Simply set the start month in cell E1, and the sheet auto-adjusts accordingly.
Target Sheet Tab
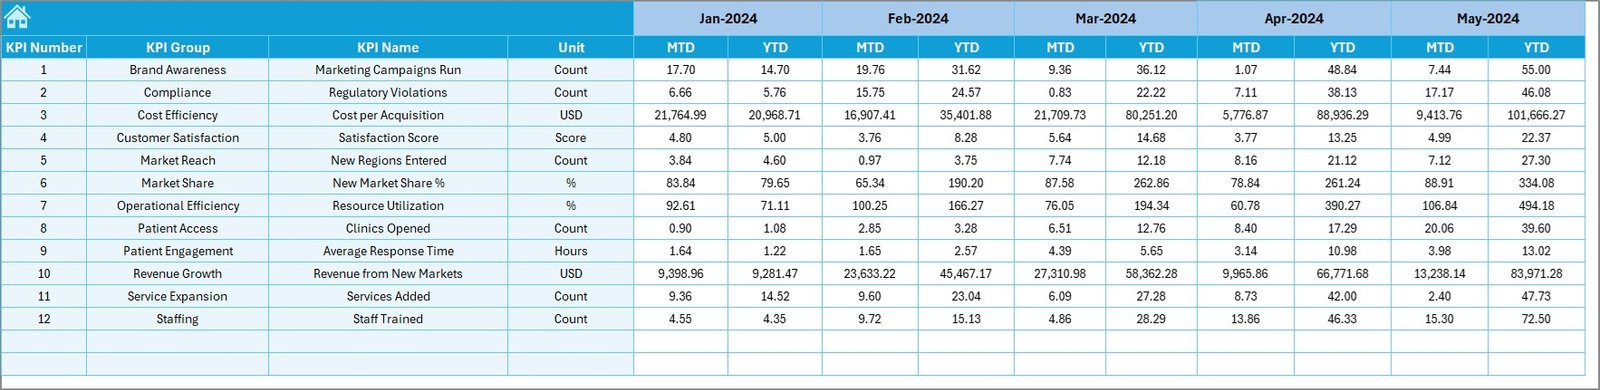
Manually input monthly target values for each KPI—both MTD and YTD—allowing for easy tracking and alignment with strategic goals.
Previous Year Numbers Sheet
Record last year’s numbers here for effective year-over-year comparison, which helps in evaluating growth and spotting trends.
KPI Definition Sheet
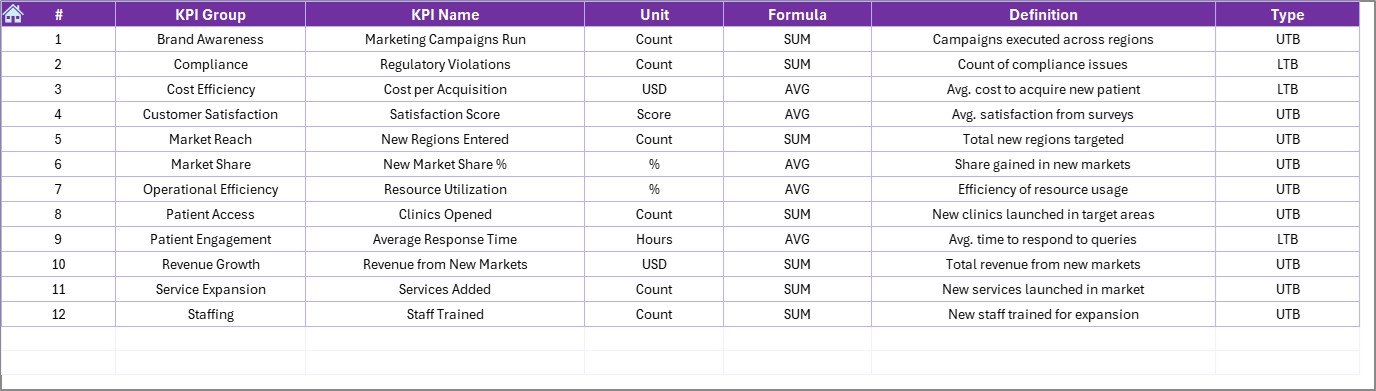
This tab documents:
-
KPI Name
-
KPI Group
-
Unit of Measure
-
Formula
-
Short definition
It ensures everyone on your team clearly understands the meaning and relevance of each KPI.
Advantages of Using the Healthcare Market Expansion KPI Dashboard
Using this Excel dashboard provides several critical advantages:
📊 Centralized Performance Tracking
Track all your KPIs in one place—no need to manage multiple spreadsheets or reports.
📈 Real-Time Insights
Quickly adjust and analyze real-time numbers to make informed business decisions without delays.
🔁 Month-over-Month Comparison
Easily compare current performance with the past, identify what’s working, and improve what’s not.
🎯 Goal Alignment
Keep your team aligned by clearly tracking whether you’re meeting monthly and yearly targets.
⚙️ Fully Customizable
The template is Excel-based, so you can tweak formulas, formats, or visuals based on your unique needs.
Best Practices for Using the KPI Dashboard
Click to Purchases Healthcare Market Expansion KPI Dashboard in Excel
To get the most value from your Healthcare Market Expansion KPI Dashboard, follow these best practices:
1. Keep Your Data Updated
Regularly update actual, target, and previous year data to maintain accurate performance tracking.
2. Define KPIs Clearly
Use the KPI Definition sheet to ensure every stakeholder understands each metric.
3. Use Visual Cues
Make use of conditional formatting (up/down arrows) to instantly interpret performance results.
4. Review Trends Monthly
Use the KPI Trend tab to monitor patterns and make timely strategic adjustments.
5. Secure the File
Protect sensitive healthcare data using Excel password protection or share only restricted views.
Conclusion
Expanding your healthcare services into new markets is both exciting and challenging. However, without the right tools, it’s easy to lose sight of performance goals. That’s why the Healthcare Market Expansion KPI Dashboard in Excel is your ultimate ally—it simplifies data management, ensures smart decisions, and accelerates your path to success.
❓Frequently Asked Questions (FAQs)
1. What types of KPIs are included in this dashboard?
The dashboard includes KPIs like Market Penetration Rate, Patient Acquisition Cost, Clinic Expansion Count, and more—each categorized by group, unit, and type (LTB or UTB).
2. Can I customize the KPIs?
Yes, since it’s built in Excel, you can easily modify or add KPIs based on your organization’s unique goals.
3. Is this dashboard beginner-friendly?
Absolutely! It’s designed with dropdowns, trend charts, and buttons that make navigation simple—even for non-tech users.
4. Does the dashboard support multi-year tracking?
Yes, with YTD and Previous Year input sheets, you can easily compare multi-year performance data.
5. Can I share this with other departments or teams?
Yes. You can save it as a read-only file or use cloud sharing options like OneDrive or Google Drive.
Visit our YouTube channel to learn step-by-step video tutorials