The healthcare industry is changing rapidly, and marketing teams must adapt to keep pace with patient expectations, digital transformation, and competitive market pressures. One of the most significant changes in recent years is the shift toward remote work. Marketing professionals in healthcare organizations are now managing campaigns, analyzing performance, and driving patient engagement strategies from different locations.
To maintain efficiency and alignment in such a dynamic environment, organizations need powerful tools. That’s where the Healthcare Marketing Remote Work Dashboard in Excel comes in. This ready-to-use dashboard helps marketing teams track performance, visualize data, and monitor campaign results in real time—all within a familiar platform.
In this article, we will explore the complete structure, features, benefits, best practices, and practical applications of the Healthcare Marketing Remote Work Dashboard in Excel. By the end, you will know exactly how this dashboard can transform remote healthcare marketing operations.
Click to Purchases Healthcare Marketing Remote Work Dashboard in Excel
What is a Healthcare Marketing Remote Work Dashboard?
A Healthcare Marketing Remote Work Dashboard is an Excel-based analytical tool designed to track and measure marketing activities for healthcare organizations. It allows remote teams to:
-
Monitor campaign progress
-
Compare departmental performance
-
Track lead generation and conversions
-
Measure costs and ROI across multiple channels
-
Identify monthly performance trends
Unlike traditional reports, the dashboard provides interactive visuals, slicers, and cards to make complex data easy to understand. Marketing professionals can filter results by department, campaign, or channel to quickly identify which areas are performing well and where improvements are needed.
Key Features of the Healthcare Marketing Remote Work Dashboard
The dashboard includes multiple pages, each focused on a specific area of healthcare marketing. A page navigator on the left side enables seamless switching between sections.
Overview Page
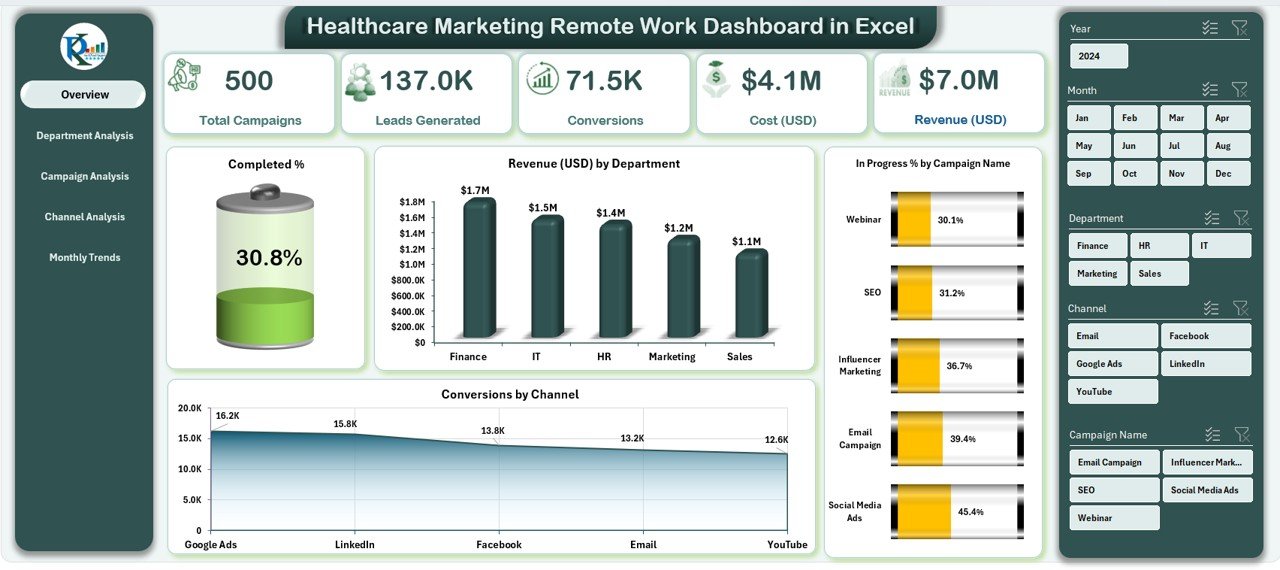
The Overview page gives a snapshot of performance across the organization. It includes:
-
5 Cards to highlight key performance metrics
Charts such as:
- Completed % of campaigns
- Revenue (USD) by Department
- In Progress % by Campaign Name
- Conversions by Channel
This page is ideal for executives and managers who need a quick high-level view of performance.
Department Analysis
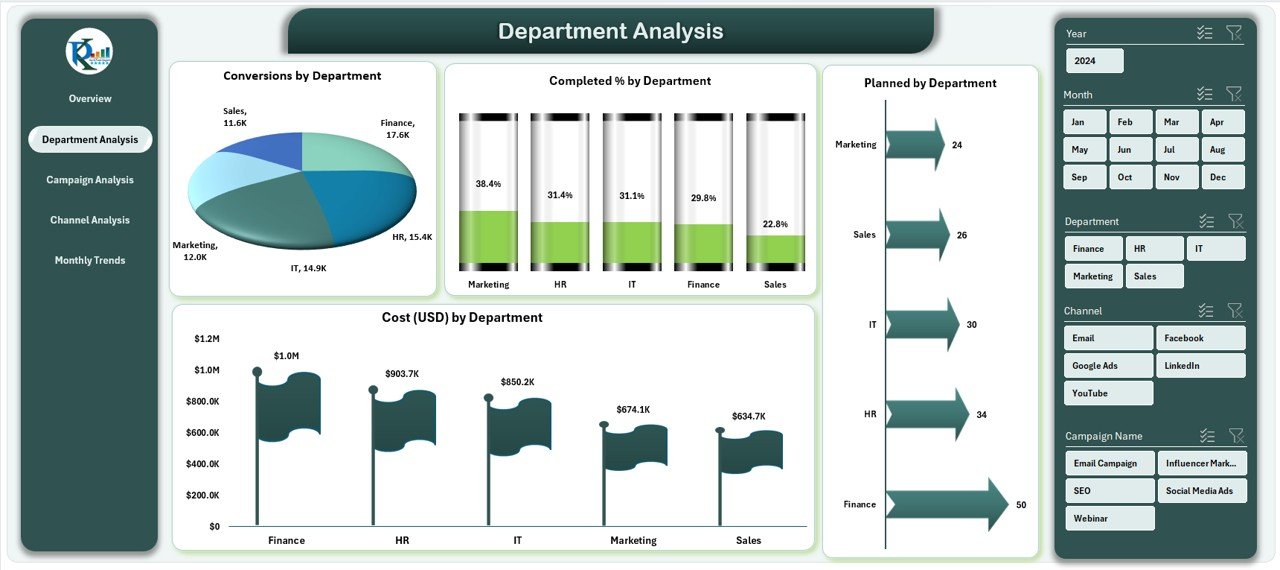
This page focuses on department-level performance. It includes:
-
Conversions by Department – see which departments drive the highest patient engagement.
-
Completed % by Department – monitor project completion rates.
-
Planned by Department – track future activities.
-
Cost (USD) by Department – evaluate budget allocation.
With these visuals, healthcare organizations can balance resources, costs, and productivity across different departments.
Campaign Analysis
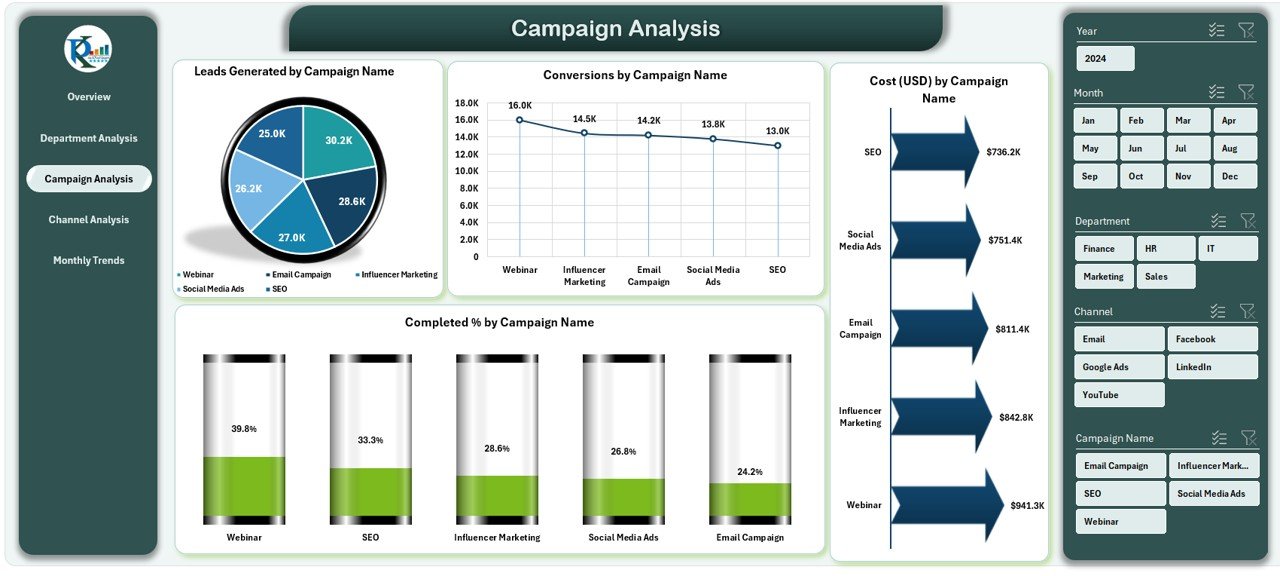
Healthcare marketing relies heavily on targeted campaigns, and this page tracks campaign success. Charts include:
-
Leads Generated by Campaign Name
-
Conversion by Campaign Name
-
Cost (USD) by Campaign Name
-
Completed % by Campaign Name
This analysis highlights which campaigns deliver the best ROI and where improvements are necessary.
Channel Analysis
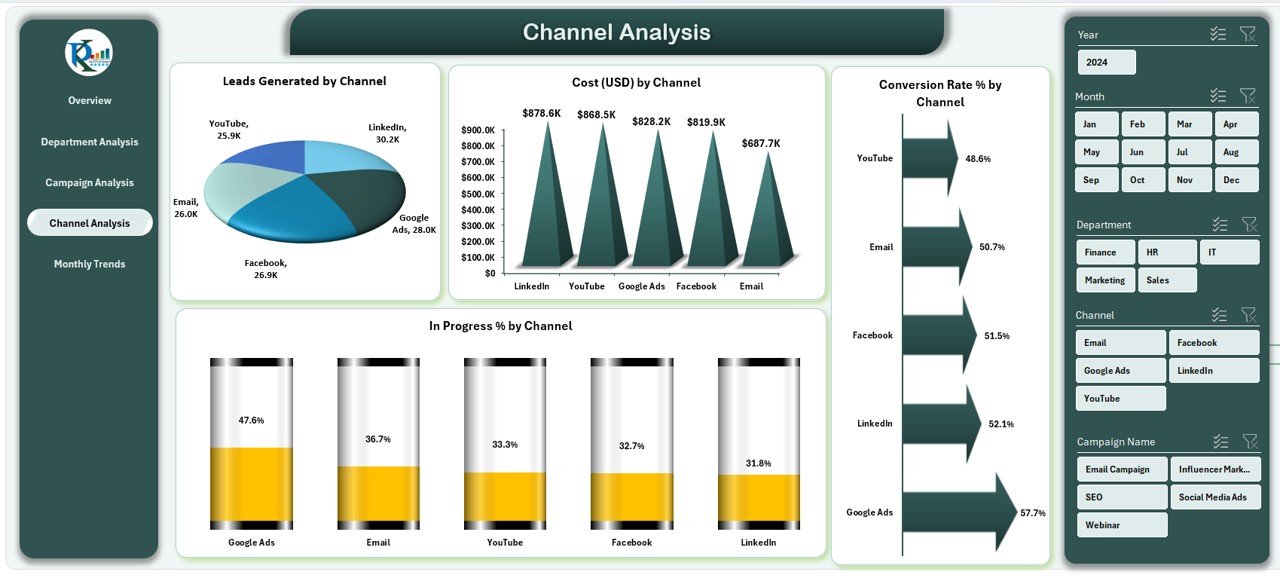
Marketing success depends on the performance of different channels—digital ads, email, social media, or traditional platforms. This page covers:
-
Leads Generated by Channel
-
Cost (USD) by Campaign Channel
-
Cost (USD) by Channel
-
In Progress % by Channel
By comparing costs and results, teams can identify the most cost-effective channels for patient acquisition and retention.
Click to Purchases Healthcare Marketing Remote Work Dashboard in Excel
Monthly Trends
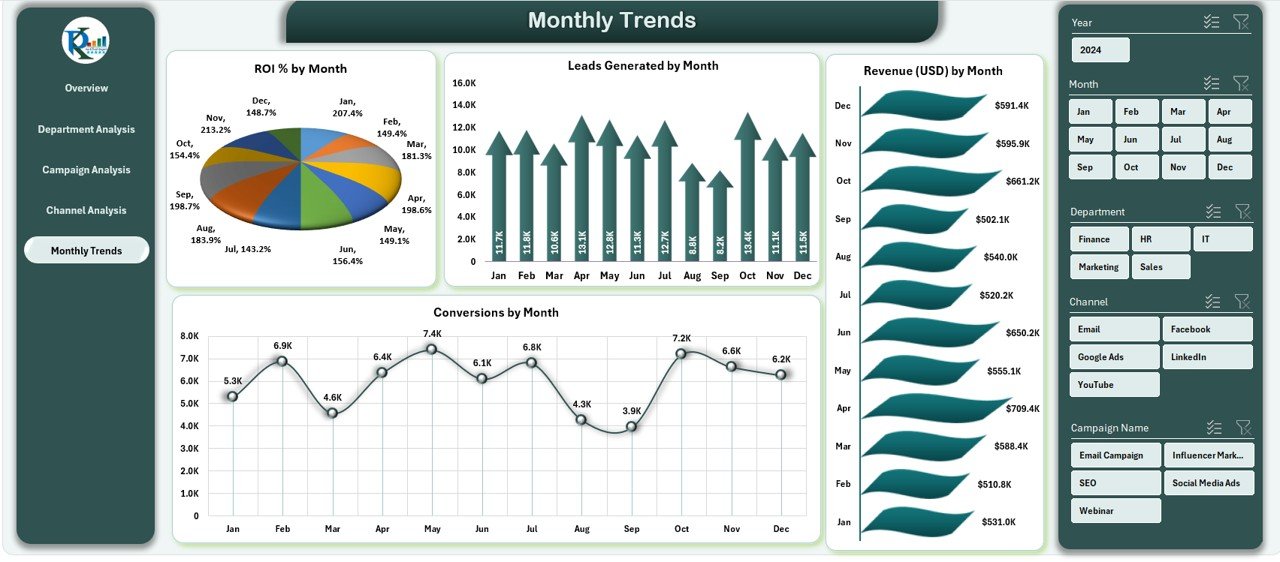
Tracking trends is essential for long-term success. This page provides:
-
ROI % by Month
-
Leads Generated by Month
-
Revenue (USD) by Month
-
Conversion by Month
Marketing managers can evaluate seasonal trends, identify peak performance periods, and plan future campaigns strategically.
Data and Support Sheets
-
Data Sheet – stores raw data for analysis and visualization.
-
Support Sheet – manages dropdown lists and reference data for consistency.
These sheets ensure the dashboard is dynamic, reliable, and easy to update.
Why Do Healthcare Teams Need This Dashboard?
Healthcare marketing is highly complex. Teams manage campaigns across multiple platforms while ensuring compliance with patient privacy regulations. Without structured tools, tracking results becomes difficult.
The Healthcare Marketing Remote Work Dashboard solves this problem by:
-
Bringing all campaign data into one place
-
Allowing real-time performance tracking
-
Supporting remote collaboration through a familiar Excel platform
-
Reducing manual reporting errors
It ensures marketing teams can work efficiently and transparently, regardless of location.
Advantages of Healthcare Marketing Remote Work Dashboard
Here are the key benefits of using this dashboard:
📊 Centralized Data – All marketing metrics in one location.
⏱️ Time Savings – Automated visuals reduce manual reporting.
💰 Cost Monitoring – Track spending at campaign, department, and channel levels.
📈 Performance Insights – Identify high-performing campaigns quickly.
👩💻 Remote-Friendly – Designed for teams working from different locations.
🔄 Dynamic Analysis – Use slicers to filter by department, campaign, or channel.
✅ Decision Support – Provides data-driven insights for better planning.
Opportunities for Improvement
While this dashboard is highly effective, healthcare organizations can enhance it further by:
-
Integrating with CRM tools like Salesforce or HubSpot for real-time updates.
-
Automating data entry using Power Query or APIs.
-
Adding advanced KPIs such as Patient Lifetime Value (PLV) or Cost per Appointment.
-
Enhancing visualization with Power BI integration for deeper analytics.
-
Expanding collaboration using cloud-based Excel in Microsoft 365.
Best Practices for the Healthcare Marketing Remote Work Dashboard
To maximize the effectiveness of the dashboard, follow these best practices:
-
Update Data Regularly – Ensure new campaign and revenue data is entered consistently.
-
Standardize Naming Conventions – Keep department and campaign names uniform.
-
Use Filters Wisely – Apply slicers to compare results across multiple dimensions.
-
Validate Data Sources – Cross-check input data to avoid reporting errors.
-
Train Teams – Ensure all remote marketing professionals know how to use the dashboard.
-
Leverage Trends – Use monthly insights to plan future campaigns.
Conclusion
The Healthcare Marketing Remote Work Dashboard in Excel is more than just a reporting tool—it is a strategic solution for modern healthcare marketing teams. By consolidating performance data into a single, interactive platform, it empowers remote teams to make smarter, faster, and more informed decisions.
From tracking campaign results to evaluating departmental efficiency and channel effectiveness, this dashboard provides a complete view of healthcare marketing performance. As organizations continue to embrace remote work, tools like this will become essential for success.
Frequently Asked Questions (FAQs)
1. What is a Healthcare Marketing Remote Work Dashboard?
It is an Excel-based tool designed to track campaigns, revenue, conversions, and departmental performance for healthcare organizations.
2. Who can use this dashboard?
Marketing managers, analysts, campaign specialists, and executives in healthcare organizations can benefit from it.
3. Can this dashboard be customized?
Yes. You can add new KPIs, integrate external data sources, and modify visuals as per your needs.
4. How does this help remote teams?
It consolidates performance data into one place, enabling team members across locations to access the same insights.
5. Is Excel suitable for such dashboards?
Yes. Excel is widely available, easy to use, and supports dynamic visuals with slicers, pivot charts, and formulas.
6. Can it track ROI effectively?
Absolutely. The dashboard includes ROI % by month and cost vs. revenue comparisons at multiple levels.
7. How often should the data be updated?
Ideally, update it weekly or monthly, depending on the frequency of your campaigns.
8. Can it integrate with Power BI?
Yes. Data from this Excel dashboard can easily be imported into Power BI for advanced analytics.
9. Is it beginner-friendly?
Yes. The interface is simple, and slicers make filtering and analysis easy even for non-technical users.
10. What makes this dashboard unique?
It is tailored specifically for healthcare marketing and supports remote work operations, unlike generic dashboards.
Visit our YouTube channel to learn step-by-step video tutorials