Improving healthcare processes is not just about treating more patients—it’s about doing it efficiently, safely, and cost-effectively. But how do you measure improvements? That’s where the Healthcare Process Improvement KPI Dashboard in Excel comes in! This powerful tool helps healthcare professionals, administrators, and analysts track performance metrics in a simple, dynamic, and visual format.
Let’s walk through how this dashboard works, what makes it valuable, and how you can get the most out of it.
Click to Purchases Healthcare Process Improvement KPI Dashboard in Excel
What Is the Healthcare Process Improvement KPI Dashboard?
The Healthcare Process Improvement KPI Dashboard in Excel is a ready-to-use Excel-based template that helps you track, visualize, and analyze KPIs (Key Performance Indicators) related to your healthcare facility’s operational performance. It provides a complete snapshot of current performance, targets, trends, and comparison against the previous year.
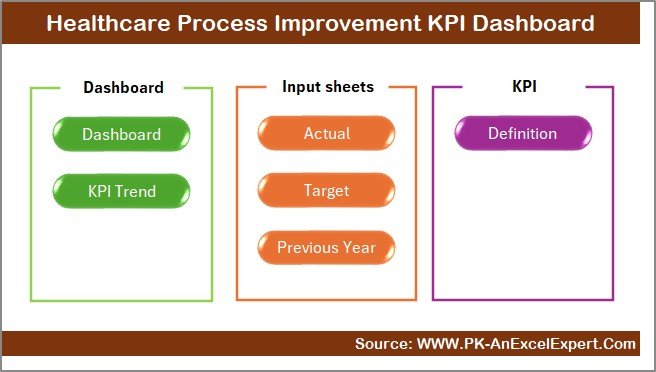
This dashboard includes seven interconnected worksheet tabs, each designed with user-friendly controls and automation, to offer seamless KPI monitoring.
What’s Inside the Dashboard? — Worksheet Breakdown
Home Sheet
Acts as a navigation hub, allowing users to jump to any section with a single click. It includes 6 handy buttons linking to all the main sections of the dashboard.
Dashboard Sheet
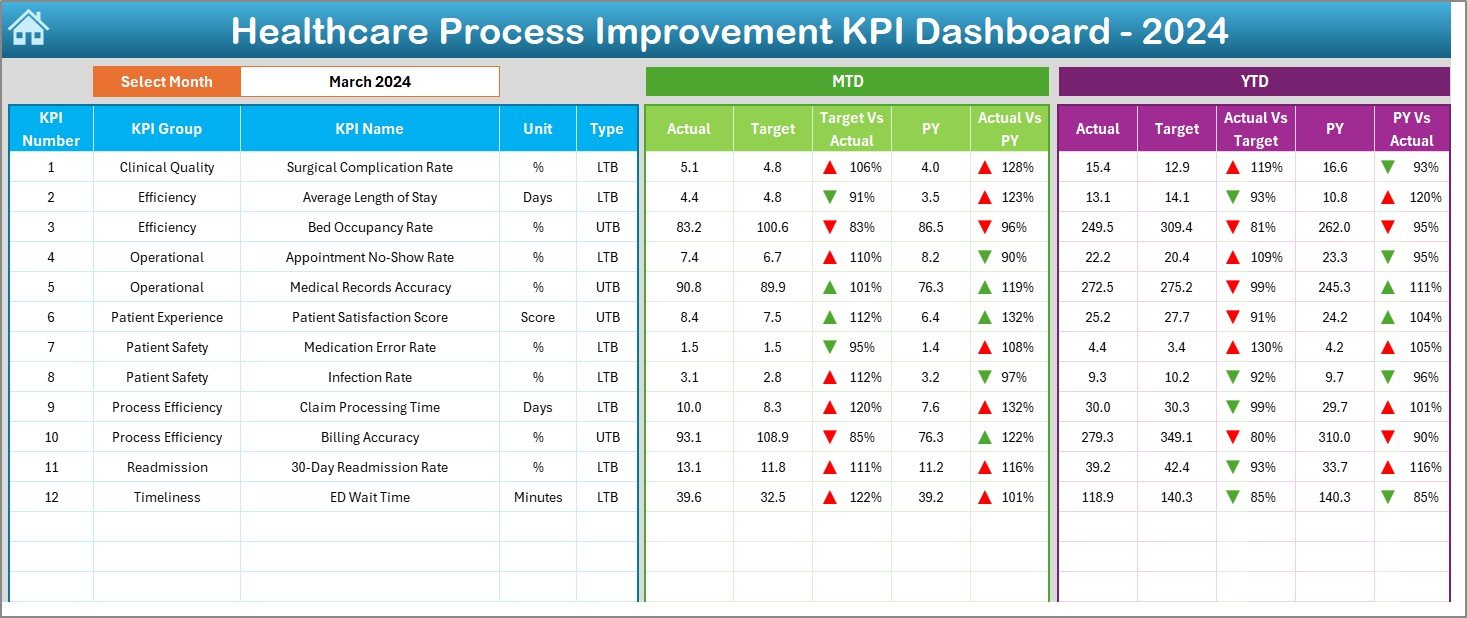
This is the core visualization area. Select a month from the dropdown (Range D3), and all KPI visuals and values will update instantly. It displays:
-
MTD (Month-to-Date) Actual vs Target vs Previous Year
-
YTD (Year-to-Date) Actual vs Target vs Previous Year
-
Performance indicators using up/down arrows via conditional formatting
KPI Trend Sheet
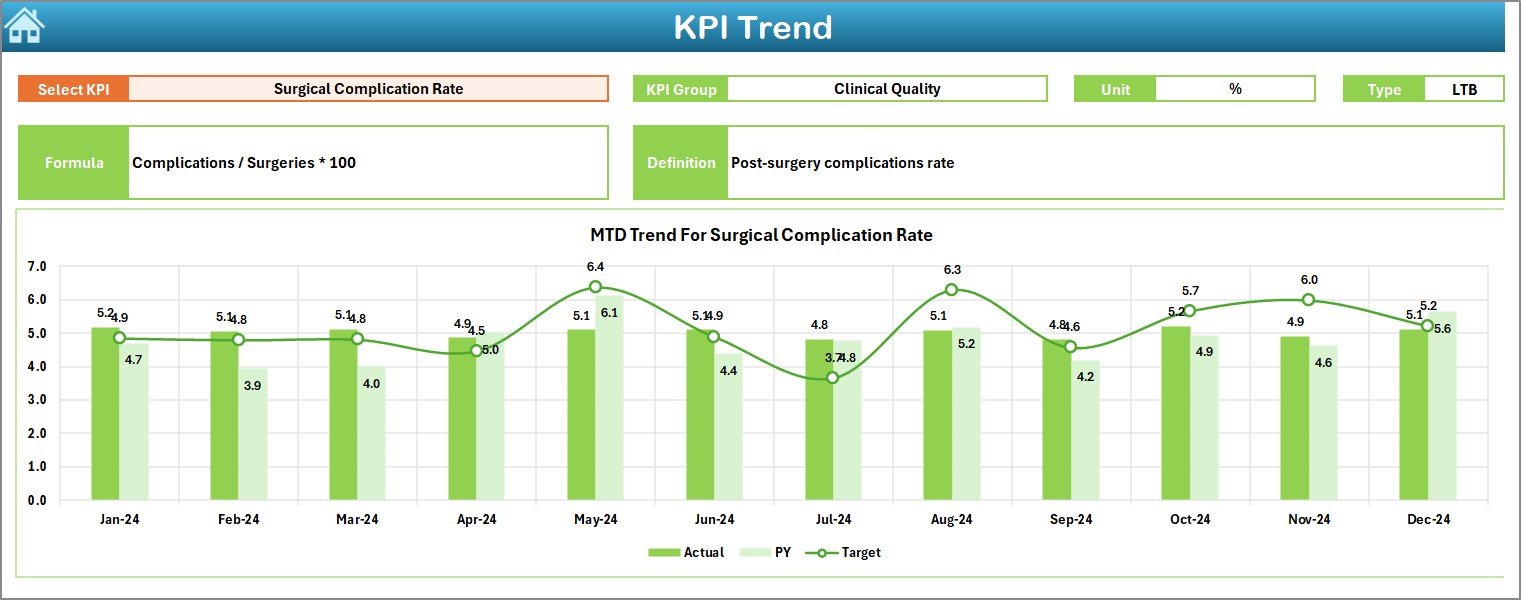
Here, users can choose a specific KPI (Range C3) and view:
-
The KPI’s Group, Unit, Type (LTB/UTB), Formula, and Definition
-
Trend charts for MTD and YTD showing Actual, Target, and Previous Year
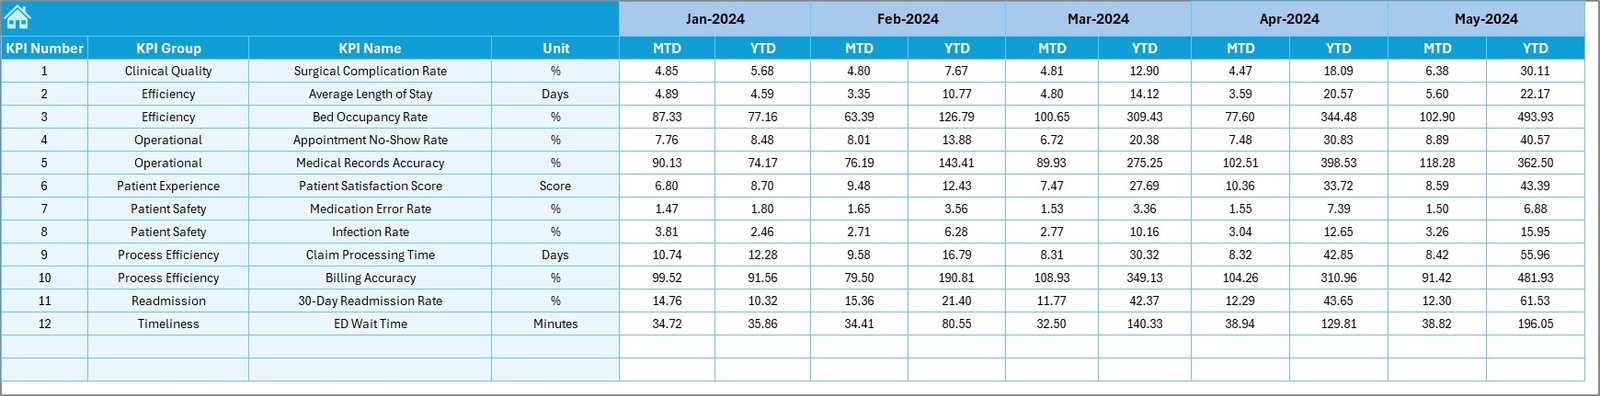
Actual Numbers Input Sheet

Easily input your monthly MTD and YTD actuals here. You can adjust the starting month for the year by entering the first month in Cell E1.
Target Sheet
Input the monthly targets for each KPI for both MTD and YTD periods.
Previous Year Numbers Sheet
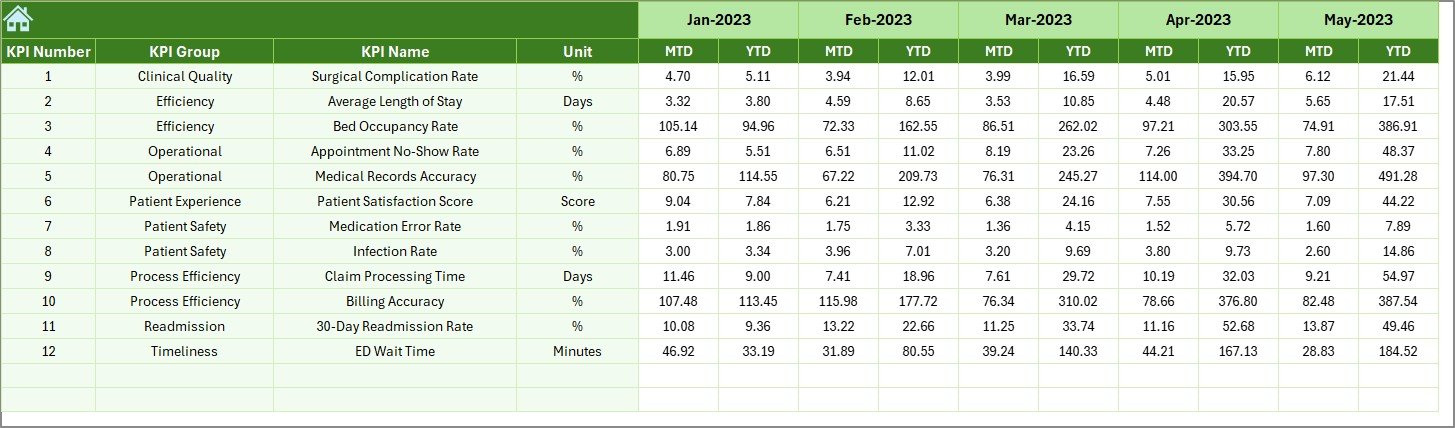
Record the prior year’s performance data to compare and track progress year-over-year.
KPI Definition Sheet
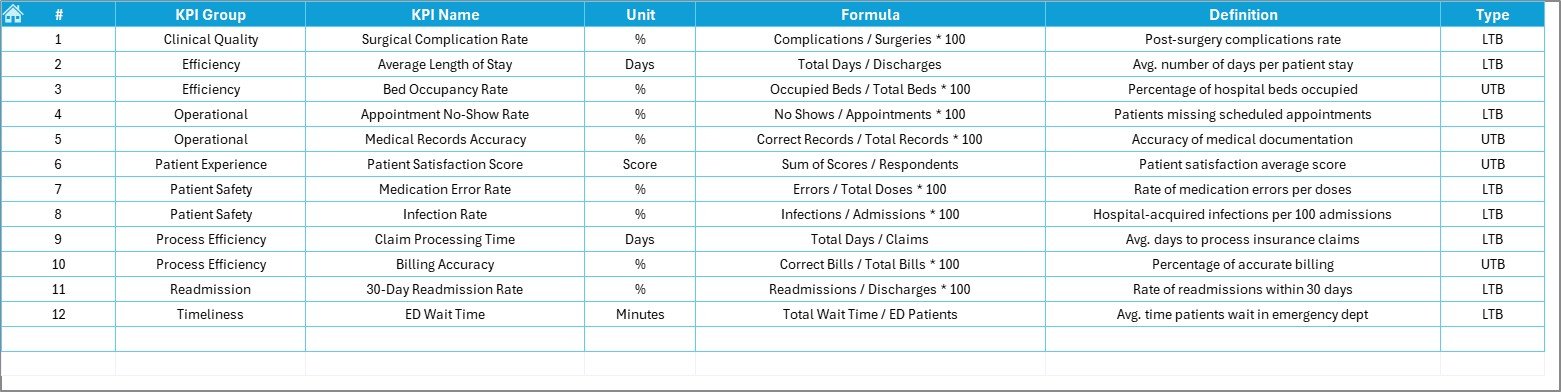
Maintain all your KPI metadata in one place—enter the KPI Name, Group, Unit, Formula, and Definition for reference and clarity.
Click to Purchases Healthcare Process Improvement KPI Dashboard in Excel
Advantages of the Healthcare Process Improvement KPI Dashboard
🔍 Data-Driven Decision-Making
Gain real-time insights into performance, helping you make faster, smarter choices.
📈 Trend Analysis at a Glance
Visualize monthly and yearly trends with easy-to-read charts and arrows.
💡 Identify Bottlenecks
Quickly spot areas of concern like delayed discharge, low patient satisfaction, or poor follow-up rates.
⚙️ Customizable & Scalable
Add or modify KPIs as per your facility’s needs—no coding required!
📊 Visual Performance Comparison
MTD, YTD, Targets, and Previous Year data are all neatly compared to help you stay on track.
Best Practices for Using the KPI Dashboard Effectively
🔄 Update Data Monthly
Ensure actuals, targets, and previous year numbers are updated every month to keep insights relevant.
🎯 Set Clear Targets
Define realistic and actionable KPIs for each department—be it Emergency, Outpatient, or Billing.
📋 Train Your Team
Train key stakeholders on how to navigate and interpret the dashboard to promote a culture of data usage.
🧠 Review KPI Definitions Regularly
Keep your KPI definitions and formulas clear and consistent to avoid misinterpretation.
🧩 Use Conditional Formatting Wisely
Take full advantage of the built-in indicators (up/down arrows) to visually signal performance shifts.
Conclusion
The Healthcare Process Improvement KPI Dashboard in Excel is more than just a tracking tool—it’s your healthcare facility’s performance compass. By measuring what matters most and comparing it over time, your organization can improve service delivery, increase patient satisfaction, and ensure operational efficiency.
Whether you’re managing a small clinic or a large hospital system, this Excel-based dashboard helps you stay informed and proactive—without needing fancy software or technical expertise.
❓ Frequently Asked Questions (FAQs)
1. Can I customize the KPIs in this dashboard?
Absolutely! You can easily add or modify KPIs using the KPI Definition sheet and corresponding input sheets.
2. Do I need Excel VBA knowledge to use this?
No coding is needed. The dashboard is fully functional using built-in Excel formulas and drop-downs.
3. What’s the benefit of comparing MTD and YTD?
MTD helps you track short-term monthly performance, while YTD gives a bigger picture of yearly progress, helping you identify trends.
4. How can I track previous year performance?
You can input last year’s MTD and YTD numbers in the Previous Year Numbers sheet, and the dashboard will auto-compare them.
5. Is this dashboard suitable for non-technical users?
Yes! The interface is clean, and all navigation is done via buttons and drop-down menus, making it user-friendly even for non-tech staff.
Visit our YouTube channel to learn step-by-step video tutorials
Click to Purchases Healthcare Process Improvement KPI Dashboard in Excel