Managing healthcare operations sustainably is not just about reducing costs or going paperless. It’s about making informed decisions using data to improve patient outcomes, resource utilization, and environmental impact — all while keeping performance aligned with strategic goals.
That’s where the Healthcare Sustainability KPI Dashboard in Excel comes in. This powerful and user-friendly tool helps healthcare providers, administrators, and analysts monitor key sustainability metrics effectively.
In this detailed guide, we will walk you through everything you need to know about this dashboard — from its components to benefits, best practices, and frequently asked questions.
Click to Purchases Healthcare Sustainability KPI Dashboard in Excel
What Is a Healthcare Sustainability KPI Dashboard?
A Healthcare Sustainability KPI Dashboard is an Excel-based tool that tracks key performance indicators (KPIs) linked to sustainability in the healthcare sector. It helps healthcare organizations monitor and evaluate their energy usage, waste reduction, patient care efficiency, cost control, and more.
This dashboard is customizable, visually interactive, and designed for both monthly and yearly tracking. Whether you are in hospital administration or clinical operations, this dashboard keeps you aligned with sustainability and compliance standards.
Key Features of the Healthcare Sustainability KPI Dashboard in Excel
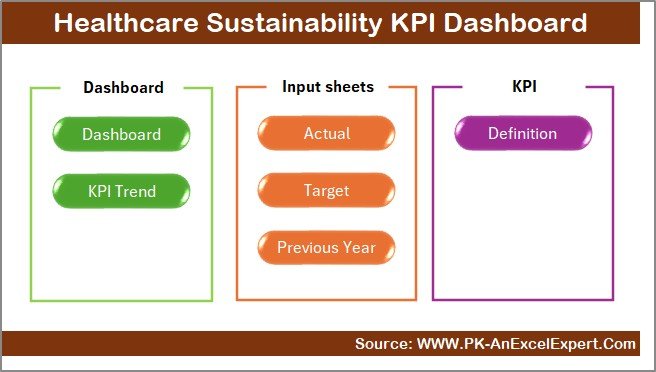
Our ready-to-use Excel dashboard comes with seven intelligently designed worksheets to help you manage and interpret data efficiently.
Home Sheet
-
Acts as a navigation hub.
-
Provides quick access buttons to jump to different sheets like Dashboard, KPI Trend, Targets, and Inputs.
-
User-friendly and neatly organized for easy control.
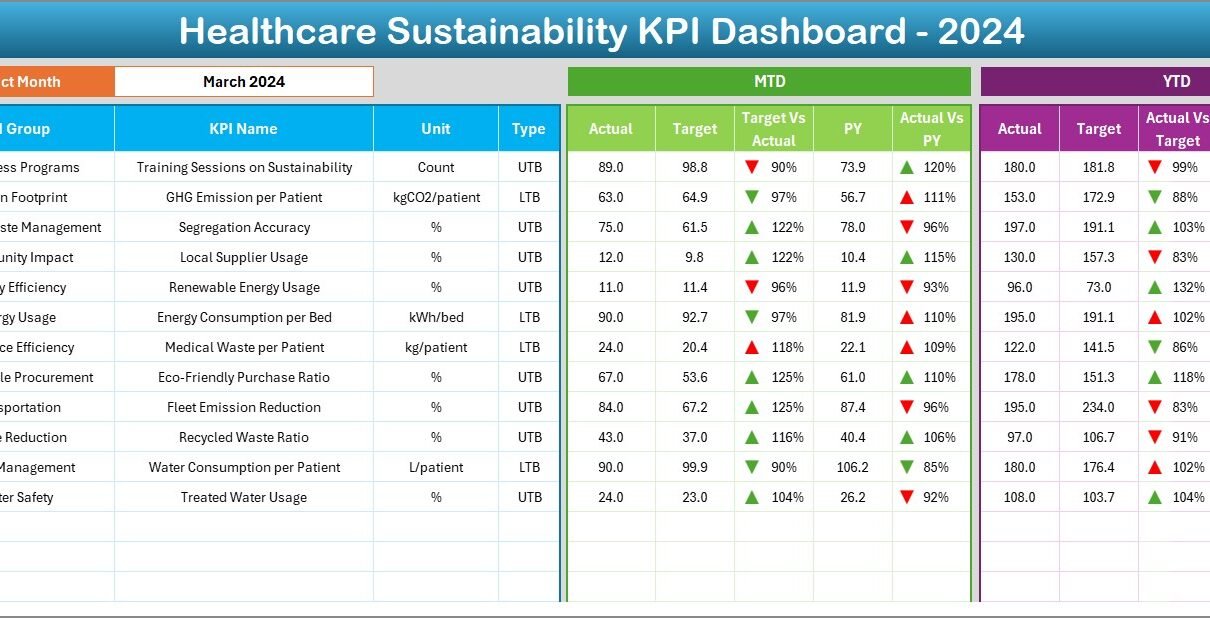
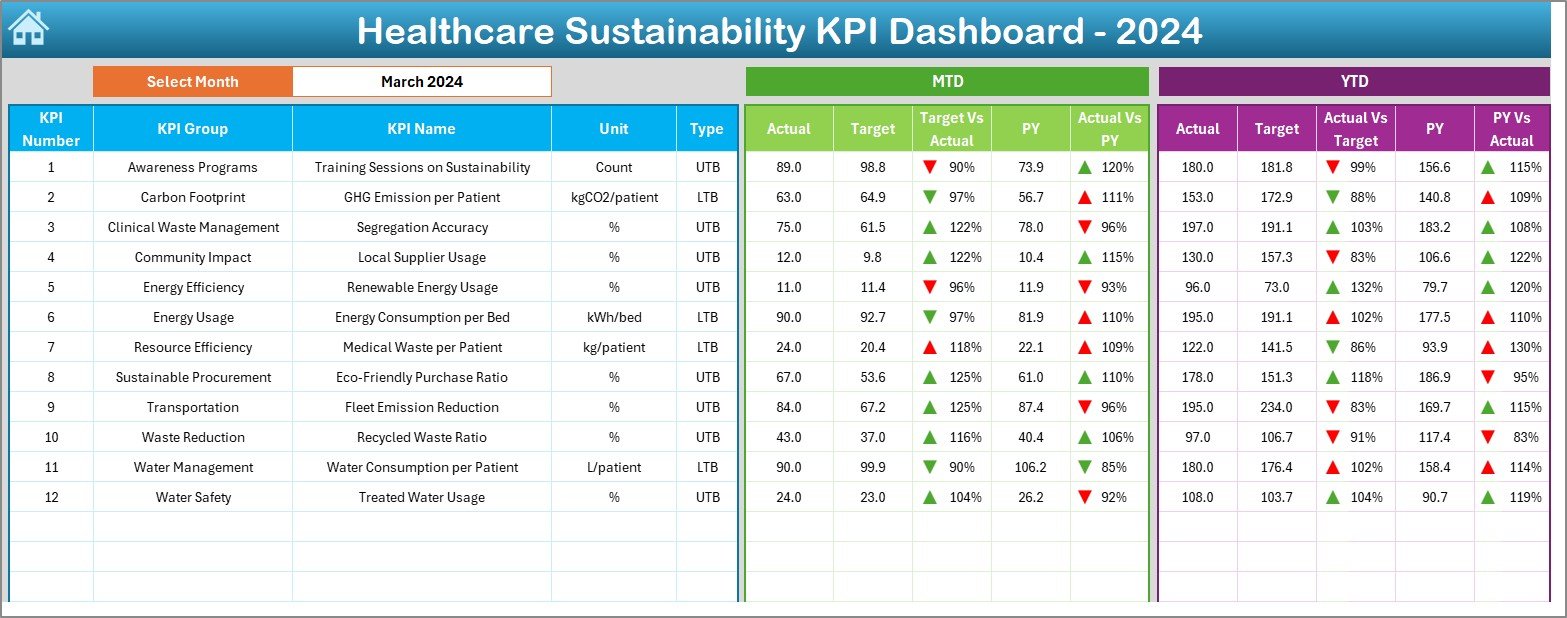
Dashboard Sheet
-
This is your main visualization panel.
-
Select a specific month from a drop-down (cell D3) and watch the dashboard auto-update.
-
Displays both Month-to-Date (MTD) and Year-to-Date (YTD) data for:
- Actual performance
- Target values
- Previous year comparison
-
Uses conditional formatting to show performance with up/down arrows for instant visual analysis.
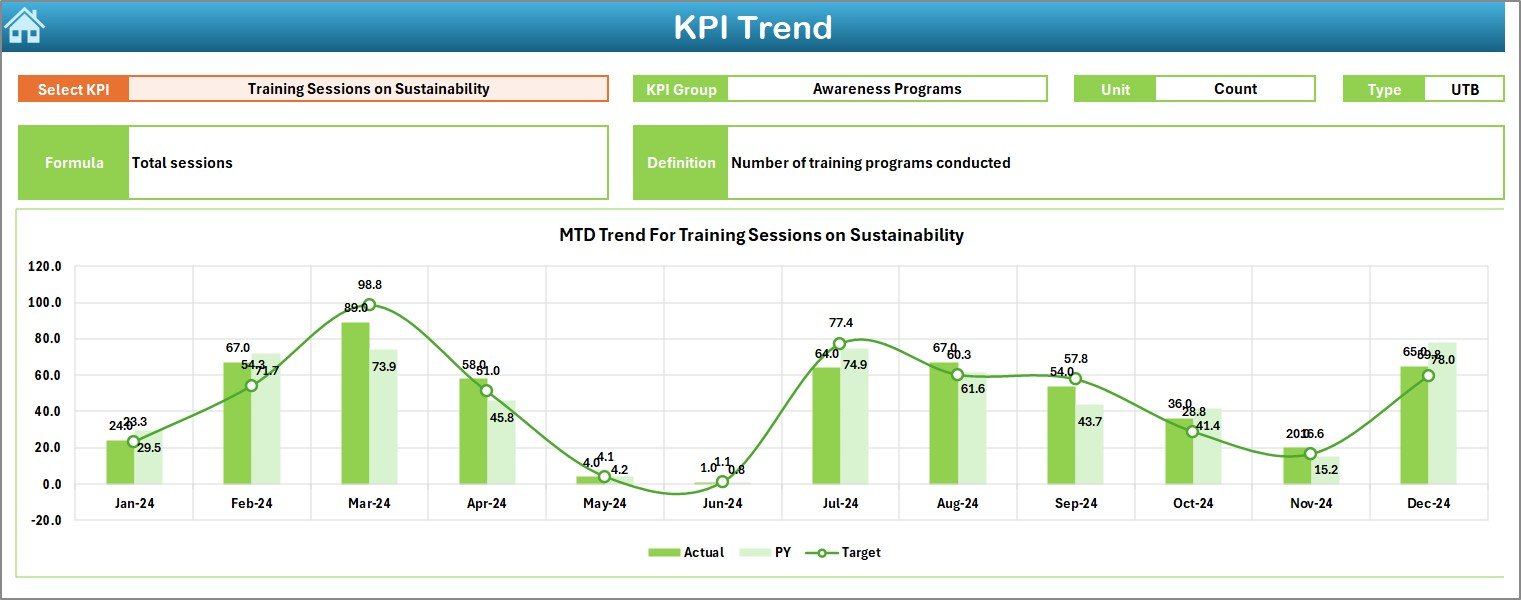
KPI Trend Sheet
-
Focused on individual KPI performance over time.
-
Select a KPI name (cell C3) to view its:
- Group category
- Unit of measurement
- Performance type (UTB – Upper the Better or LTB – Lower the Better)
- Formula and brief definition
-
View line charts showing trends in MTD, YTD, Target, and Previous Year values.
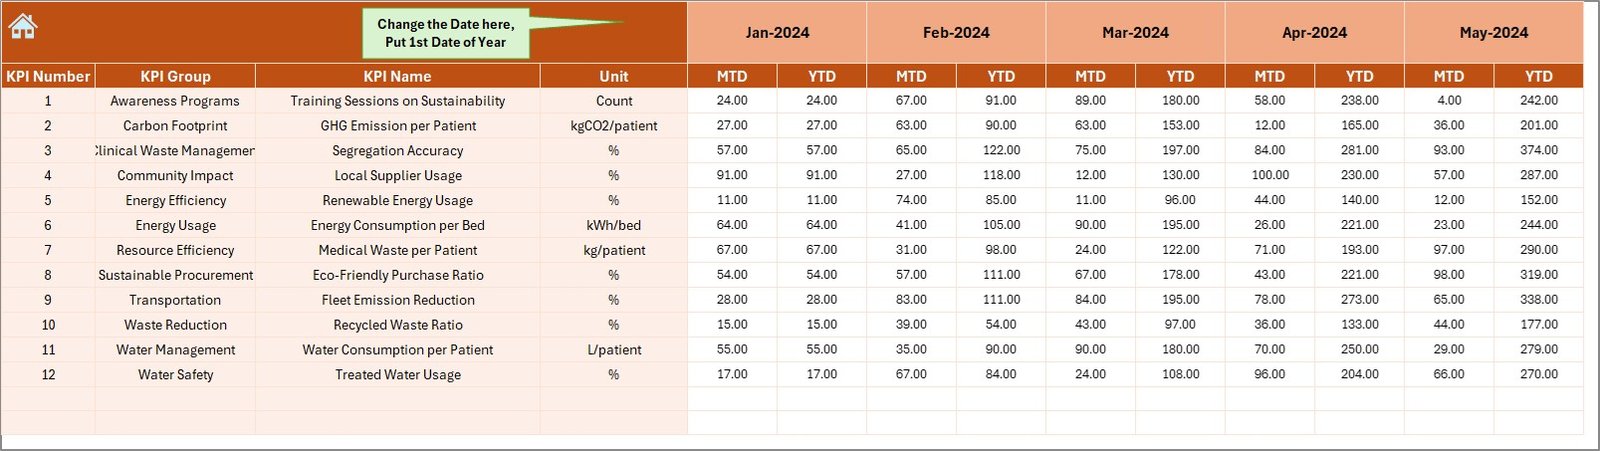
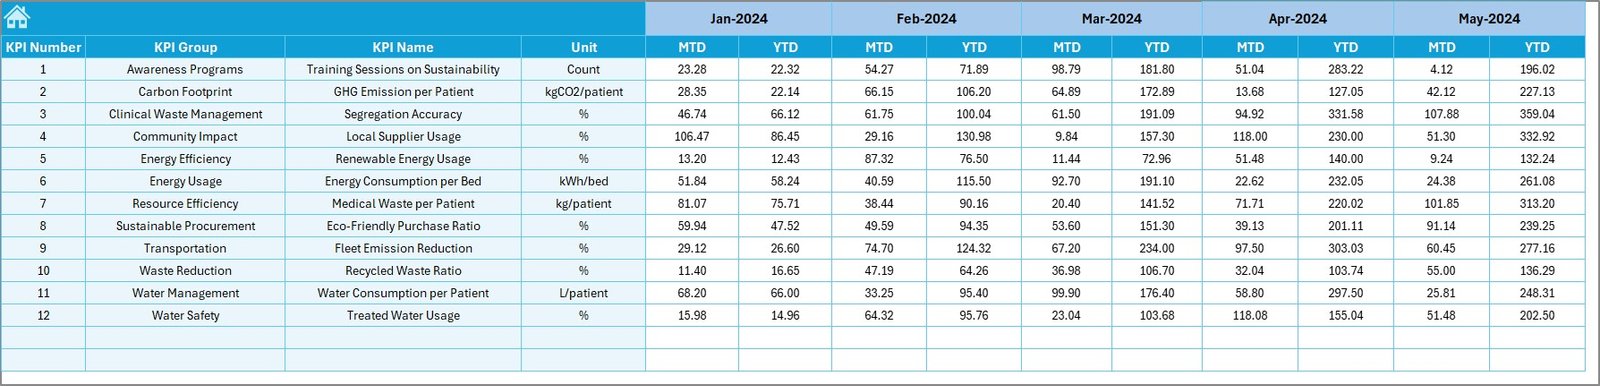
Actual Numbers Input Sheet
-
Input actual performance data here.
-
Change the first month of the year from cell E1.
-
Supports both MTD and YTD data entry for every KPI.
Target Sheet
-
Enter your performance goals for each KPI.
-
Includes fields for both monthly (MTD) and yearly (YTD) targets.
Previous Year Number Sheet
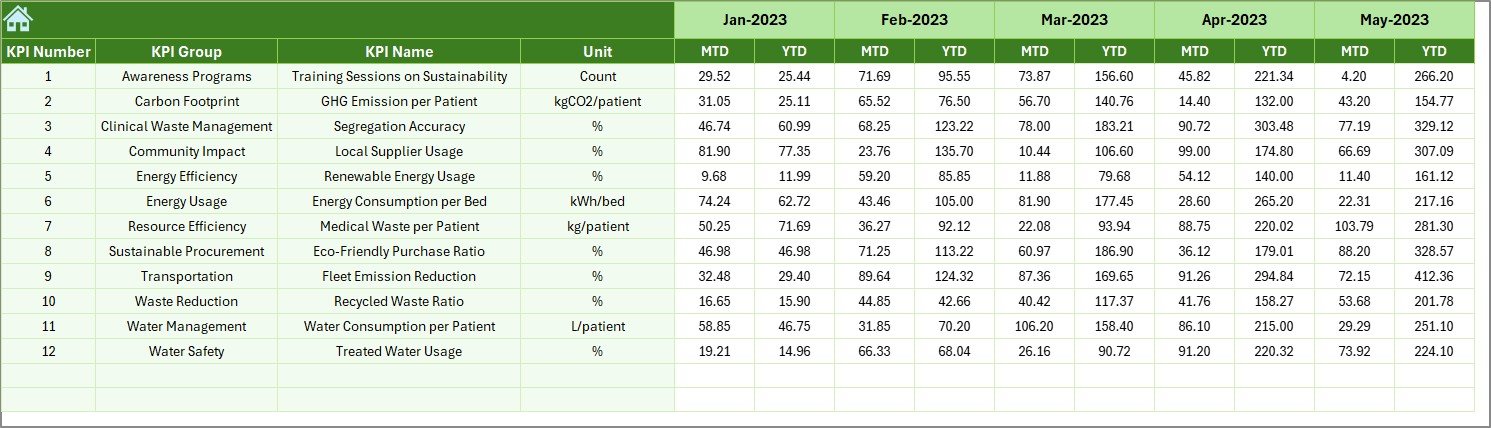
-
Record last year’s data for accurate performance comparison.
-
This sheet ensures historical benchmarking is built into your dashboard.
KPI Definition Sheet
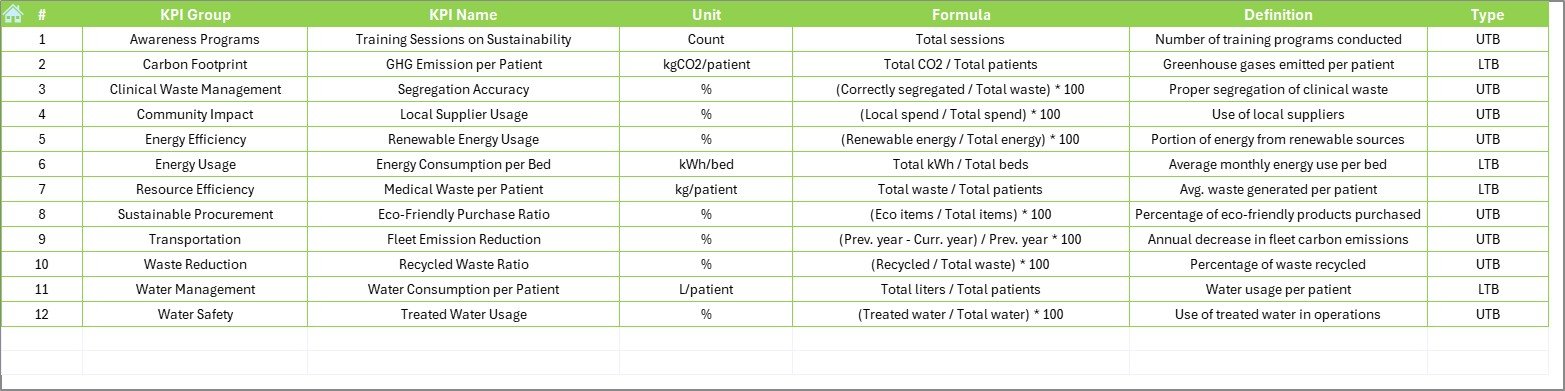
-
Document KPI details such as:
- KPI Group
- KPI Name
- Unit
- Formula
- Type (UTB/LTB)
- Short definition for user understanding
Why Use a Healthcare Sustainability KPI Dashboard?
If you’re still managing your KPIs using manual reports or unstructured sheets, you’re likely missing out on critical insights. This dashboard transforms scattered data into clear, actionable insights.
Advantages of the Healthcare Sustainability KPI Dashboard
Click to Purchases Healthcare Sustainability KPI Dashboard in Excel
🌿 Improves Sustainability Goals
Track metrics like energy usage, waste reduction, and supply efficiency with ease.
📊 Simplifies Data Analysis
No complex software needed — just Excel! The dashboard brings KPIs, targets, and performance gaps together visually.
📈 Boosts Strategic Decision-Making
Make timely decisions by comparing current, target, and historical data side-by-side.
⏱ Saves Time
Automated formulas, dropdowns, and dynamic charts mean less time crunching numbers.
👨⚕️ Enhances Accountability
Assign and track responsibility for sustainability efforts within your team.
🔁 Flexible and Customizable
You can edit KPI definitions, formulas, and targets to match your unique goals.
Best Practices for Using the Healthcare Sustainability KPI Dashboard
Following some simple best practices can maximize the effectiveness of your dashboard.
Review KPIs Regularly
Make it a monthly habit to review both MTD and YTD values. Set a reminder for your team.
Update Targets Annually
Ensure that your target values are realistic and aligned with regulatory changes and new initiatives.
Train Your Team
Brief your staff on how to use the dashboard. Clarity reduces errors and builds ownership.
Document Changes
Whenever you tweak a formula or update a KPI, record the change in the KPI Definition Sheet.
Use Conditional Formatting Wisely
Keep visual indicators consistent across charts. For example, green for improvement, red for decline.
Validate Data Entries
Always double-check the Actual Numbers Input and Previous Year Data for accuracy.
KPI Categories You Can Track with This Dashboard
Here are some examples of KPI categories that can be monitored using this dashboard:
Energy & Water Efficiency
- Energy consumed per patient
- Water usage per procedure
Waste Management
- Medical waste generated per month
- Recycled waste percentage
Resource Utilization
- Reusable vs. disposable supplies
- Bed occupancy rate
Operational Efficiency
- Turnaround time for lab results
- Equipment utilization rate
Financial KPIs
- Cost per treatment
- Sustainability-related savings
Patient & Staff Engagement
- Staff training hours on green practices
- Patient education participation rate
How to Customize the Dashboard for Your Hospital or Clinic
You might want to modify the dashboard to reflect your internal structure. Here’s how:
Step 1: Update KPI Definitions
Navigate to the KPI Definition Sheet and add or remove KPIs based on your goals.
Step 2: Modify KPI Formulas
Adjust formulas in the Definition Sheet or in backend calculations as per your reporting needs.
Step 3: Refresh the Dashboard
Use Excel’s refresh or auto-update features to ensure all visuals reflect the latest inputs.
Step 4: Add New Visuals (Optional)
You can insert more Pivot Charts or slicers if needed — the dashboard is 100% Excel-based!
Who Should Use This Dashboard?
This tool is ideal for:
-
Hospital administrators
-
Sustainability officers in healthcare
-
Compliance teams
-
Operations and quality control managers
-
Public health professionals
Whether you’re in a government hospital or a private clinic, this dashboard adapts to your reporting needs.
Use Case Example
Scenario: A hospital wants to reduce energy consumption and improve waste segregation efficiency.
Action: They set monthly and annual targets for energy per patient and waste recycled.
Result: The dashboard helps track improvements, identify gaps, and make quick decisions — leading to a 15% reduction in energy use within six months.
Conclusion
The Healthcare Sustainability KPI Dashboard in Excel is more than just a spreadsheet — it’s a complete performance monitoring system. It bridges the gap between data collection and actionable insights. Easy to use, fully customizable, and packed with visual tools, this dashboard helps you steer your healthcare organization toward a greener, more efficient future.
Don’t wait for audits or reports to tell you how you’re doing — get ahead with real-time, data-driven insights. With this dashboard, you’re not just measuring; you’re improving.
Frequently Asked Questions (FAQs)
Q1. What are the main KPIs to track in healthcare sustainability?
You should monitor KPIs related to energy consumption, waste generation, supply efficiency, cost control, and patient care outcomes.
Q2. Is this dashboard suitable for small clinics?
Absolutely! It is designed in Excel, so even small teams without advanced software can use it effectively.
Q3. Can I add more KPIs to the dashboard?
Yes, the dashboard is completely customizable. Just update the KPI Definition Sheet and input the corresponding data.
Q4. How often should I update the Actual and Target sheets?
Monthly updates are ideal to keep the dashboard insights timely and accurate.
Q5. Do I need any technical skills to use this dashboard?
Not at all. Basic Excel knowledge is enough to operate and manage this dashboard.
Visit our YouTube channel to learn step-by-step video tutorials
Click to Purchases Healthcare Sustainability KPI Dashboard in Excel
Watch the step-by-step video Demo: