In today’s competitive manufacturing environment, heavy vehicle assembly companies must monitor production efficiency, quality performance, operational costs, and workforce productivity continuously. However, many organizations still rely on disconnected spreadsheets and manual reporting systems. As a result, managers struggle to identify bottlenecks, track performance trends, and make timely decisions.
Therefore, businesses increasingly adopt structured KPI dashboards to centralize performance monitoring. One powerful and practical solution is the Heavy Vehicle Assembly KPI Dashboard in Excel — a ready-to-use analytical template designed to track key manufacturing indicators efficiently.
In this comprehensive guide, you will learn everything about the Heavy Vehicle Assembly KPI Dashboard in Excel, including its structure, features, benefits, implementation process, best practices, and frequently asked questions.
Click to Purchases Heavy Vehicle Assembly KPI Dashboard in Excel
What Is a Heavy Vehicle Assembly KPI Dashboard in Excel?
A Heavy Vehicle Assembly KPI Dashboard in Excel is a performance monitoring tool that helps manufacturing teams track assembly operations using measurable indicators called Key Performance Indicators (KPIs).
Instead of reviewing multiple reports separately, managers can analyze all operational metrics from a single interactive dashboard. Consequently, decision-makers gain clarity and respond quickly to production challenges.
The dashboard combines production, quality, efficiency, and operational data into visual insights. Moreover, Excel automation ensures that calculations update instantly when users enter new data.
Typically, the dashboard tracks:
-
Assembly line efficiency
-
Production output
-
Defect rates
-
Downtime performance
-
Labor productivity
-
Target vs actual performance
-
Year-over-year comparisons
As a result, organizations improve transparency across departments.
Why Do Heavy Vehicle Manufacturers Need KPI Dashboards?
Heavy vehicle assembly operations involve complex processes such as chassis assembly, engine installation, electrical integration, testing, and final inspection. Because multiple teams work simultaneously, performance monitoring becomes essential.
Without structured tracking:
-
Production delays remain unnoticed.
-
Quality issues increase costs.
-
Managers lack real-time insights.
-
Decision-making slows down.
However, when companies implement KPI dashboards, they gain measurable control over operations.
Therefore, KPI dashboards help organizations:
-
Monitor production health daily
-
Detect inefficiencies early
-
Improve accountability
-
Align teams with strategic goals
Overview of the Heavy Vehicle Assembly KPI Dashboard in Excel
In this article, we present a ready-to-use Heavy Vehicle Assembly KPI Dashboard in Excel designed specifically for manufacturing environments.
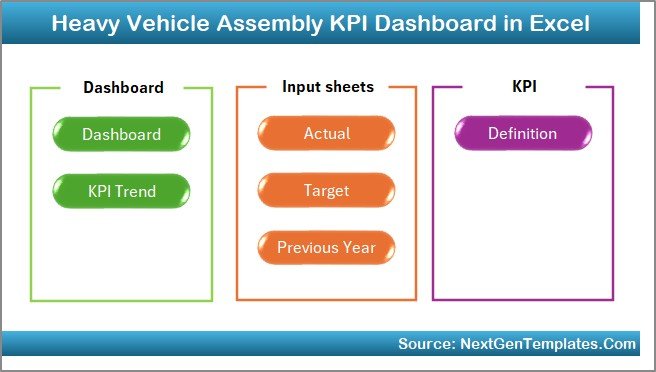
The dashboard contains 7 structured worksheets, each serving a unique purpose.
1. Home Sheet – Central Navigation Hub
The Home Sheet works as an index page that improves usability.
Key Highlights:
-
Six navigation buttons
-
Quick access to all sheets
-
User-friendly interface
-
Smooth workflow navigation
Instead of searching through worksheets manually, users can move between sections instantly. Consequently, productivity improves.
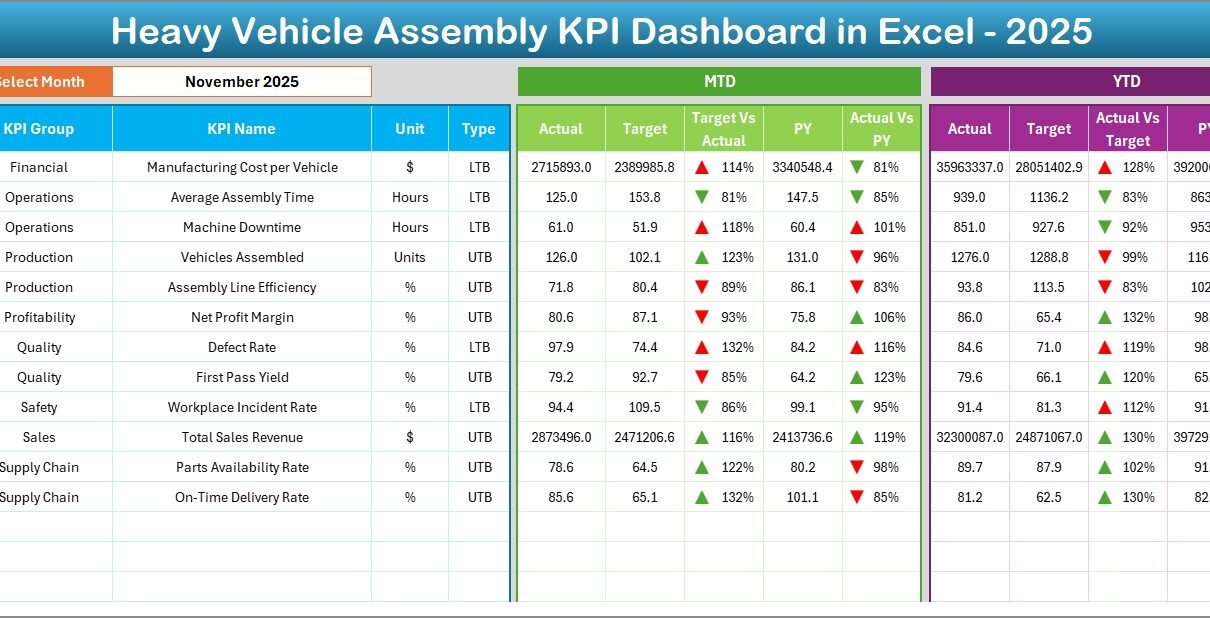
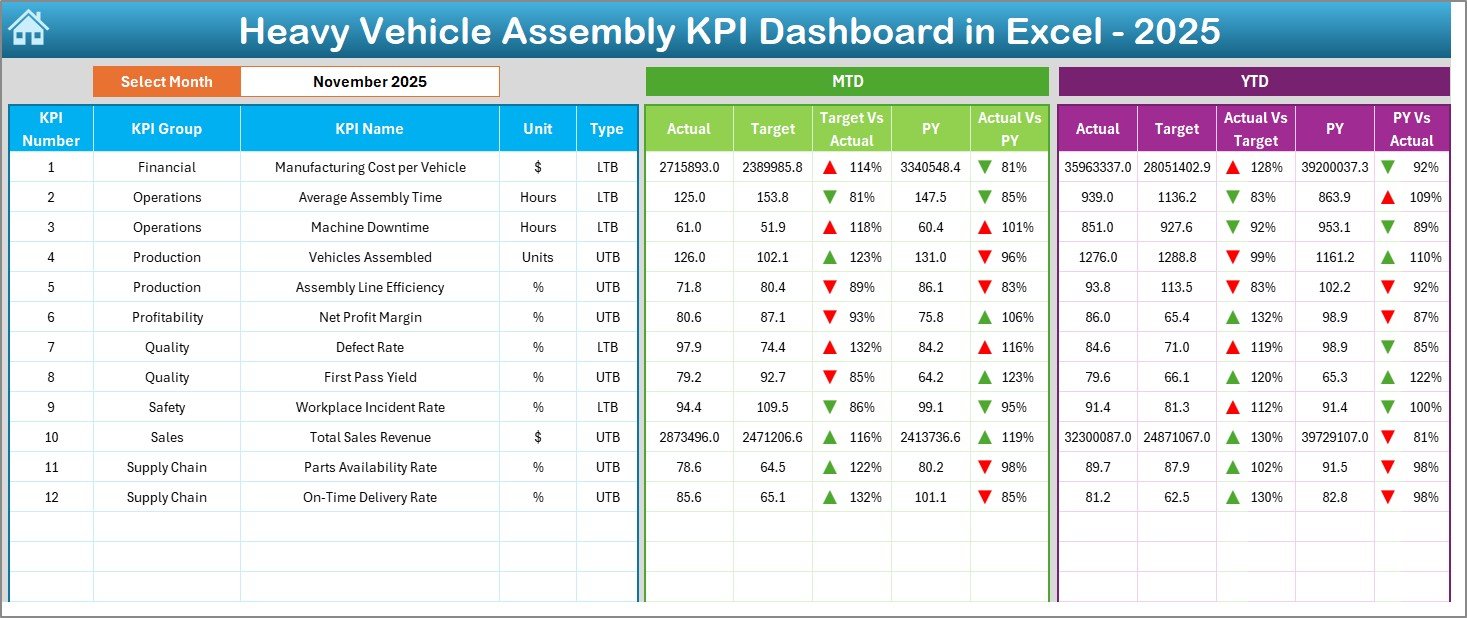
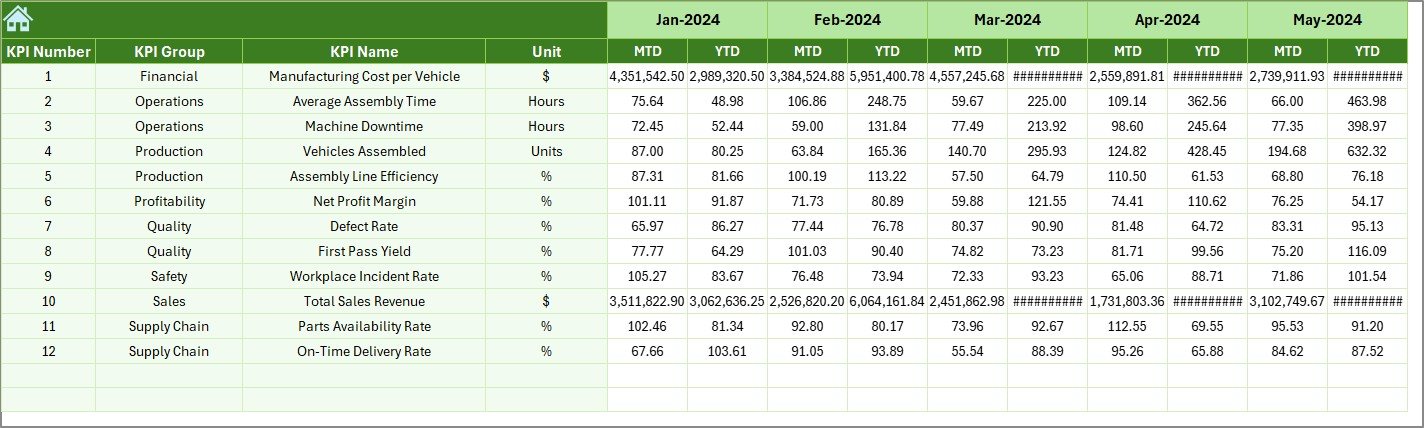
2. Dashboard Sheet – Main Performance View
The Dashboard Sheet acts as the heart of the entire system.
Here, users can analyze all KPIs in one location.
Dynamic Month Selection
-
Month dropdown available in cell D3
-
Dashboard updates automatically when users change the month
Therefore, managers can review monthly performance without manual adjustments.
Click to Purchases Heavy Vehicle Assembly KPI Dashboard in Excel
Performance Metrics Displayed
The dashboard shows:
MTD (Month-To-Date)
-
Actual values
-
Target values
-
Previous Year values
-
Target vs Actual comparison
-
Previous Year vs Actual comparison
YTD (Year-To-Date)
-
Actual performance
-
Targets
-
Previous year benchmarks
-
Performance indicators
Additionally, conditional formatting displays up and down arrows, which makes performance interpretation quick and visual.
As a result, executives understand performance trends within seconds.
3. KPI Trend Sheet – Performance Analysis Over Time
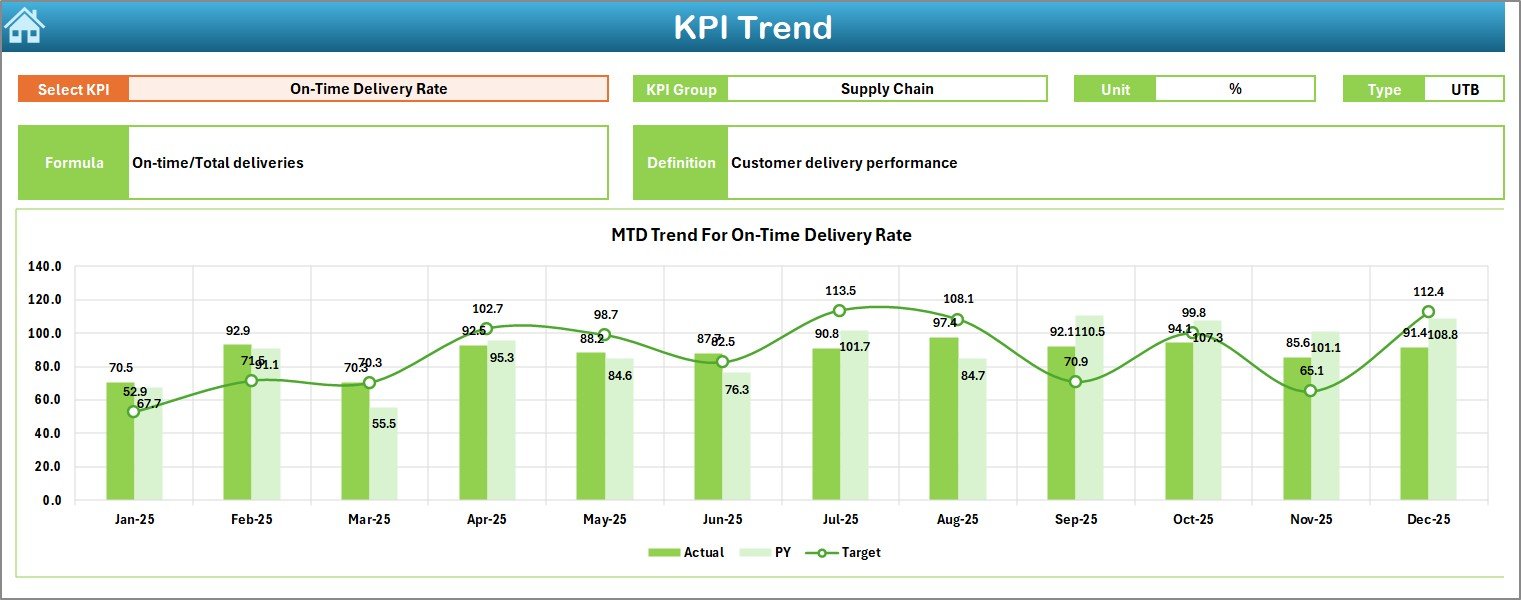
The KPI Trend Sheet allows deep analytical insights.
Users can select any KPI from the dropdown located in cell C3.
Information Displayed:
-
KPI Group
-
KPI Unit
-
KPI Type (Lower the Better / Upper the Better)
-
KPI Formula
-
KPI Definition
Furthermore, the sheet displays:
-
MTD trend charts
-
YTD trend charts
-
Actual vs Target vs Previous Year comparison
Because trends appear visually, managers can identify performance patterns easily.
4. Actual Numbers Input Sheet – Data Entry Area
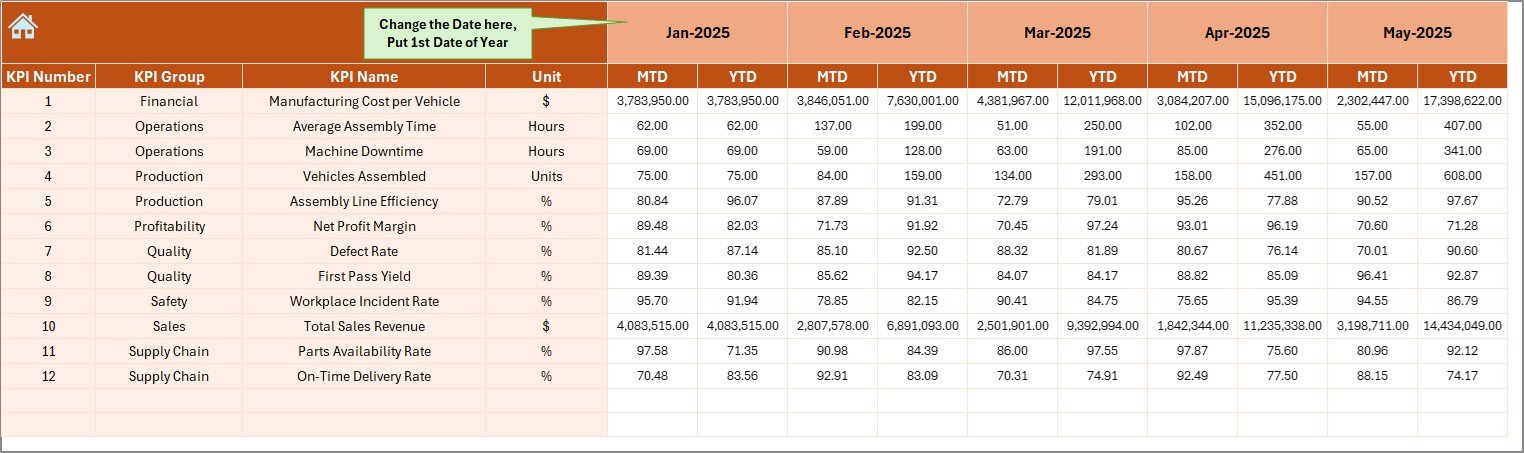
This sheet serves as the primary data entry section.
How It Works:
-
Enter Actual MTD and YTD numbers
-
Select starting month in cell E1
-
Dashboard updates automatically
Therefore, users maintain flexibility while entering data.
Click to Purchases Heavy Vehicle Assembly KPI Dashboard in Excel
5. Target Sheet – Performance Planning
The Target Sheet stores planned KPI values.
Users enter:
-
Monthly targets
-
MTD targets
-
YTD targets
Because targets drive performance measurement, this sheet ensures alignment between goals and results.
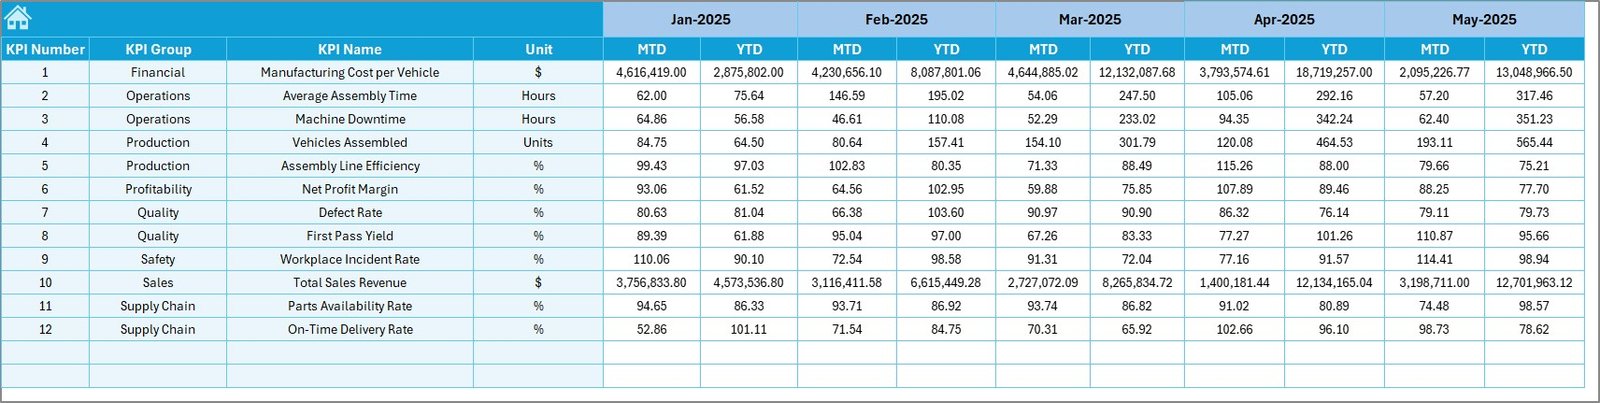
6. Previous Year Numbers Sheet – Historical Benchmarking
Historical comparison plays a crucial role in performance evaluation.
In this sheet, users enter previous year values similar to current-year entries.
As a result, organizations can:
-
Compare yearly performance
-
Identify growth trends
-
Evaluate improvement strategies
7. KPI Definition Sheet – KPI Documentation Center
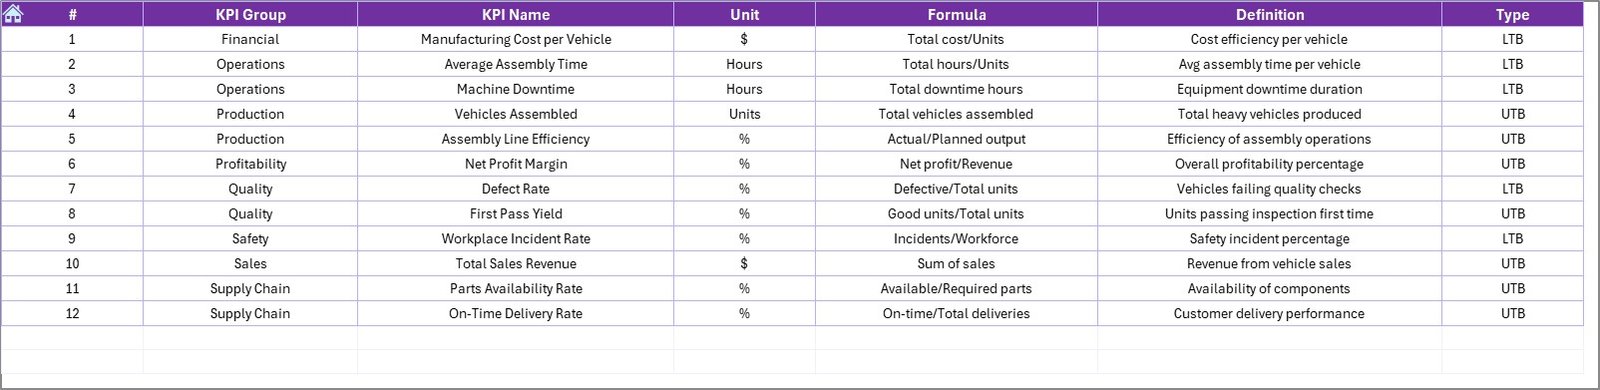
The KPI Definition Sheet works as the knowledge base.
Users define:
-
KPI Name
-
KPI Group
-
Unit of Measurement
-
Formula
-
KPI Definition
Therefore, teams maintain consistent KPI understanding across departments.
Which KPIs Can You Track in Heavy Vehicle Assembly?
Although organizations customize KPIs based on operations, common manufacturing KPIs include:
Production KPIs
-
Assembly Output Rate
-
Units Produced per Shift
-
Production Efficiency %
Quality KPIs
-
Defect Rate
-
Rework Percentage
-
First Pass Yield
Operational KPIs
-
Equipment Downtime
-
Cycle Time
-
Line Utilization Rate
Workforce KPIs
-
Labor Productivity
-
Overtime Ratio
-
Training Effectiveness
Because these KPIs measure operational health, companies achieve better control.
Advantages of Heavy Vehicle Assembly KPI Dashboard in Excel
Implementing this dashboard offers several operational benefits.
1. Centralized Performance Monitoring
Teams analyze all KPIs in one location instead of multiple files.
2. Real-Time Decision Support
As soon as users update data, results refresh instantly.
3. Improved Production Visibility
Managers quickly detect inefficiencies and delays.
4. Better Target Alignment
Employees understand performance expectations clearly.
5. Historical Performance Comparison
Year-over-year analysis supports strategic planning.
6. Easy Implementation
Since Excel remains widely used, teams adopt the dashboard quickly.
7. Cost-Effective Analytics Solution
Organizations avoid expensive software investments.
How Does the Dashboard Improve Manufacturing Decisions?
The dashboard transforms raw data into actionable insights.
For example:
-
If defect rates increase, quality teams investigate immediately.
-
If productivity declines, supervisors adjust staffing.
-
If downtime rises, maintenance teams intervene faster.
Therefore, organizations shift from reactive management to proactive decision-making.
How to Implement the Heavy Vehicle Assembly KPI Dashboard?
Click to Purchases Heavy Vehicle Assembly KPI Dashboard in Excel
Follow these steps for successful deployment.
Step 1: Define KPIs
Identify operational metrics aligned with business goals.
Step 2: Populate KPI Definitions
Enter KPI details in the KPI Definition sheet.
Step 3: Set Performance Targets
Define monthly targets clearly.
Step 4: Enter Historical Data
Input previous-year performance.
Step 5: Update Actual Data Regularly
Enter current performance numbers weekly or monthly.
Step 6: Analyze Dashboard Insights
Review trends and comparisons regularly.
Best Practices for the Heavy Vehicle Assembly KPI Dashboard
To maximize dashboard effectiveness, follow these practices.
Maintain Data Accuracy
Always validate input data before analysis.
Update Data Consistently
Schedule regular updates to ensure reliability.
Focus on Key Metrics
Avoid tracking too many KPIs simultaneously.
Use Trend Analysis Frequently
Review long-term performance instead of single-month results.
Train Team Members
Ensure all users understand KPI definitions.
Standardize Data Entry
Use consistent formats across departments.
Common Challenges and How to Overcome Them
Challenge 1: Inconsistent Data Entry
Solution: Create standardized input rules.
Challenge 2: Too Many KPIs
Solution: Focus on strategic indicators only.
Challenge 3: Lack of User Adoption
Solution: Provide training and simplify navigation.
Why Excel Is Still Powerful for Manufacturing Dashboards?
Although many BI tools exist, Excel remains highly effective.
Key Reasons:
-
Familiar interface
-
Flexible calculations
-
Easy customization
-
No additional software cost
-
Quick deployment
Therefore, Excel dashboards continue to support manufacturing analytics successfully.
Future of KPI Tracking in Heavy Vehicle Assembly
Manufacturing continues evolving with Industry 4.0 technologies. However, structured KPI tracking remains essential.
Organizations increasingly combine:
-
Excel dashboards
-
Automation tools
-
IoT data integration
-
Predictive analytics
Consequently, KPI dashboards become the foundation for smart manufacturing systems.
Conclusion
The Heavy Vehicle Assembly KPI Dashboard in Excel provides a structured, practical, and powerful solution for monitoring manufacturing performance. By combining KPI tracking, trend analysis, and automated comparisons, the dashboard enables organizations to improve operational visibility and decision-making.
Moreover, its user-friendly structure allows teams to implement it quickly without technical complexity. As companies focus more on efficiency, quality, and productivity, KPI dashboards become essential management tools.
Therefore, organizations that adopt structured KPI monitoring gain a competitive advantage through data-driven manufacturing excellence.
Frequently Asked Questions (FAQs)
What is the purpose of a Heavy Vehicle Assembly KPI Dashboard?
The dashboard helps organizations monitor production, quality, and operational performance using measurable indicators.
Can beginners use this Excel dashboard?
Yes. The template uses simple navigation and structured input sheets, so beginners can use it easily.
How often should users update KPI data?
Teams should update data monthly or weekly depending on operational needs.
Can companies customize KPIs?
Yes. Users can modify KPI definitions, targets, and metrics based on business requirements.
Does the dashboard support year-over-year comparison?
Yes. The Previous Year sheet enables direct performance comparison.
Is Excel suitable for manufacturing analytics?
Yes. Excel offers flexibility, automation, and affordability, which makes it ideal for KPI tracking.
Visit our YouTube channel to learn step-by-step video tutorials