Managing hedge fund data without a structured reporting system often creates confusion, delays, and missed insights. Moreover, when portfolio managers and analysts depend on scattered spreadsheets, decision-making slows down. Therefore, a Hedge Funds Dashboard in Excel becomes a powerful solution for tracking performance, assets, returns, and fund activity in one centralized view.
In this detailed guide, you will learn what a Hedge Funds Dashboard in Excel is, why hedge fund professionals need it, how it works, its structure, key features, advantages, best practices, and frequently asked questions. By the end of this article, you will clearly understand how a ready-to-use Hedge Funds Dashboard in Excel supports faster, clearer, and more confident investment decisions.
What Is a Hedge Funds Dashboard in Excel?
Click to Purchases Hedge Funds Dashboard in Excel
A Hedge Funds Dashboard in Excel is a structured and interactive reporting tool designed to monitor hedge fund performance metrics such as Assets Under Management (AUM), Net Asset Value (NAV), active fund percentage, benchmark returns, and year-to-date (YTD) returns.
Instead of reviewing multiple Excel sheets or static reports, hedge fund teams can analyze all key indicators on a single dashboard. As a result, decision-makers gain instant visibility into fund performance across strategies, regions, countries, and time periods.
Because Excel powers this dashboard, users can easily update data, apply filters, and customize visuals without advanced technical skills. Consequently, the dashboard becomes a practical and cost-effective analytics solution.
Why Do Hedge Fund Managers Need a Dashboard in Excel?
Hedge fund operations rely heavily on accurate and timely data. However, manual reporting often introduces errors and delays. Therefore, a Hedge Funds Dashboard in Excel plays a critical role in daily and strategic decision-making.
Key reasons hedge fund teams use dashboards include:
-
Centralized view of fund performance
-
Faster analysis of NAV, AUM, and returns
-
Improved transparency for stakeholders
-
Better comparison across strategies and regions
-
Reduced reporting effort and manual work
Moreover, Excel dashboards allow teams to remain flexible while maintaining full control over their data.
How Does a Hedge Funds Dashboard in Excel Work?
A Hedge Funds Dashboard in Excel works by pulling structured data from a dedicated data sheet and displaying it through interactive charts, slicers, and KPI cards.
First, users enter or update fund data in the Data Sheet. Then, Excel formulas, pivot tables, and charts automatically update all dashboard visuals. As a result, users always see the latest performance metrics.
Additionally, slicers allow users to filter data by strategy, region, country, or month. Therefore, analysis becomes quick and intuitive.
What Is the Structure of the Hedge Funds Dashboard in Excel?
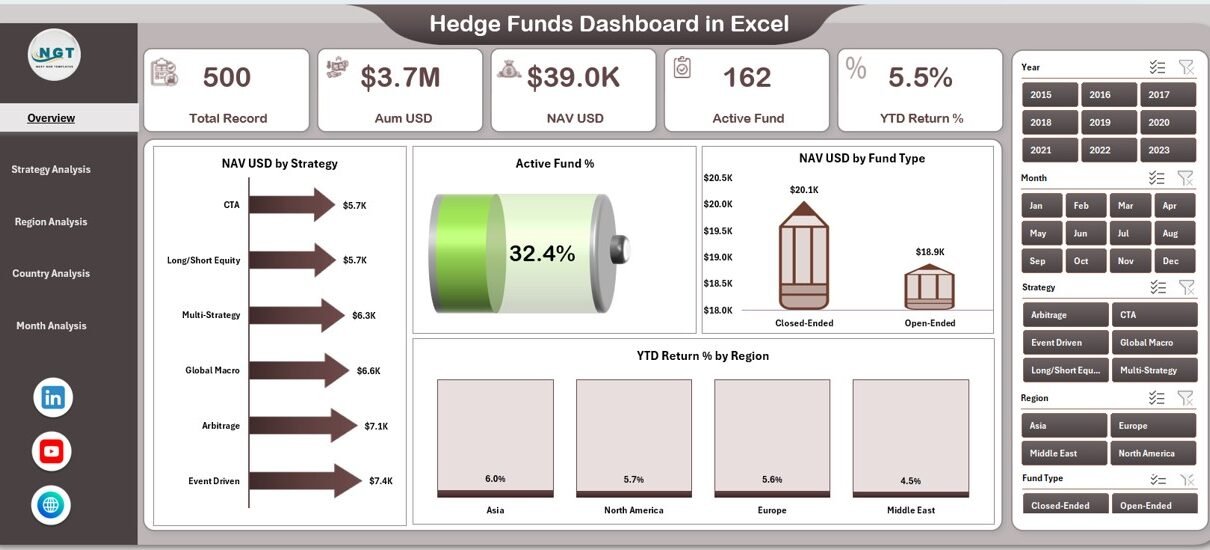
This ready-to-use Hedge Funds Dashboard in Excel includes five analytical pages, a page navigator, and a supporting data structure. Each page focuses on a specific dimension of hedge fund performance.
What Is the Page Navigator and Why Is It Important?
The Page Navigator, located on the left side of the dashboard, allows users to move seamlessly between different analysis pages.
Benefits of the Page Navigator include:
-
Faster navigation across dashboard pages
-
Improved user experience
-
Clear dashboard flow for presentations
-
Reduced dependency on Excel tabs
Therefore, the Page Navigator ensures that users focus on insights rather than navigation.
Click to Purchases Hedge Funds Dashboard in Excel
What Does the Overview Page Show?
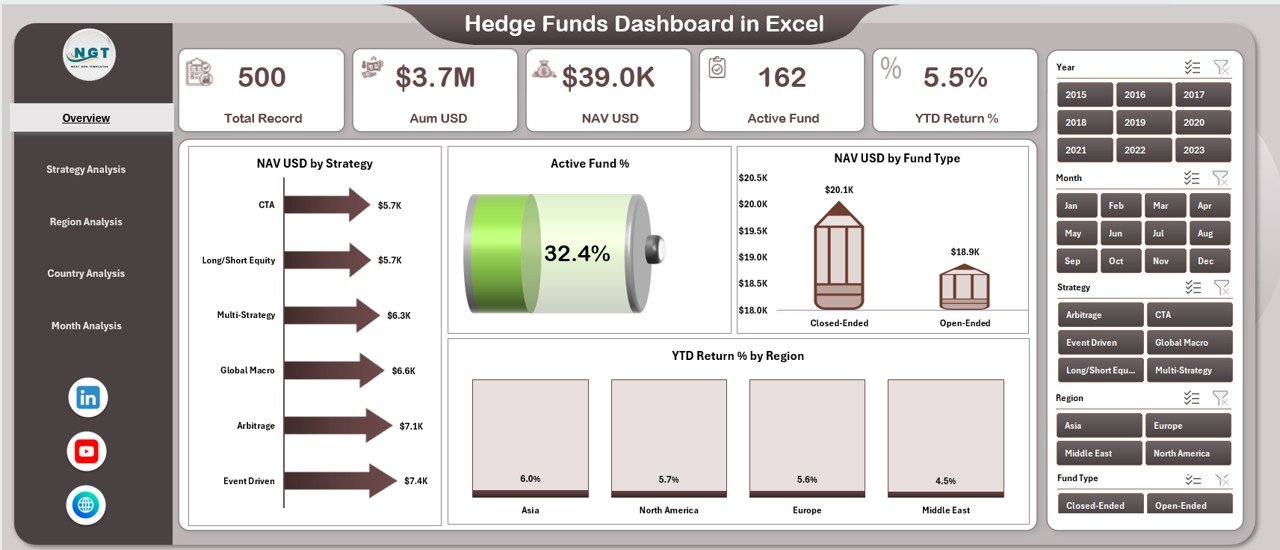
The Overview Page serves as the main snapshot of hedge fund performance. This page provides high-level insights that decision-makers need at a glance.
Key elements of the Overview Page:
-
Right-side slicer for quick filtering
-
Four KPI cards showing key summary metrics
-
Four performance charts for strategic overview
Charts included on the Overview Page:
-
NAV USD by Strategy
-
Active Fund %
-
NAV USD by Fund Type
-
YTD Return % by Region
As a result, fund managers can instantly understand overall performance trends and identify areas that need attention.
How Does the Strategy Analysis Page Help Fund Managers?
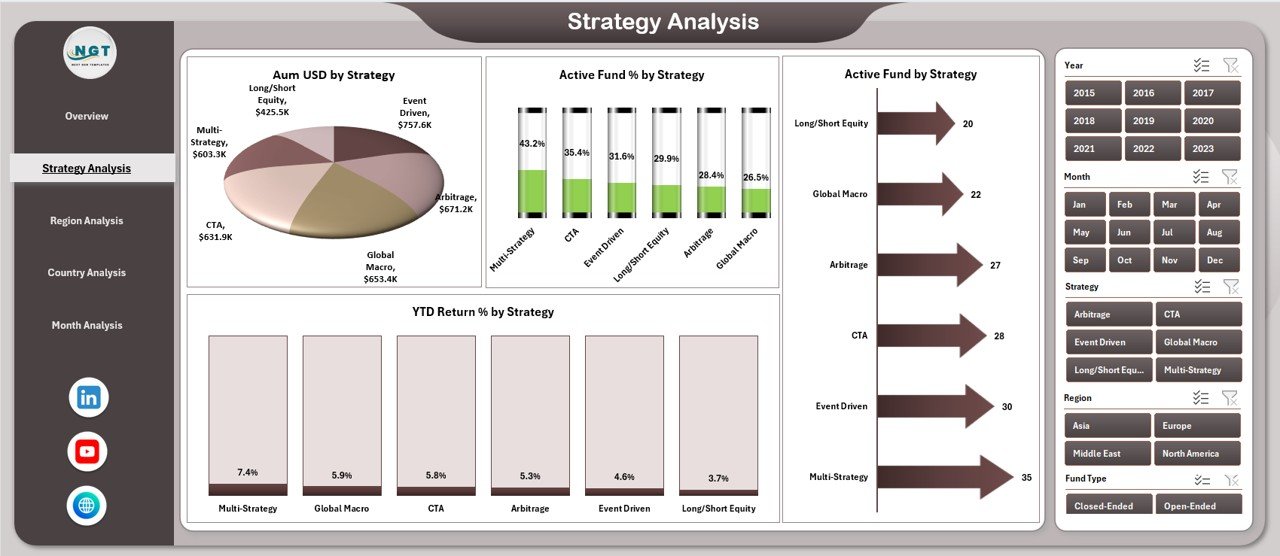
The Strategy Analysis Page focuses on performance across different hedge fund strategies. This page allows users to compare strategies and identify top and underperformers.
Key features of the Strategy Analysis Page:
-
Right-side slicer for filtering
-
Four strategy-focused charts
Charts included:
-
AUM USD by Strategy
-
Active Fund % by Strategy
-
Active Fund Count by Strategy
-
YTD Return % by Strategy
Therefore, hedge fund teams can allocate capital more effectively and refine investment strategies.
Why Is the Region Analysis Page Important?
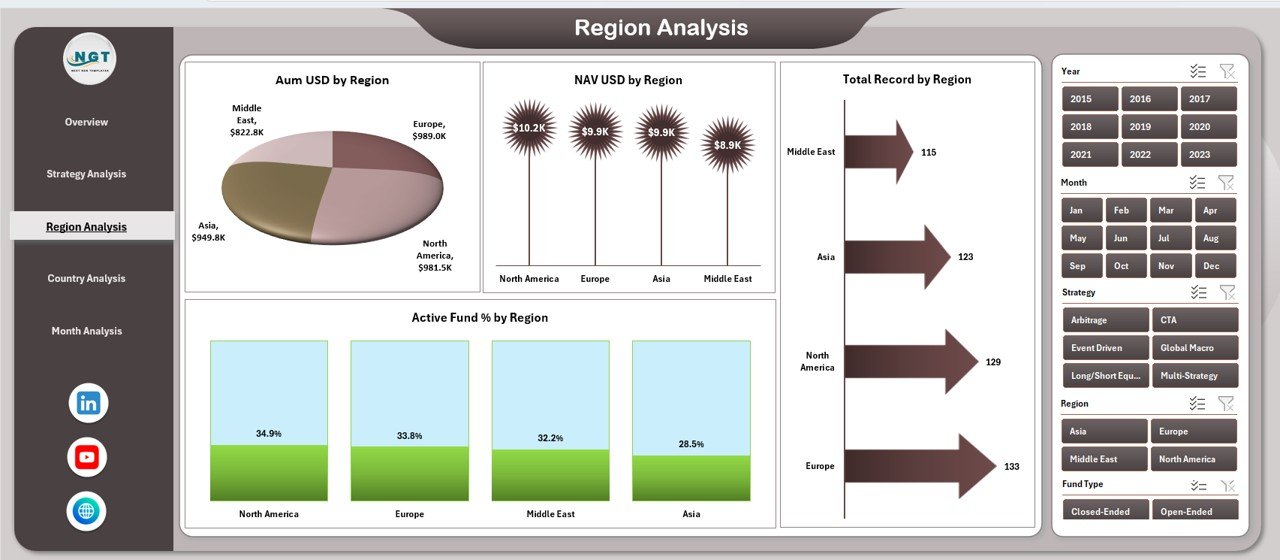
Hedge funds often operate across multiple regions. Consequently, regional performance analysis becomes essential.
The Region Analysis Page highlights how funds perform across different geographic regions.
Key elements of the Region Analysis Page:
-
Right-side slicer for region selection
-
Four region-based performance charts
Charts included:
-
AUM USD by Region
-
Active Fund % by Region
-
NAV USD by Region
-
Total Record Count by Region
As a result, managers can identify strong and weak regions and adjust exposure accordingly.
Click to Purchases Hedge Funds Dashboard in Excel
What Insights Does the Country Analysis Page Provide?
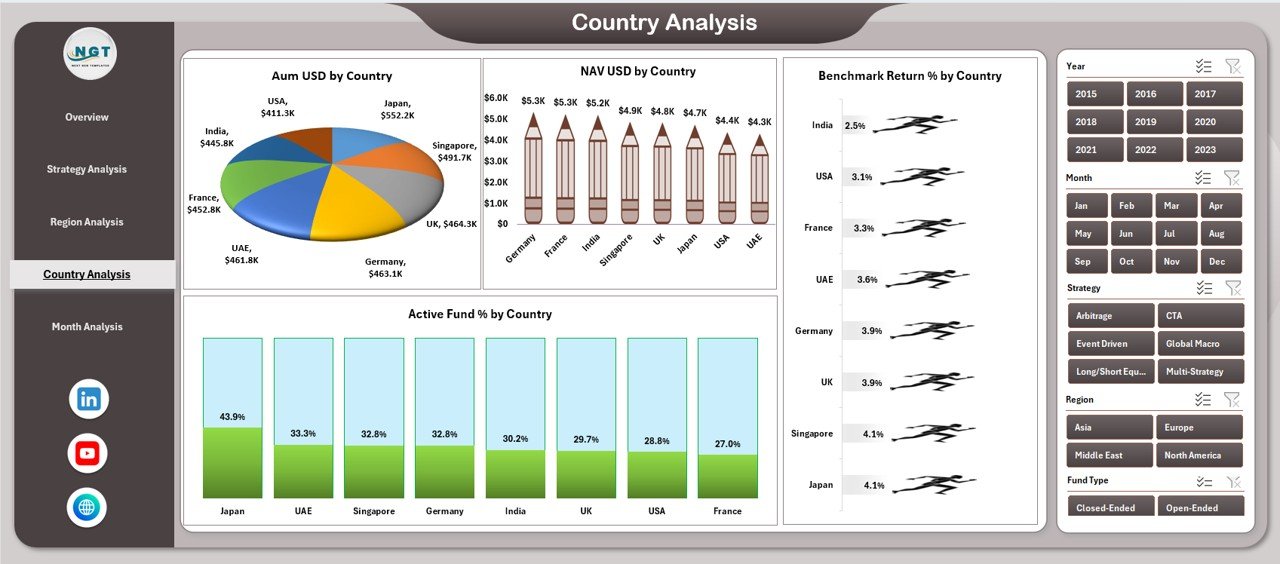
The Country Analysis Page drills deeper into individual country-level performance. This page supports granular analysis for global hedge fund operations.
Key features of the Country Analysis Page:
-
Right-side slicer for country filtering
-
Four detailed country-level charts
Charts included:
-
AUM USD by Country
-
Active Fund % by Country
-
NAV USD by Country
-
Benchmark Return % by Country
Therefore, fund managers can compare fund performance against benchmarks and refine country-level strategies.
How Does the Month Analysis Page Support Trend Analysis?
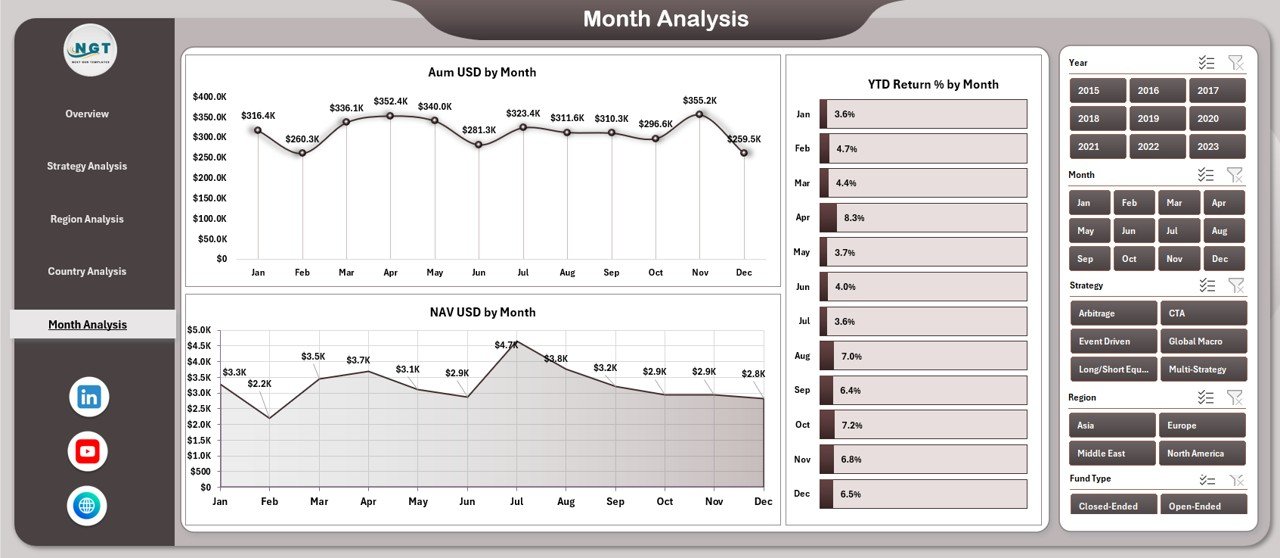
The Month Analysis Page focuses on time-based performance trends. This page allows users to track growth, volatility, and consistency over time.
Key components of the Month Analysis Page:
-
Right-side slicer for month selection
-
Three time-series charts
Charts included:
-
AUM USD by Month
-
NAV USD by Month
-
YTD Return % by Month
As a result, users can identify seasonal trends and performance patterns more effectively.
What Role Do the Data Sheet and Support Sheet Play?
Click to Purchases Hedge Funds Dashboard in Excel
The Data Sheet acts as the backbone of the dashboard. Users enter all hedge fund data in a structured format on this sheet. Once updated, all dashboard visuals refresh automatically.
The Support Sheet contains helper tables, lookup values, and calculation logic that power slicers and charts. Therefore, users should avoid editing this sheet unless they understand its structure.
Advantages of Hedge Funds Dashboard in Excel
A Hedge Funds Dashboard in Excel offers several practical advantages for hedge fund professionals.
Key advantages include:
-
Centralized Reporting: Track all hedge fund metrics in one place
-
Improved Decision-Making: Gain instant insights with visual analytics
-
Cost-Effective Solution: Avoid expensive BI tools
-
Flexible and Customizable: Adjust metrics, charts, and layouts easily
-
User-Friendly Interface: No advanced technical skills required
-
Real-Time Updates: See updated results instantly after data entry
Moreover, Excel dashboards allow teams to maintain full control over their data without vendor dependency.
How Does a Hedge Funds Dashboard Improve Investment Decisions?
A Hedge Funds Dashboard in Excel transforms raw data into actionable insights. Instead of reviewing rows of numbers, users analyze visual trends and comparisons.
As a result:
-
Portfolio managers spot underperforming strategies faster
-
Risk teams monitor exposure across regions and countries
-
Executives review performance summaries during meetings
-
Analysts save time on manual reporting
Therefore, the dashboard directly supports smarter and faster investment decisions.
Best Practices for the Hedge Funds Dashboard in Excel
To get the maximum value from your Hedge Funds Dashboard in Excel, follow these best practices.
1. Keep Data Clean and Consistent
Always enter data in a standardized format. Moreover, avoid manual overrides in calculated fields.
2. Update Data Regularly
Schedule regular updates to ensure that dashboards always show current information.
3. Use Slicers Strategically
Limit slicers to meaningful dimensions such as strategy, region, country, and month.
4. Avoid Overcrowding Charts
Focus on clarity. Therefore, include only essential metrics on each page.
5. Protect Support Sheets
Lock support and calculation sheets to prevent accidental changes.
6. Validate Metrics Periodically
Review formulas and benchmark values regularly to maintain accuracy.
7. Use Clear Naming Conventions
Name metrics, charts, and sheets clearly for better usability.
By following these best practices, hedge fund teams can maintain a reliable and scalable reporting system.
Who Should Use a Hedge Funds Dashboard in Excel?
Click to Purchases Hedge Funds Dashboard in Excel
A Hedge Funds Dashboard in Excel suits a wide range of professionals, including:
-
Hedge fund managers
-
Portfolio managers
-
Investment analysts
-
Risk management teams
-
Finance and reporting teams
-
Executive leadership
Therefore, anyone involved in hedge fund performance tracking can benefit from this dashboard.
Conclusion: Why Choose a Hedge Funds Dashboard in Excel?
A Hedge Funds Dashboard in Excel provides a structured, visual, and efficient way to monitor hedge fund performance. By combining multiple analysis pages, interactive slicers, and clear charts, this dashboard eliminates reporting complexity.
Moreover, it improves transparency, supports data-driven decisions, and saves valuable time. Therefore, hedge fund professionals who want clarity, flexibility, and control should strongly consider using a Hedge Funds Dashboard in Excel.
Frequently Asked Questions About Hedge Funds Dashboard in Excel
What is a Hedge Funds Dashboard in Excel used for?
A Hedge Funds Dashboard in Excel tracks hedge fund performance metrics such as AUM, NAV, active fund percentage, and returns across strategies, regions, and time periods.
Can I customize the Hedge Funds Dashboard in Excel?
Yes, you can customize charts, metrics, layouts, and slicers based on your reporting needs.
Do I need advanced Excel skills to use this dashboard?
No, basic Excel knowledge is enough to update data and use slicers effectively.
How often should I update the dashboard data?
You should update the data as frequently as your reporting cycle requires, such as daily, weekly, or monthly.
Is this dashboard suitable for large hedge fund portfolios?
Yes, the dashboard supports scalable data structures and works well for both small and large hedge fund portfolios.
Can this dashboard replace BI tools?
While BI tools offer advanced analytics, a Hedge Funds Dashboard in Excel provides a cost-effective and flexible alternative for many hedge fund teams.
Visit our YouTube channel to learn step-by-step video tutorials