Hedge funds thrive on precision. Every investment decision, performance review, and risk assessment must rely on accurate data and actionable insights. Yet, tracking and managing multiple performance indicators across portfolios can quickly become overwhelming—especially when relying on manual spreadsheets or scattered reports.
That’s why the Hedge Funds KPI Dashboard in Excel is such a valuable tool. This ready-to-use template consolidates all key hedge-fund metrics—returns, risk, AUM, and portfolio performance—into one dynamic, visual dashboard. It empowers fund managers, analysts, and investors to make smarter decisions based on real-time data.
Click to Purchases Hedge Funds KPI Dashboard in Excel
What Is a Hedge Funds KPI Dashboard in Excel?
A Hedge Funds KPI Dashboard in Excel is an advanced yet easy-to-use tool designed to monitor, measure, and visualize key performance indicators (KPIs) for hedge-fund operations. It transforms raw financial data into interactive visuals that provide a 360-degree view of fund health.
Instead of juggling multiple reports, this Excel dashboard displays all metrics in one central place. It helps managers evaluate fund profitability, assess risk exposure, and measure investor satisfaction—all with just a few clicks.
Why It Matters
Hedge-fund success depends on the ability to track multiple performance dimensions: return consistency, liquidity, leverage, and compliance. This dashboard ensures complete visibility into every critical area so you can react quickly and stay ahead of the market.
Click to Purchases Hedge Funds KPI Dashboard in Excel
Key Features of the Hedge Funds KPI Dashboard in Excel
This powerful dashboard includes seven worksheets, each serving a distinct purpose to streamline data entry, tracking, and analysis.
1. Home Sheet
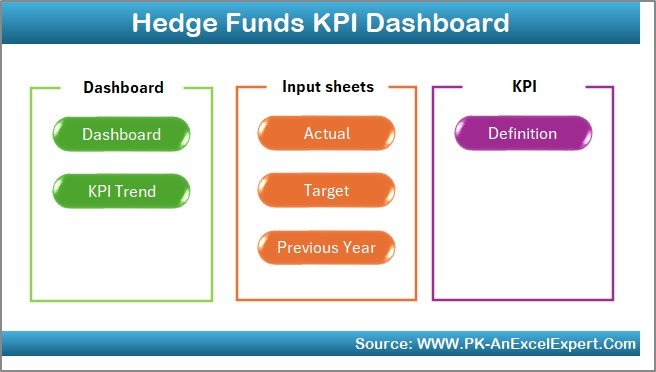
The Home Sheet acts as the index page of the workbook.
Key Highlights:
-
Includes six navigation buttons to access other sheets instantly.
-
Designed for an intuitive user experience.
-
Provides a professional look with clear navigation for analysts and investors.
It’s your central control panel for exploring the entire file.
2. Dashboard Sheet Tab
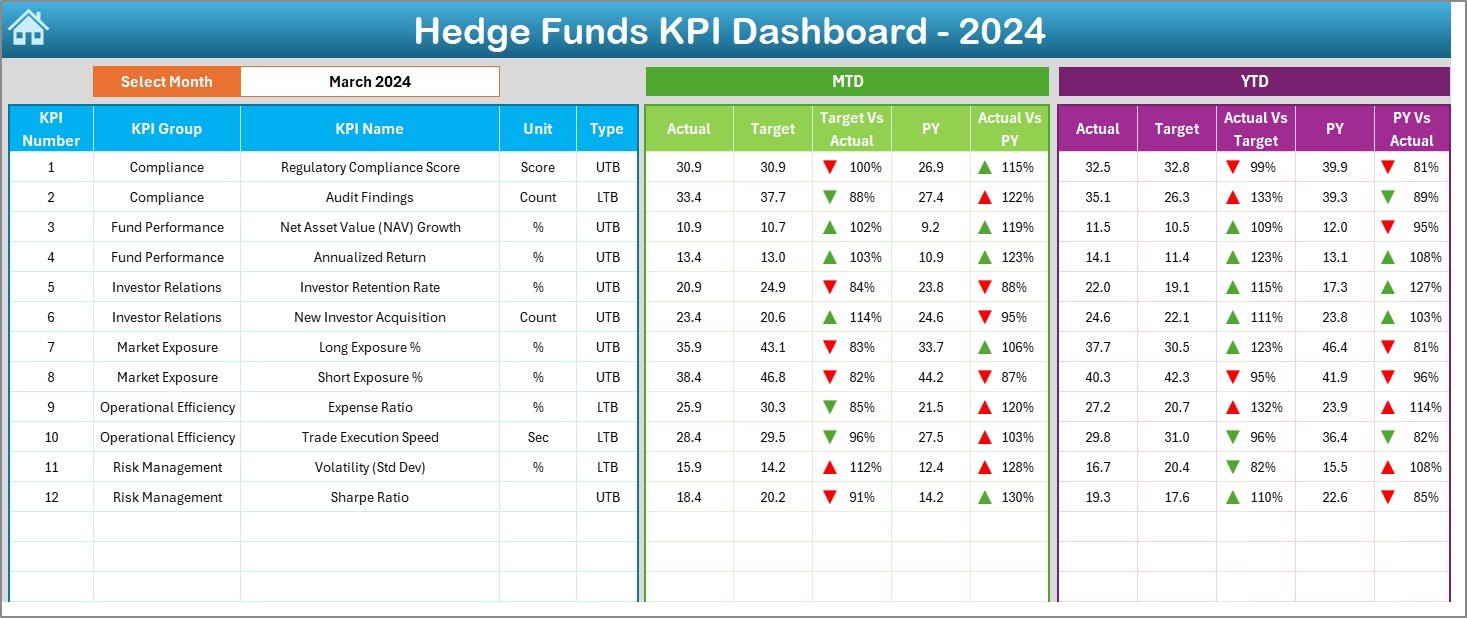
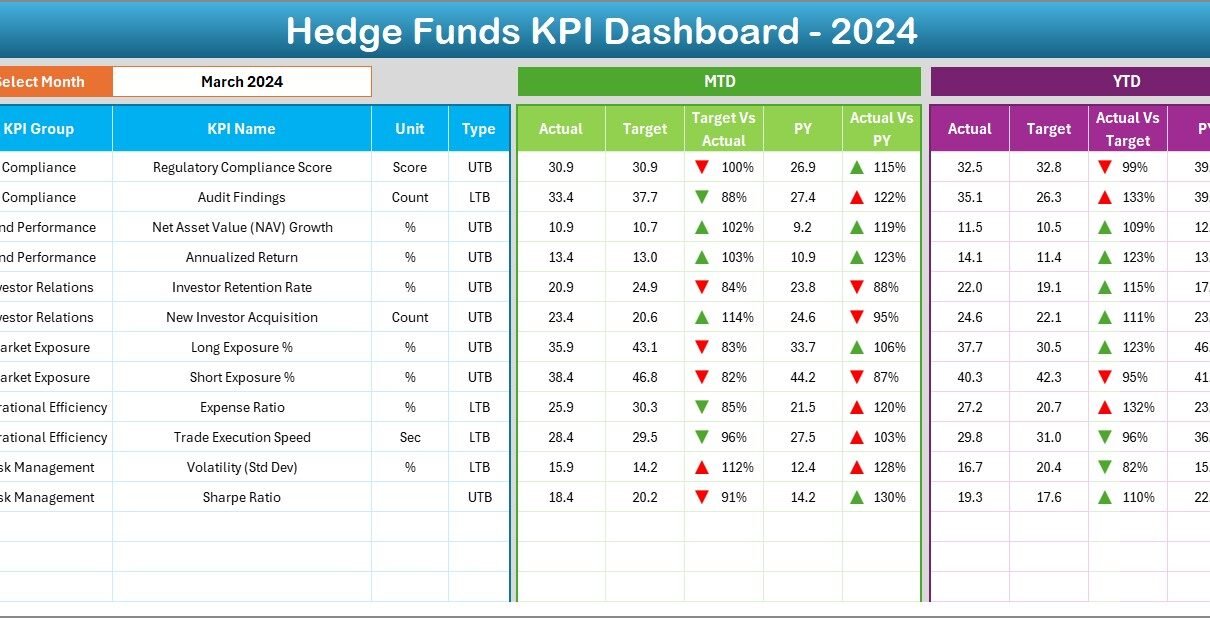
This is the main dashboard, where fund managers can view summarized KPI performance.
Key Functionalities:
-
Month Selection (Cell D3): Choose any month from a dropdown to automatically refresh all KPI data.
-
Performance Comparison: Displays MTD ( Month-to-Date ) and YTD ( Year-to-Date ) Actual, Target, and Previous-Year values.
-
Visual Indicators: Conditional formatting (↑↓ arrows and color codes) instantly highlights over- or under-performance.
-
Comprehensive Metrics: Covers returns, volatility, fund flows, drawdowns, and Sharpe ratio.
The dashboard sheet provides a snapshot of portfolio health, helping managers make informed tactical and strategic choices.
3. KPI Trend Sheet Tab
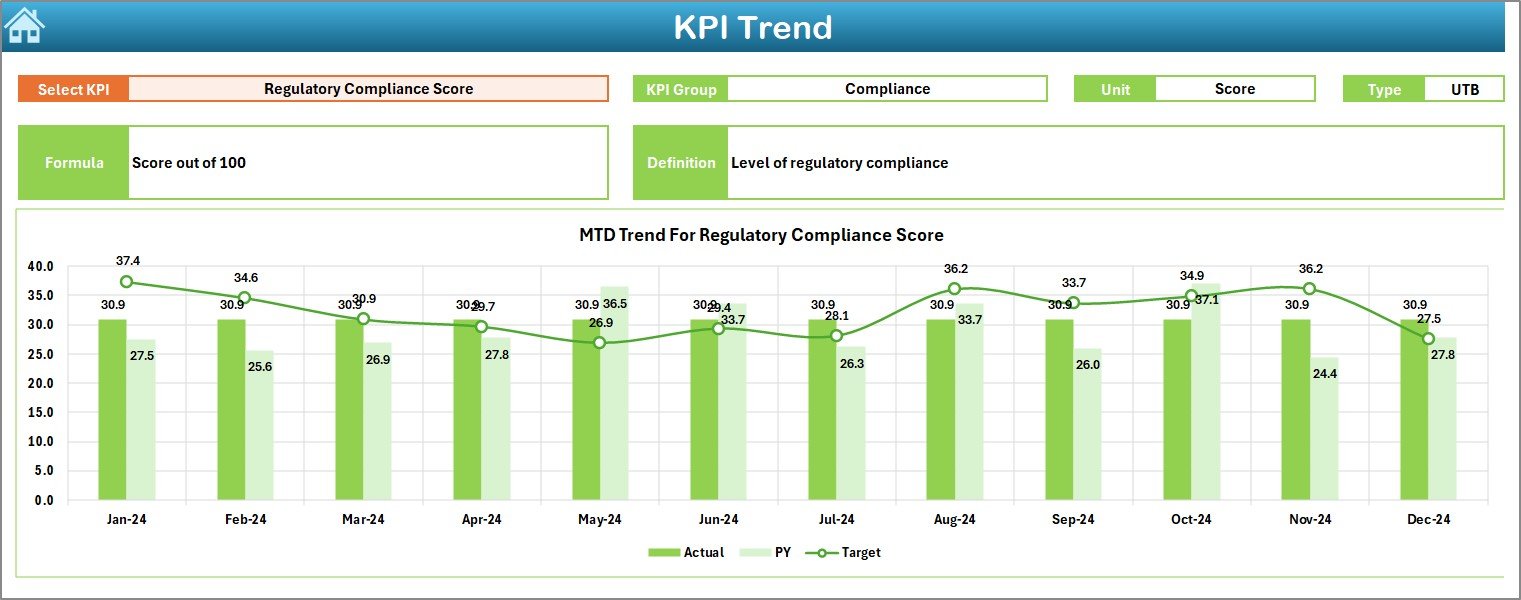
The KPI Trend Sheet offers time-based performance tracking for each KPI.
Features Include:
-
Dropdown Selector (Cell C3): Choose a KPI to display detailed analysis.
-
Auto-Generated Information: Displays KPI Group, Unit, Type (Lower the Better or Upper the Better), Formula, and Definition.
-
Trend Charts: MTD and YTD charts show Actual, Target, and Previous-Year values.
-
Insightful Patterns: Helps identify whether fund performance is improving, stable, or declining.
This sheet makes trend analysis effortless and visually appealing.
4. Actual Numbers Input Sheet
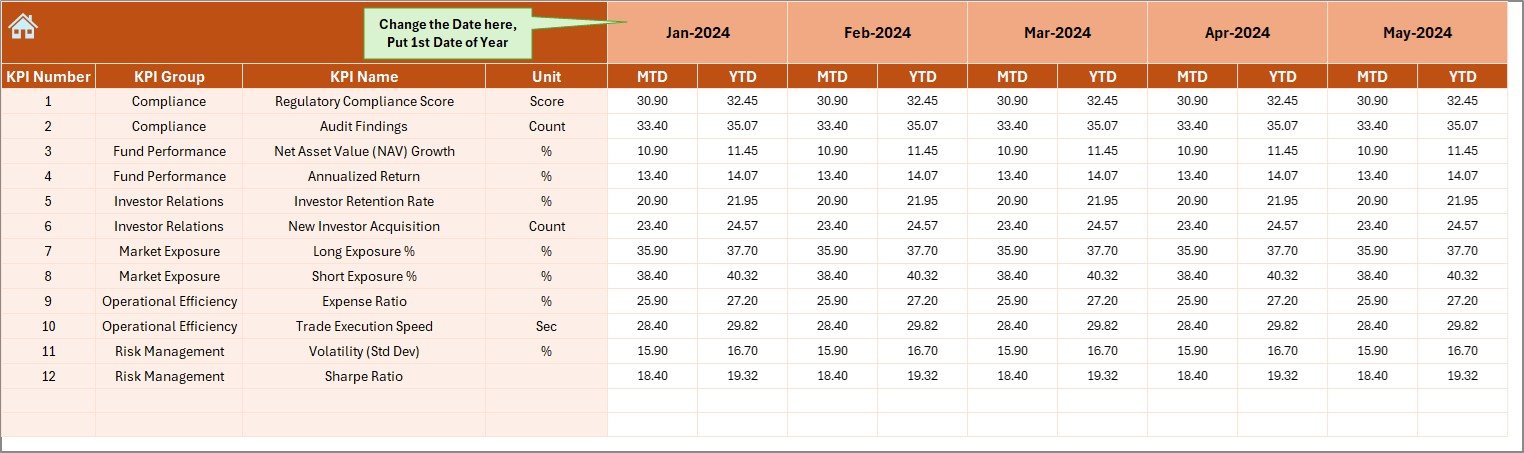
This sheet captures all current performance data for each KPI.
Key Highlights:
-
Enter both MTD and YTD actual values for every KPI.
-
The first month of the fiscal year is set from Cell E1.
-
As soon as data is entered, all other sheets update automatically.
This sheet ensures that the dashboard always reflects accurate, up-to-date figures.
5. Target Sheet Tab
Targets act as the performance benchmarks for every KPI.
Features:
-
Enter monthly MTD and YTD target values.
-
Update goals annually or quarterly depending on fund strategy.
-
Enables instant variance analysis across months.
Setting measurable targets ensures performance alignment with fund objectives.
6. Previous Year Numbers Sheet Tab
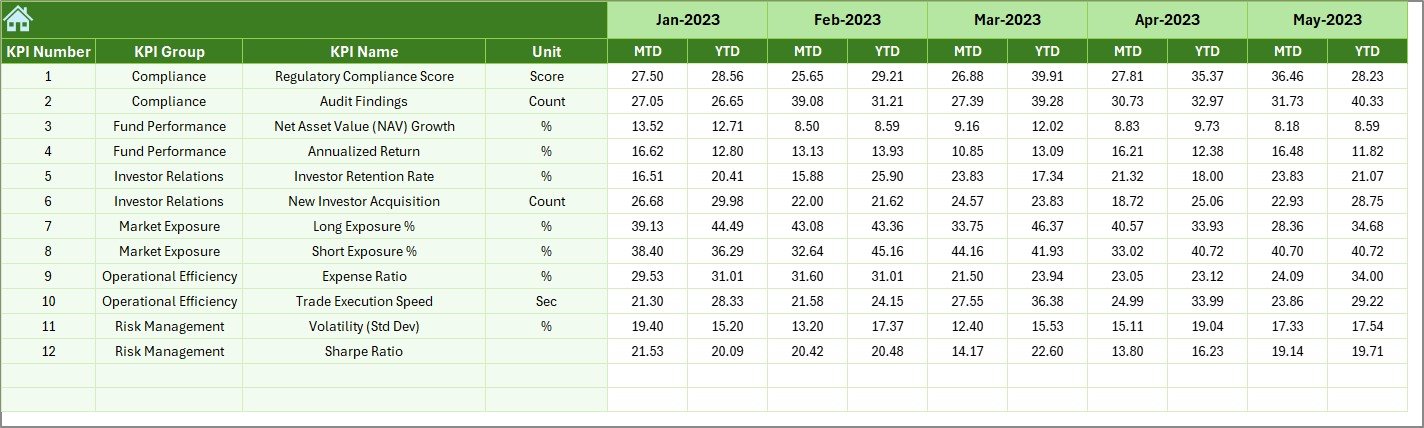
Historical data plays a key role in financial analysis.
Functions:
-
Input previous year’s MTD and YTD values.
-
Automatically compares PY vs Actual for quick trend detection.
-
Useful for year-over-year benchmarking and seasonal trend studies.
7. KPI Definition Sheet Tab
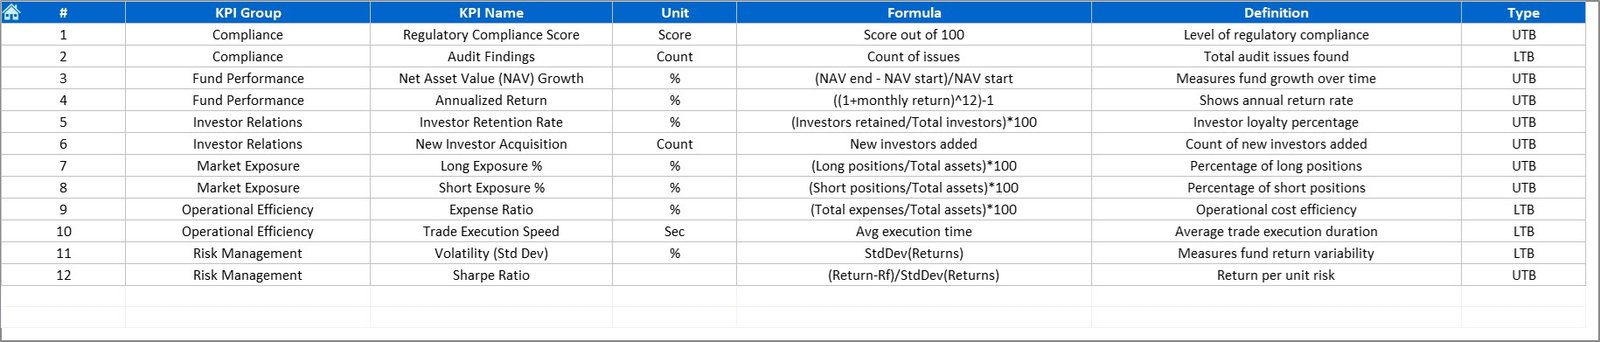
This tab defines and documents every KPI in the dashboard.
Includes Columns for:
-
KPI Name
-
KPI Group
-
Unit of Measurement
-
Formula
-
KPI Definition
-
Type (UTB / LTB)
A structured definition sheet ensures clarity, standardization, and consistent interpretation across the team.
Why Hedge Funds Need a KPI Dashboard
Hedge fund operations involve a mix of market, operational, and liquidity risks. Without systematic performance tracking, it’s difficult to detect underperforming areas or assess risk-adjusted returns.
A KPI Dashboard bridges this gap by providing a holistic view of both financial and operational metrics—allowing decision-makers to monitor everything in one place.
Benefits at a Glance
-
Better Decision-Making: Real-time visibility into returns, volatility, and portfolio risk.
-
Improved Accountability: Assign ownership to each KPI for transparency.
-
Data Accuracy: Automated formulas eliminate manual calculation errors.
-
Operational Efficiency: Reduce reporting time while improving analytical depth.
-
Investor Confidence: Clear visuals enhance transparency and credibility.
Advantages of the Hedge Funds KPI Dashboard in Excel
1. Real-Time Insights
As data is entered, visuals and charts refresh automatically to show the latest fund performance.
2. Comprehensive Visualization
Color-coded arrows and conditional formatting make it easy to spot trends and performance gaps.
3. Customizable Metrics
Modify KPIs, add benchmarks, or change formulas to suit your fund’s strategy.
4. Transparent Reporting
Consolidated dashboards simplify internal reviews and investor presentations.
5. Cost-Effective
Excel offers a powerful yet affordable alternative to complex BI tools.
6. Data Consistency
Single data entry point ensures accuracy and uniformity across sheets.
7. Scalability
Easily expand to include multiple funds or portfolios within the same template.
How to Use the Hedge Funds KPI Dashboard
Follow these simple steps to start using the dashboard efficiently:
Step 1: Enter KPI Definitions
List all KPIs with their formulas and units in the KPI Definition tab.
Step 2: Add Monthly Data
Input Actual, Target, and Previous-Year data in their respective sheets.
Step 3: Select Month for Analysis
Go to the Dashboard tab and pick the desired month from the dropdown.
Step 4: Review Performance Trends
Check the KPI Trend sheet to understand patterns and variations in performance.
Step 5: Make Data-Driven Decisions
Use color-coded alerts to take action where performance lags behind targets.
Best Practices for the Hedge Funds KPI Dashboard
To get maximum value from the dashboard, follow these best practices:
✅ Define clear and measurable KPIs aligned with fund objectives.
✅ Update data regularly to maintain accuracy.
✅ Validate formulas and data sources monthly.
✅ Assign KPI ownership for accountability.
✅ Use trend charts to track improvements and risks.
✅ Back up the Excel file securely to prevent data loss.
✅ Review targets quarterly to align with market conditions.
These steps keep the dashboard accurate, reliable, and decision-ready.
How the Dashboard Improves Decision-Making
Hedge funds rely on quick yet accurate decisions. This dashboard turns complex financial data into clear, visual insights.
Managers can instantly answer key questions such as:
-
Are our returns exceeding benchmarks?
-
How does our risk profile compare to last year?
-
Which KPI needs immediate attention?
By providing data-driven clarity, the dashboard reduces guesswork and enhances performance oversight.
Integration and Scalability
The dashboard works seamlessly within Excel but can also integrate with other systems:
-
Import data via Power Query or SQL connections.
-
Use macros for automated updates.
-
Export visuals for presentations or PDF reports.
It can scale across funds, making it ideal for multi-fund managers and investment firms.
Conclusion
The Hedge Funds KPI Dashboard in Excel is a powerful, data-driven tool that gives fund managers complete control over their performance metrics. With its intuitive structure, visual indicators, and automatic updates, it helps you monitor returns, manage risk, and ensure consistent investor value.
Start tracking your fund’s performance today and turn complex financial data into clear, actionable insights! 🚀
Click to Purchases Hedge Funds KPI Dashboard in Excel
Frequently Asked Questions (FAQs)
1. What is a Hedge Funds KPI Dashboard in Excel?
It is a ready-to-use Excel tool that monitors key hedge-fund performance indicators such as returns, volatility, and risk.
2. How many KPIs can I track in this dashboard?
You can track 10–15 core KPIs for optimal clarity and focus.
3. Can I customize the KPIs?
Yes, you can add, modify, or remove KPIs to fit your fund’s strategy.
4. Do I need advanced Excel skills?
No, the dashboard is user-friendly with automatic formulas and dropdowns.
5. How often should I update data?
Monthly updates are recommended for accurate performance tracking.
6. Can this dashboard help in investor presentations?
Absolutely. Its visual charts and summary cards make it perfect for presenting performance data to clients and stakeholders.
7. Is this suitable for multi-fund managers?
Yes. You can easily duplicate the template to track multiple funds side by side.
8. What is the difference between MTD and YTD tracking?
MTD shows the current month’s performance, while YTD reflects cumulative performance from the start of the year.
Click to Purchases Hedge Funds KPI Dashboard in Excel
Visit our YouTube channel to learn step-by-step video tutorials