Home décor retail has become highly competitive. Customers expect trendy products, seamless experiences, and attractive pricing. At the same time, store owners must control costs, manage promotions, and improve profitability. However, when data stays scattered across Excel files, POS systems, and reports, decision-making becomes slow and unclear.
That is exactly why a Home Décor Stores Dashboard in Power BI plays a critical role in modern retail analytics.
In this in-depth guide, you will learn everything about a Home Décor Stores Dashboard in Power BI. We will explain what it is, why it matters, how it works, its page-wise structure, advantages, best practices, and common questions answered clearly. By the end of this article, you will understand how this dashboard helps home décor retailers increase visibility, improve margins, and make confident business decisions.
Click to Purchases Home Décor Stores Dashboard in Power BI
What Is a Home Décor Stores Dashboard in Power BI?
A Home Décor Stores Dashboard in Power BI is a centralized analytics and reporting solution designed to track sales, costs, profitability, promotions, and trends for home décor retail businesses.
Instead of reviewing multiple spreadsheets or manual reports, store managers use one interactive Power BI dashboard to analyze performance. As a result, they gain real-time visibility into marketing spend, operating costs, gross profit, and sales trends.
Moreover, Power BI transforms raw retail data into meaningful visuals such as charts, cards, and trend graphs. Because Power BI supports slicers, users can filter data by customer type, product category, promotion type, region, or month. Therefore, decision-makers can quickly drill down into performance details without technical effort.
Why Do Home Décor Stores Need a Power BI Dashboard?
Home décor businesses manage many moving parts. They handle diverse product categories, seasonal demand, regional variations, and marketing campaigns. However, without proper analytics, these complexities create confusion.
A Home Décor Stores Dashboard in Power BI solves these challenges in several ways:
-
It centralizes all key retail metrics in one place
-
It improves visibility across sales, costs, and profitability
-
It enables faster and more accurate decision-making
-
It supports strategic planning and cost control
-
It highlights trends and performance gaps early
Therefore, retailers no longer rely on guesswork. Instead, they use data-driven insights to grow sustainably.
How Does a Home Décor Stores Dashboard in Power BI Work?
The dashboard connects to structured data sources such as Excel files, ERP systems, or POS data. After that, Power BI processes and models the data. Then, it displays insights through interactive visuals.
Because slicers exist across pages, users can filter information instantly. For example, you can analyze marketing cost by region or compare gross profit across sales channels. As a result, the dashboard responds dynamically to user selections.
Most importantly, Power BI updates visuals automatically when new data enters the system. Therefore, store managers always see the latest performance metrics.
What Are the Key Pages in a Home Décor Stores Dashboard in Power BI?
This Home Décor Stores Dashboard in Power BI contains five powerful pages, each designed to answer specific business questions. Let us explore each page in detail.
Overview Page: What Is Happening Across the Business?
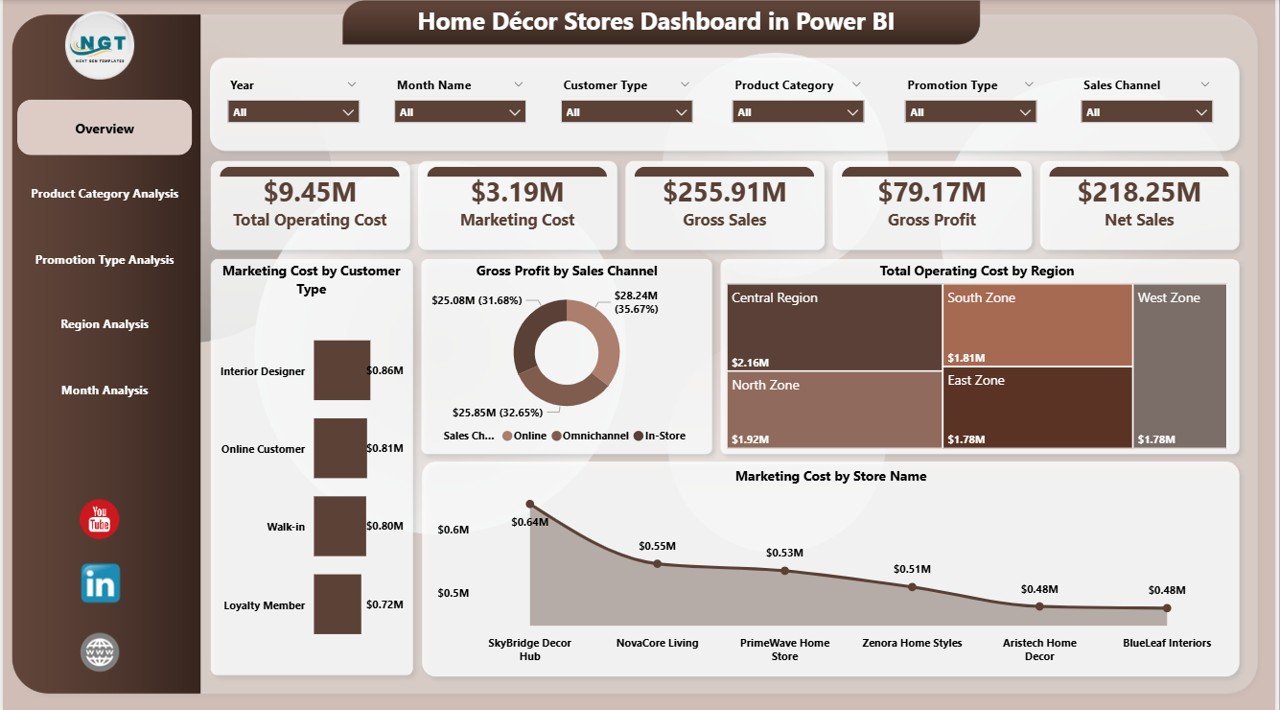
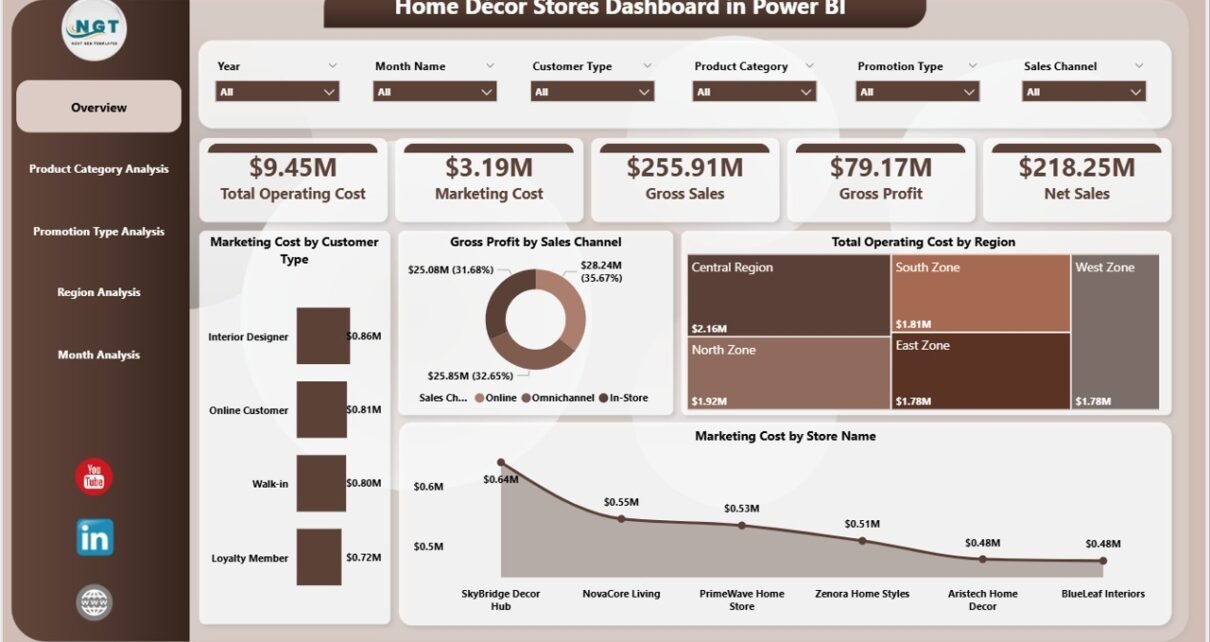
The Overview Page serves as the main entry point of the dashboard. It provides a high-level snapshot of overall performance.
Click to Purchases Home Décor Stores Dashboard in Power BI
Key Features of the Overview Page
-
Interactive slicers to filter data easily
-
Four KPI cards showing critical metrics
-
Four charts that summarize cost and profit performance
Key Visuals on the Overview Page
-
Marketing Cost by Customer Type
This chart helps identify which customer segments require higher marketing investment. As a result, retailers can optimize targeting strategies. -
Gross Profit by Sales Channel
This visual shows how much profit each sales channel generates. Therefore, managers can focus on high-margin channels. -
Total Operating Cost by Region
This chart highlights cost variations across regions. Consequently, cost control strategies become more effective. -
Marketing Cost by Store Name
This insight helps compare marketing efficiency across individual stores.
Overall, the Overview Page answers one important question: Is the business performing well at a glance?
Product Category Analysis: Which Categories Drive Costs and Performance?
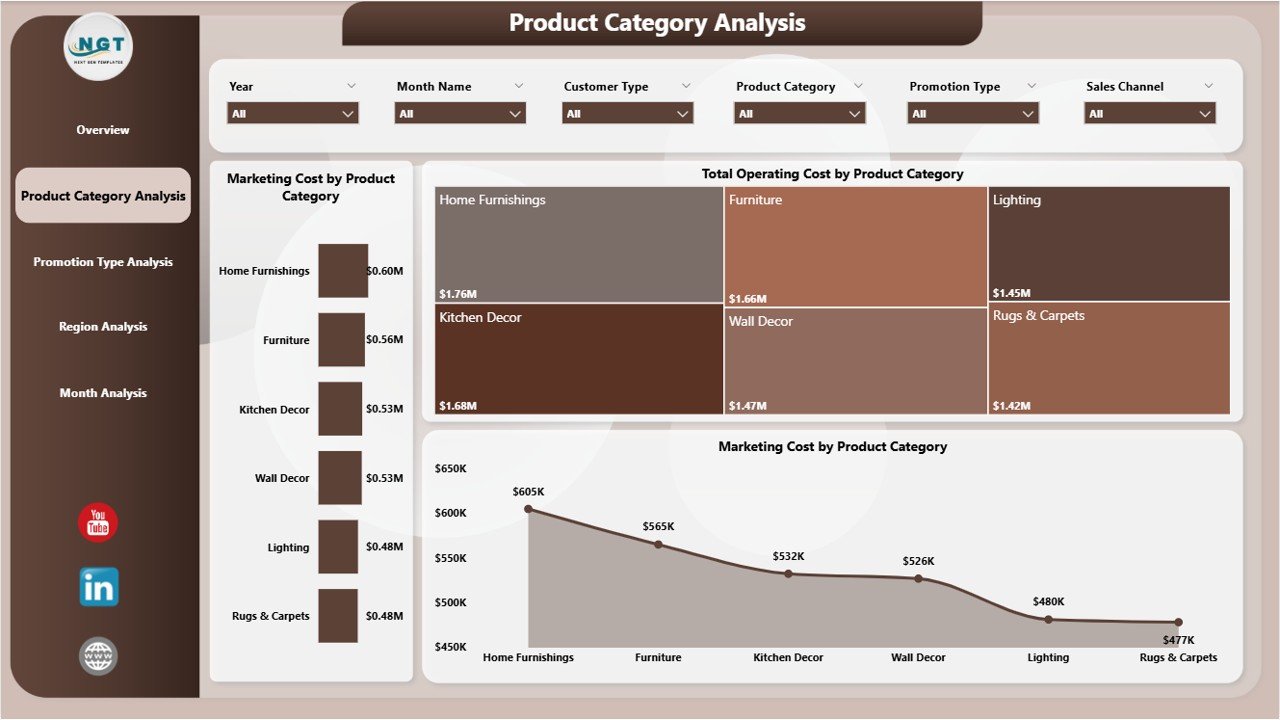
The Product Category Analysis Page focuses on category-level performance. Since home décor stores sell diverse items such as furniture, lighting, décor accessories, and furnishings, category analysis becomes essential.
Key Visuals on the Product Category Analysis Page
-
Marketing Cost by Product Category
This chart shows how much marketing budget each category consumes. Therefore, retailers can rebalance spending. -
Total Operating Cost by Product Category
This visual highlights cost-heavy categories. As a result, managers can review supplier pricing or logistics efficiency. -
Marketing Cost Distribution by Product Category
This insight helps understand how marketing efforts spread across categories.
Because this page offers category-level clarity, retailers can identify profitable and underperforming segments quickly.
Click to Purchases Home Décor Stores Dashboard in Power BI
Promotion Type Analysis: Which Promotions Deliver Real Value?
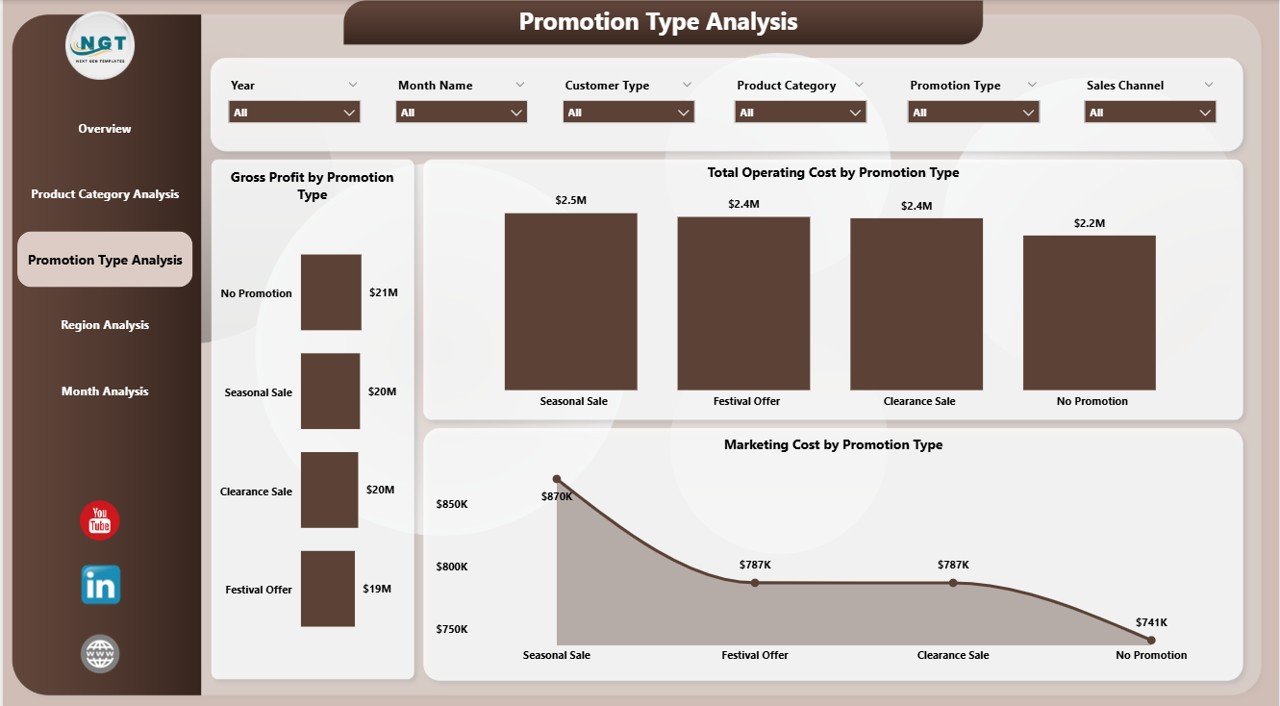
Promotions drive footfall and sales. However, not all promotions deliver equal profitability. The Promotion Type Analysis Page answers this exact concern.
Key Visuals on the Promotion Type Analysis Page
-
Gross Profit by Promotion Type
This chart reveals which promotions generate higher profits. Therefore, retailers can repeat successful campaigns. -
Total Operating Cost by Promotion Type
This visual shows the cost impact of each promotion. As a result, managers avoid high-cost, low-return offers. -
Marketing Cost by Promotion Type
This insight helps evaluate marketing spend effectiveness across promotion strategies.
With this analysis, retailers stop relying on assumptions. Instead, they base promotional decisions on solid data.
Region Analysis: How Do Different Regions Perform?
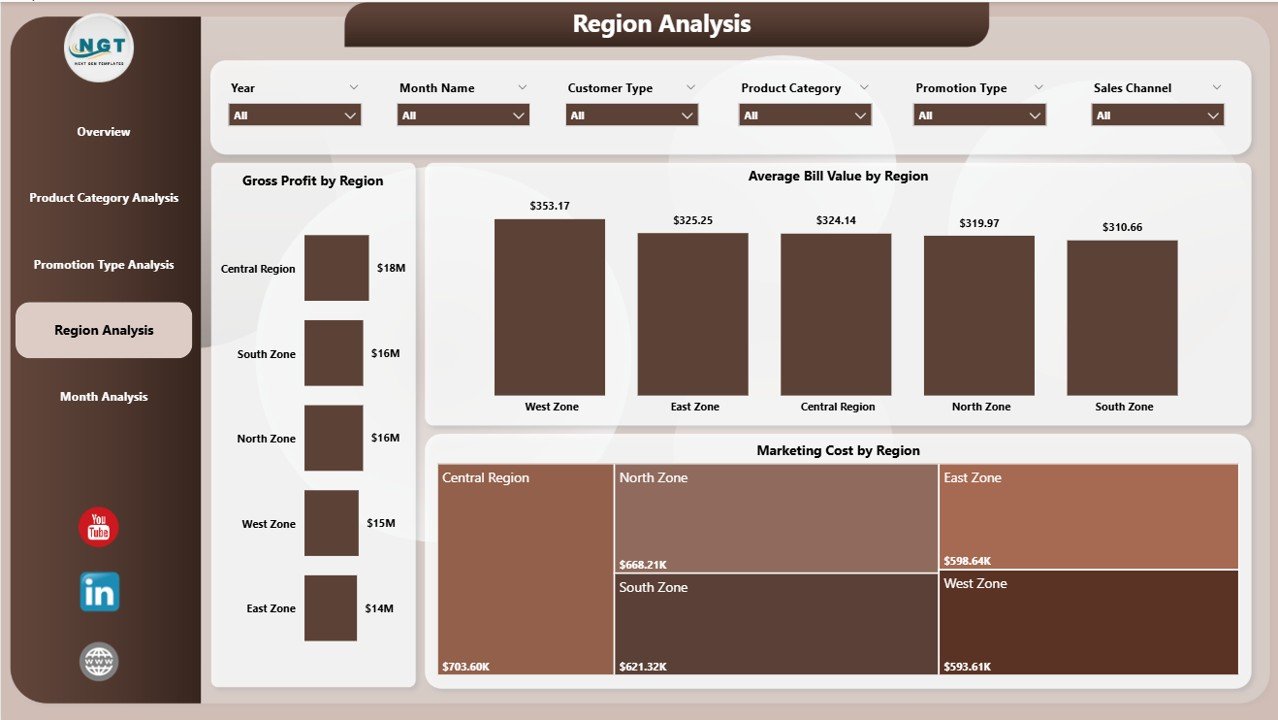
Home décor demand varies by location. Therefore, regional performance analysis becomes critical. The Region Analysis Page focuses on geographical insights.
Key Visuals on the Region Analysis Page
-
Gross Profit by Region
This chart highlights which regions contribute most to profit. -
Average Bill Value by Region
This visual shows customer spending behavior across regions. -
Marketing Cost by Region
This insight helps compare marketing efficiency geographically.
Because of these visuals, store managers can customize pricing, marketing, and inventory strategies region-wise.
Monthly Trends: How Is Performance Changing Over Time?
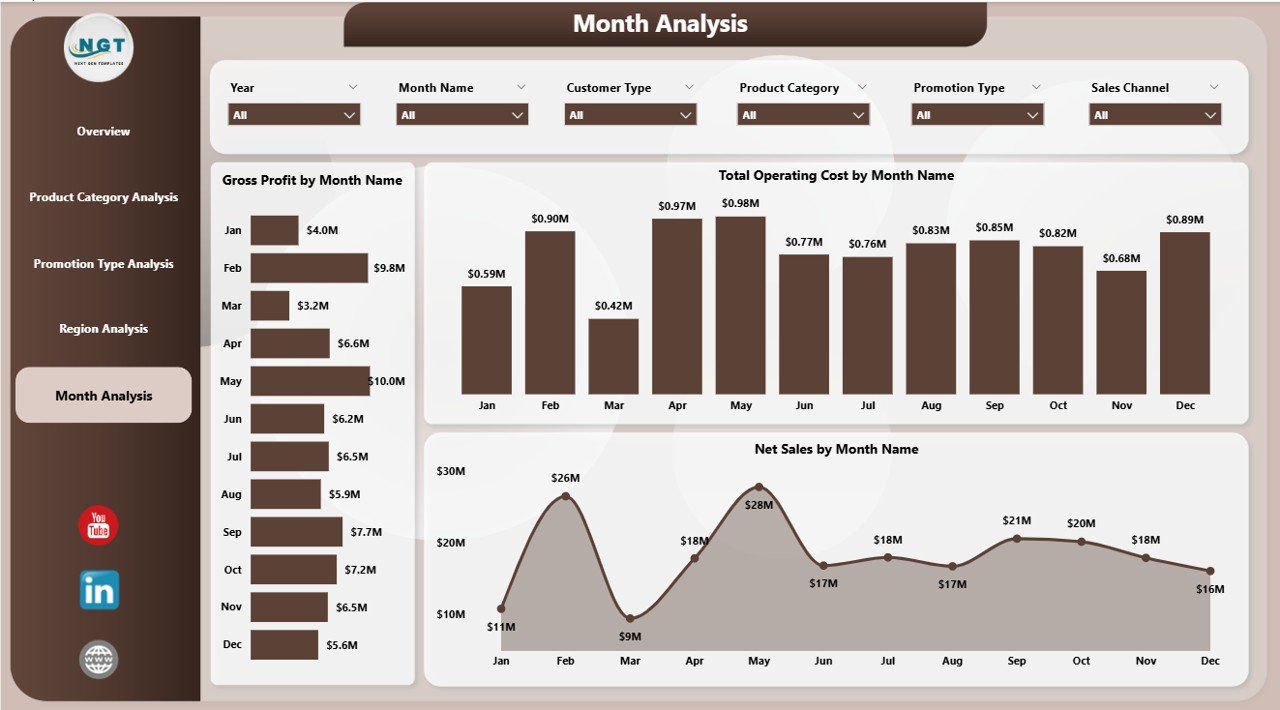
The Monthly Trends Page focuses on time-based analysis. It helps retailers track performance consistency and seasonality.
Key Visuals on the Monthly Trends Page
-
Gross Profit by Month
This trend shows profitability fluctuations throughout the year. -
Total Operating Cost by Month
This visual highlights cost patterns and spikes. -
Net Sales by Month
This chart tracks revenue growth or decline over time.
With these trends, decision-makers can forecast demand, plan promotions, and control costs proactively.
Advantages of Home Décor Stores Dashboard in Power BI
A Home Décor Stores Dashboard in Power BI delivers significant benefits to retailers of all sizes.
Centralized Retail Insights
-
View all KPIs in one dashboard
-
Eliminate scattered reports
-
Improve data clarity instantly
Improved Cost Control
-
Track marketing and operating costs accurately
-
Identify high-cost areas quickly
-
Optimize budgets effectively
Better Profitability Analysis
-
Monitor gross profit across channels and regions
-
Focus on high-margin products and promotions
-
Improve pricing strategies
Faster Decision-Making
-
Use real-time insights
-
Reduce manual reporting delays
-
Respond quickly to market changes
Scalable and Flexible Reporting
-
Add new stores or categories easily
-
Customize visuals without coding
-
Adapt dashboards as the business grows
Best Practices for the Home Décor Stores Dashboard in Power BI
Click to Purchases Home Décor Stores Dashboard in Power BI
To maximize the value of your dashboard, follow these best practices.
Define Clear KPIs
-
Select KPIs aligned with business goals
-
Avoid cluttering the dashboard
-
Focus on actionable metrics
Use Consistent Data Sources
-
Maintain clean and structured data
-
Validate data regularly
-
Avoid manual data entry errors
Design for Simplicity
-
Use clear labels and titles
-
Avoid excessive visuals on one page
-
Maintain consistent color themes
Leverage Slicers Effectively
-
Add slicers for region, category, and time
-
Ensure slicers sync across pages
-
Improve user experience with easy filtering
Review and Update Regularly
-
Refresh data frequently
-
Review KPIs monthly
-
Adjust visuals as business needs change
Who Can Benefit from a Home Décor Stores Dashboard in Power BI?
This dashboard supports multiple stakeholders across the organization.
-
Store Owners and Retail Managers
-
Marketing Teams
-
Finance and Accounting Teams
-
Operations Managers
-
Business Analysts and Consultants
Because each user group accesses relevant insights, collaboration improves across departments.
How Does Power BI Improve Retail Analytics Compared to Excel?
Excel works well for basic analysis. However, Power BI offers advanced capabilities.
-
Interactive visuals instead of static charts
-
Faster performance with large datasets
-
Automatic data refresh
-
Advanced filtering and drill-down
-
Professional-grade reporting
Therefore, Power BI becomes the preferred choice for scalable retail analytics.
Conclusion: Why Should You Use a Home Décor Stores Dashboard in Power BI?
A Home Décor Stores Dashboard in Power BI transforms complex retail data into clear and actionable insights. It empowers store owners to track costs, analyze profitability, optimize promotions, and understand customer behavior.
Instead of relying on manual reports, retailers gain real-time visibility across categories, regions, and time periods. As a result, they make faster, smarter, and more confident decisions.
If you want to scale your home décor business while maintaining control over costs and margins, this dashboard becomes an essential analytics tool.
Frequently Asked Questions About Home Décor Stores Dashboard in Power BI
What data do I need to build a Home Décor Stores Dashboard in Power BI?
You need sales data, marketing costs, operating expenses, promotion details, product categories, region information, and monthly timelines.
Can small home décor stores use Power BI dashboards?
Yes, small stores benefit significantly. Power BI scales easily and works well even with limited data.
How often should I update the dashboard?
You should update the dashboard monthly or weekly. Frequent updates improve accuracy and decision-making.
Do I need technical skills to use this dashboard?
No, Power BI dashboards offer user-friendly visuals and slicers. Business users can explore insights without technical expertise.
Can I customize the Home Décor Stores Dashboard in Power BI?
Yes, you can customize KPIs, visuals, slicers, and layouts based on your business needs.
How does this dashboard help improve profitability?
It identifies high-cost areas, profitable promotions, and strong sales channels. Therefore, managers optimize strategies to improve margins.
Visit our YouTube channel to learn step-by-step video tutorials