In the hospitality industry, tracking and analyzing performance metrics is essential for making data-driven decisions that improve guest satisfaction and business profitability. The Hospitality Dashboard in Excel is a ready-to-use, interactive tool designed to help you monitor key hotel metrics like bookings, revenue, guest ratings, and service usage in one comprehensive view. This dashboard provides a powerful set of features, including various charts, slicers, and cards that offer deep insights into your hotel’s performance.
In this article, we will walk you through the Hospitality Dashboard in Excel, explaining its key features, functionality, and how it can help optimize your hotel management processes.
What is the Hospitality Dashboard in Excel?
The Hospitality Dashboard in Excel is a data visualization tool that allows you to track, analyze, and display various metrics related to hotel operations. With a variety of charts, slicers, and cards, this dashboard provides real-time insights into the performance of your hotel, including bookings, revenue, guest ratings, and service usage. Built in Excel, it allows for easy customization and can be shared among multiple team members for collaboration.
The dashboard consists of several key sheets that help you view and manage data related to different aspects of hotel operations. Here’s an overview of the different sheets and their features:
Key Features of the Hospitality Dashboard in Excel
Click to buy Hospitality Dashboard in Excel
The Hospitality Dashboard in Excel is organized into five main sheets: Overview, Revenue Analysis, Guest Behavior & Ratings, Service Usage Insights, and Data.
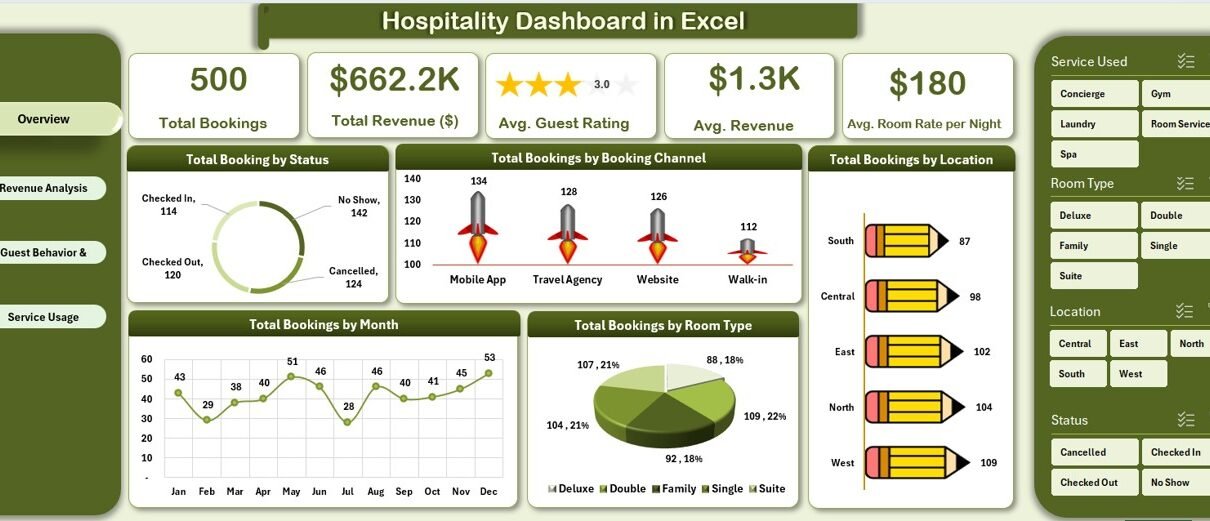
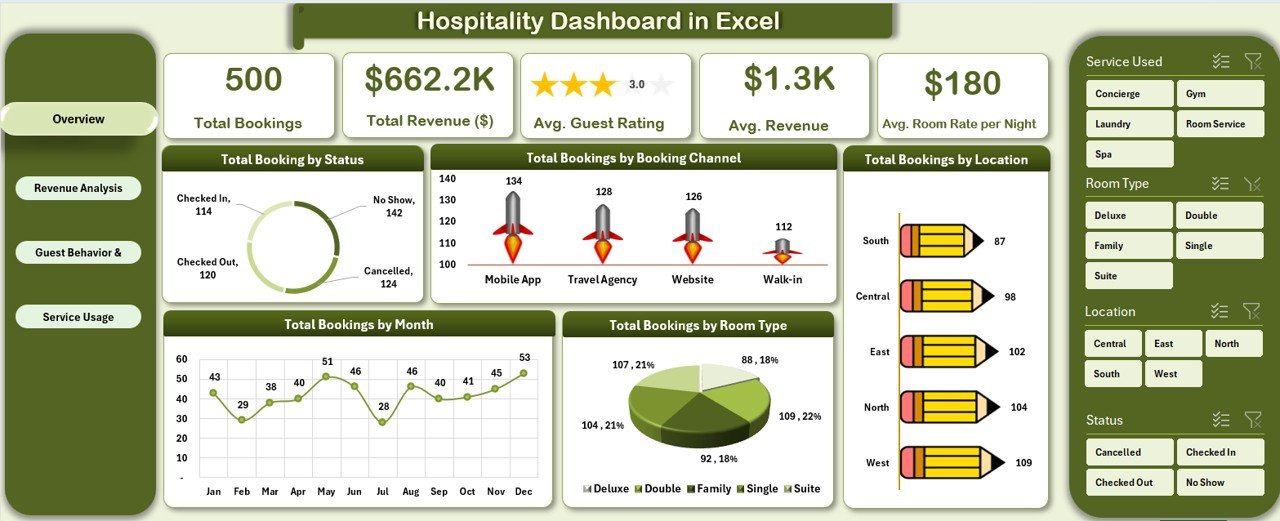
1. Overview Sheet Tab
This sheet provides a snapshot of your hotel’s performance with various cards, charts, and slicers. It’s the main page of the dashboard and gives you an overview of essential metrics:
Cards:
- Total Bookings: Displays the total number of bookings made.
- Total Revenue ($): Shows the total revenue generated from bookings.
- Avg. Guest Rating: Displays the average guest rating for the hotel.
- Avg. Revenue: The average revenue per booking.
- Avg. Room Rate per Night: Shows the average room rate charged per night.
Charts:
- Total Booking by Status: Displays a breakdown of bookings based on their status (e.g., confirmed, canceled).
- Total Bookings by Booking Channel: Shows which channels (e.g., online travel agencies, direct bookings) are generating the most bookings.
- Total Bookings by Month: A line chart or bar chart that shows bookings over time, broken down by month.
- Total Bookings by Room Type: Shows how bookings are distributed across different room types.
- Total Bookings by Location: Displays booking data by different hotel locations if applicable.
Click to buy Hospitality Dashboard in Excel
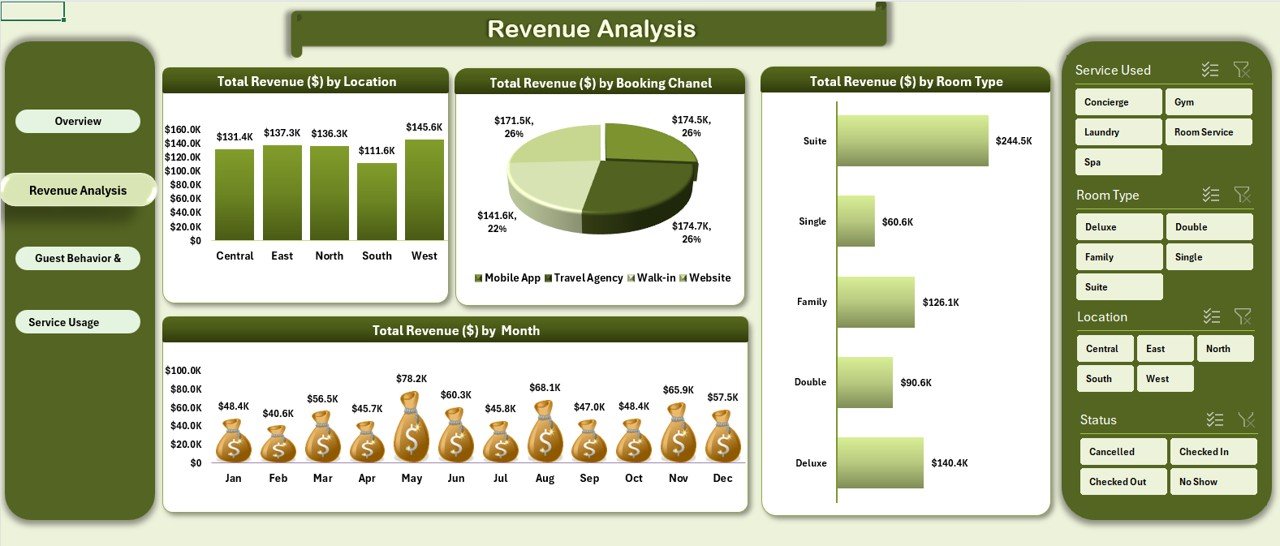
2. Revenue Analysis Sheet Tab
The Revenue Analysis sheet provides deeper insights into revenue generation across different dimensions:
Charts:
- Total Revenue ($) by Location: Displays the revenue generated by each hotel location.
- Total Revenue ($) by Booking Channel: Breaks down revenue by booking channels, such as OTAs (Online Travel Agents) or direct bookings.
- Total Revenue ($) by Room Type: Shows the revenue from each room type.
- Total Revenue ($) by Month: A chart that visualizes how revenue has been generated over each month, helping track seasonal trends.
Click to buy Hospitality Dashboard in Excel
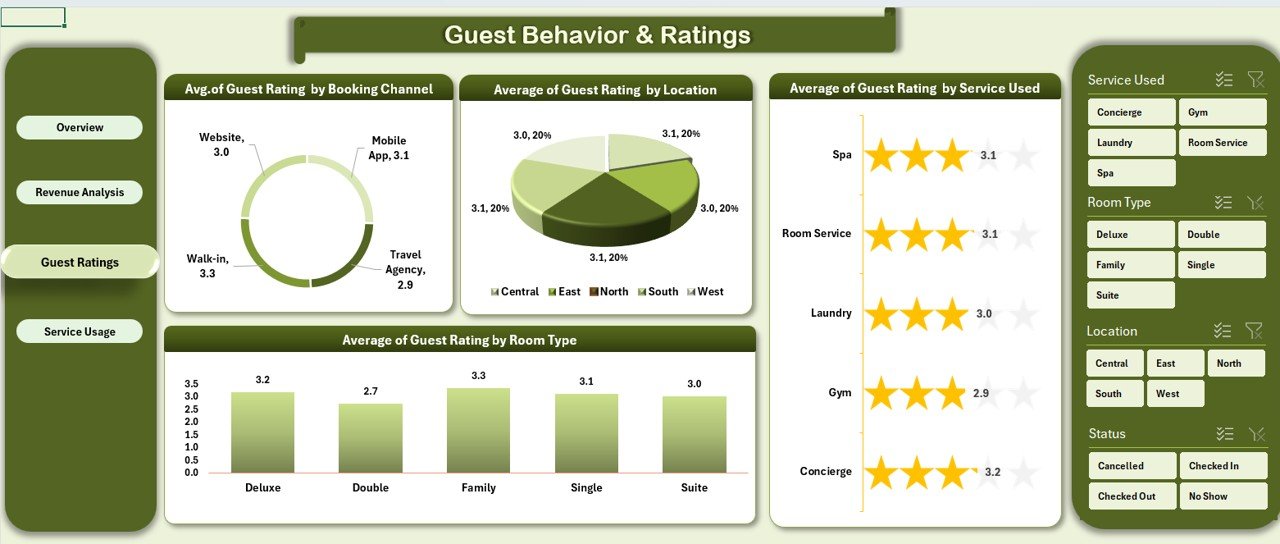
3. Guest Behavior & Ratings Sheet Tab
This sheet focuses on guest behavior and satisfaction, helping you understand how guests perceive their experience:
Charts:
- Avg. of Guest Rating by Booking Channel: Displays the average guest rating for bookings made through different channels.
- Average of Guest Rating by Location: Shows the average guest ratings for different hotel locations.
- Average of Guest Rating by Service Used: Tracks guest satisfaction based on the services they used (e.g., room service, spa).
- Average of Guest Rating by Room Type: Shows how guest ratings differ across various room types.
Click to buy Hospitality Dashboard in Excel
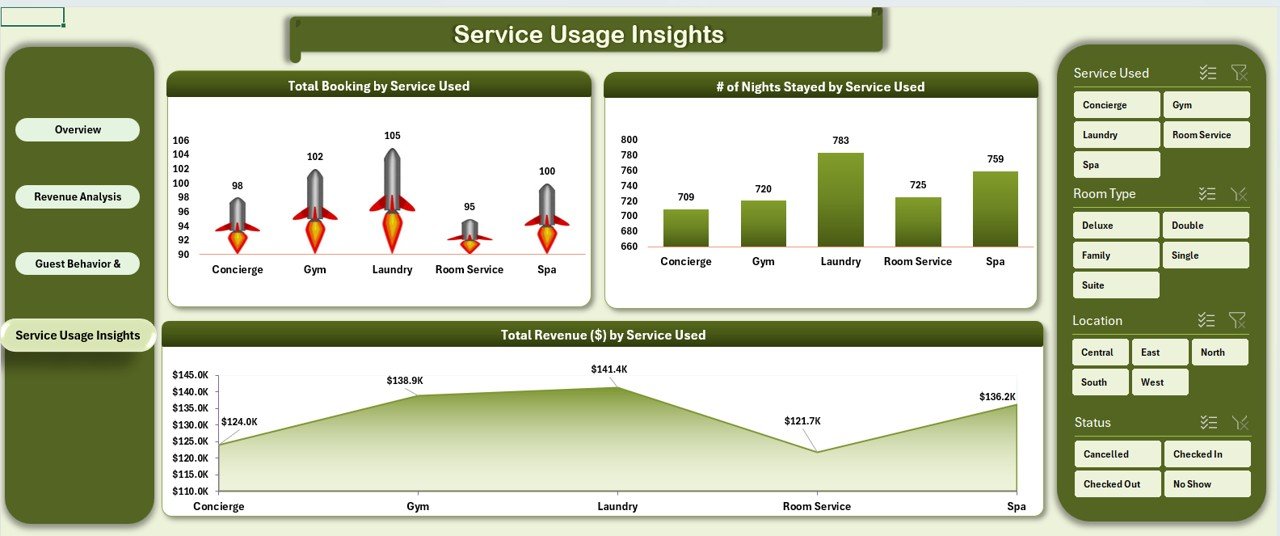
4. Service Usage Insights Sheet Tab
This sheet provides insights into how your guests are using hotel services and the revenue generated from these services:
Charts:
- Total Booking by Service Used: Shows the total number of bookings that included specific services, like room service, tours, or spa treatments.
- # of Nights Stayed by Service Used: Tracks how many nights guests stayed in relation to the services they used.
- Total Revenue ($) by Service Used: Displays the total revenue generated from each service used by guests.
5. Data Sheet Tab
The Data Sheet is where all the raw data for your dashboard is input. This is the central location for tracking the performance metrics. You’ll input the following details for each booking:
Advantages of Using the Hospitality Dashboard in Excel
-
Centralized Data Management: All hotel performance data is stored in one place, making it easy to access and update.
-
Real-Time Insights: Charts and metrics update automatically as new data is entered, providing real-time insights into hotel performance.
-
Easy Customization: The dashboard is built in Excel, allowing you to easily customize it to fit your specific needs, whether you’re tracking multiple hotel locations or different types of services.
-
Improved Decision-Making: By visualizing key metrics like revenue, guest satisfaction, and service usage, the dashboard empowers hotel managers to make informed decisions that improve operations.
-
Collaboration: Since the dashboard is in Excel, it can easily be shared and edited by multiple team members for seamless collaboration.
Best Practices for Using the Hospitality Dashboard
Click to buy Hospitality Dashboard in Excel
-
Regularly Update Data: Ensure that all booking and guest information is updated frequently for accurate, real-time insights.
-
Use Filters and Slicers: Utilize the slicers to drill down into specific data points like booking channels, room types, or service usage.
-
Monitor Trends: Review the revenue and booking trends over time to identify peak seasons and plan for resource allocation accordingly.
-
Analyze Guest Feedback: Use the guest rating data to identify areas where service can be improved, helping you enhance the guest experience.
-
Track Service Utilization: Monitor how often services are used and their contribution to total revenue to assess the profitability of various offerings.
Frequently Asked Questions (FAQs)
1. How do I update the Hospitality Dashboard with new data?
Simply add new booking data to the Data Sheet, and all charts and metrics will automatically update on the Overview Sheet and other tabs.
2. Can I track multiple hotel locations with this dashboard?
Yes, the dashboard allows you to input data for multiple locations by adding additional columns or modifying the data sheet to track location-specific performance.
3. How can I analyze trends over time?
The Revenue Analysis Sheet and Overview Sheet provide charts that help you track performance by month, channel, and other key metrics, making trend analysis easy.
4. Can I customize the charts in the dashboard?
Yes, since it’s built in Excel, you can easily customize the charts and metrics to suit your specific needs.
5. Is this dashboard suitable for both small and large hotels?
Yes, this dashboard is scalable and can be used for small boutique hotels or large hotel chains with multiple locations.
Conclusion
Click to buy Hospitality Dashboard in Excel
The Hospitality Dashboard in Excel is a powerful tool for hotel management, providing real-time insights into bookings, revenue, guest ratings, and service usage. By utilizing this dashboard, hotel managers can streamline operations, improve decision-making, and enhance guest experiences. Whether you’re managing a single hotel or a chain, this template provides all the data visualization tools you need to optimize your hotel’s performance.
Visit our YouTube channel to learn step-by-step video tutorials
Click to buy Hospitality Dashboard in Excel