In the hospitality industry, data is the key to creating unforgettable guest experiences and maximizing profitability. Every booking, customer review, and operational activity generates valuable information that can help hotels and resorts make better decisions. However, without a centralized system to visualize and interpret this data, it’s easy to miss critical insights.
That’s where the Hospitality & Resorts Dashboard in Power BI comes in — a ready-to-use, interactive, and visually stunning business intelligence tool designed for hotel managers, resort owners, and hospitality professionals.
This dashboard turns complex data into clear, actionable insights, helping businesses understand guest behavior, optimize operations, and boost revenue with ease. Built entirely in Microsoft Power BI, this solution gives you a bird’s-eye view of your entire hospitality performance — from bookings and profits to customer ratings and room utilization.
Click to Purchases Hospitality & Resorts Dashboard in Power BI
What Is a Hospitality & Resorts Dashboard in Power BI?
A Hospitality & Resorts Dashboard in Power BI is a visual analytics tool that consolidates data from multiple hotel operations into one unified platform. It enables decision-makers to track performance metrics such as occupancy rates, customer satisfaction, profit margins, revenue per room, booking channels, and more.
With dynamic charts, slicers, and KPI cards, users can explore every aspect of their business — from department-level analysis to room type performance and monthly trends. This allows hospitality teams to make data-driven decisions quickly and confidently.
Whether you manage a single resort or a chain of hotels, this Power BI dashboard delivers a holistic view of your operations, empowering you to enhance service quality, optimize expenses, and maximize profitability.
🧭 Key Features of the Hospitality & Resorts Dashboard
The Hospitality & Resorts Dashboard in Power BI includes five powerful analytical pages, each designed to help managers uncover insights from a different business perspective.
1️⃣ Overview Page

The Overview Page acts as the command center of the dashboard. It provides a comprehensive snapshot of your entire business performance at a glance.
-
Interactive Slicers – Filter data by region, resort, or booking type to focus on specific segments.
-
KPI Cards – Display key metrics like total bookings, total revenue, profit, cost, and customer satisfaction rating.
Dynamic Charts:
- 📈 Customer Rating (1–10) by Booking Type – Analyze how different booking channels influence customer satisfaction.
- 💼 Checked-In % – Track check-in performance to ensure smooth operations.
- 💰 Profit (USD) by Region – Identify the most profitable geographical areas.
- 📊 Revenue (USD) and Cost (USD) by Booking Channel – Understand which channels generate the highest return.
Together, these visuals make the Overview Page your go-to summary of operational and financial health.
2️⃣ Department Analysis

The Department Analysis Page helps you evaluate how different departments contribute to profitability and guest satisfaction.
-
Profit (USD) by Customer Rating (1–10) and Department – Compare financial success with guest experience to pinpoint high-performing departments.
-
Profit (USD) by Region and Department – Identify regional differences in departmental efficiency.
-
Cost (USD) by Booking Department – Control operational costs and identify areas of overspending.
This analysis enables hospitality leaders to recognize top-performing teams, address bottlenecks, and balance departmental workloads for better efficiency.
Click to Purchases Hospitality & Resorts Dashboard in Power BI
3️⃣ Resort Name Analysis

The Resort Name Analysis Page offers a deep dive into performance across different resort locations.
-
Customer Rating (1–10) by Resort Name – Measure how each resort scores in guest satisfaction.
-
Profit (USD) by Region and Resort Name – Spot which resorts yield the highest profit in each region.
-
Revenue (USD) and Cost (USD) by Resort Name – Compare income and expenses to ensure financial sustainability.
This page helps multi-location hospitality chains monitor performance consistency and identify best practices across resorts.
4️⃣ Room Type Analysis
Room categories are among the biggest revenue drivers in the hospitality business. The Room Type Analysis Page helps you analyze which room types perform best.
-
Customer Rating (1–10) by Room Type – Identify which rooms provide the most satisfying experience.
-
Profit (USD) by Room Type and Resort Name – Understand which room types are most profitable in specific resorts.
-
Revenue (USD) and Cost (USD) by Room Type – Track income and operational expenses per room category.
This analysis helps in pricing optimization, package creation, and understanding guest preferences for targeted marketing.
5️⃣ Monthly Trends
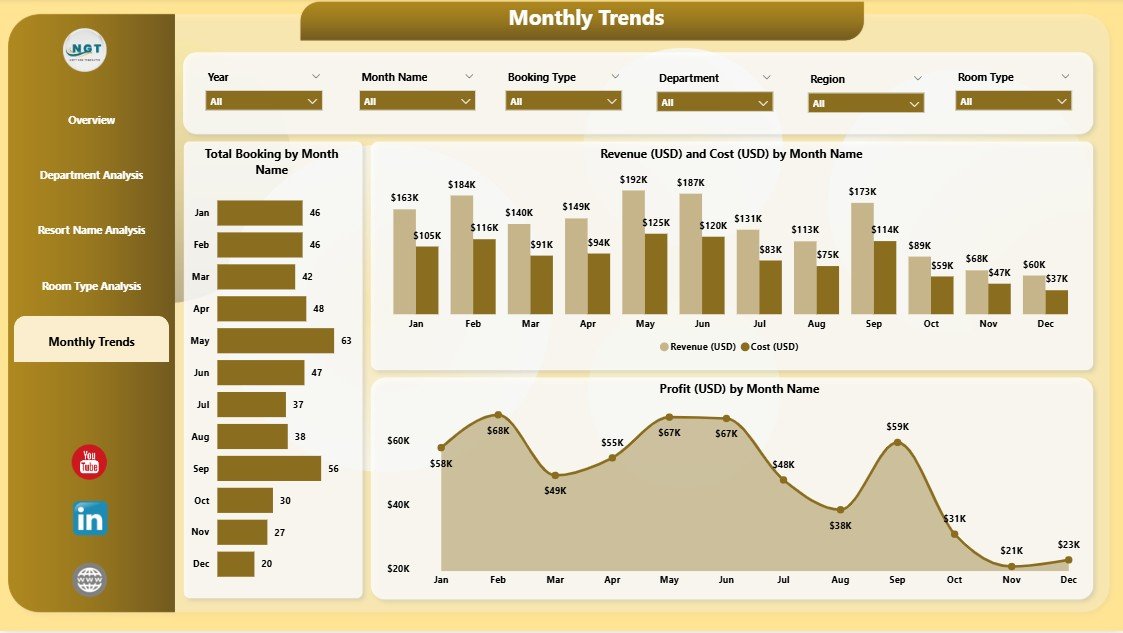
The Monthly Trends Page highlights how performance evolves over time, enabling data-driven forecasting.
-
Total Booking by Month – Observe booking patterns and identify peak seasons.
-
Profit (USD) by Month and Resort Name – Monitor financial performance trends across months.
-
Revenue (USD) and Cost (USD) by Month – Compare monthly income and expenses to evaluate overall growth.
This page supports annual planning and budgeting, ensuring that marketing campaigns and resource allocations align with seasonal demand.
💡 Importance of a Power BI Dashboard for Hospitality Businesses
Hospitality operations involve countless variables — customer demographics, booking platforms, pricing models, and service quality metrics. Manually tracking all of this data can be overwhelming. A Power BI dashboard simplifies it by automating data collection, visualization, and reporting.
With real-time data updates, drill-through analysis, and customizable visuals, hospitality managers can:
-
Detect inefficiencies instantly.
-
Identify high-performing areas.
-
Predict future demand patterns.
-
Improve guest satisfaction.
-
Enhance financial decision-making.
In short, Power BI transforms raw data into a digital control panel that drives growth and service excellence.
🏨 Advantages of the Hospitality & Resorts Dashboard in Power BI
1. Real-Time Decision Making
The dashboard provides live insights into key hospitality metrics, allowing managers to take timely and informed decisions.
2. Enhanced Guest Experience
By analyzing guest feedback and satisfaction ratings, hospitality teams can tailor services to meet expectations and improve ratings.
3. Profit and Cost Transparency
It clearly presents profit margins, costs, and revenue streams, helping managers pinpoint where money is being made or lost.
4. Simplified Departmental Analysis
Each department’s performance is measurable, allowing teams to align with organizational goals.
5. Improved Forecasting
Monthly trend visuals and seasonal insights make forecasting and planning far more accurate.
6. Time Efficiency
Instead of sifting through multiple reports, all data is available in one unified dashboard.
7. Scalability
Whether managing one resort or multiple, the dashboard scales effortlessly as business grows.
🧩 How the Dashboard Supports Business Growth
Click to Purchases Hospitality & Resorts Dashboard in Power BI
A well-designed Hospitality & Resorts Dashboard helps transform data into strategy. For instance:
-
Marketing teams can identify which channels bring in the most profitable bookings.
-
Finance departments can evaluate cost versus revenue by location.
-
Operations managers can detect inefficiencies in check-in rates or occupancy levels.
-
Customer service teams can monitor guest satisfaction trends to improve feedback systems.
By centralizing data and automating reporting, the dashboard ensures every department works from the same source of truth — boosting collaboration and growth.
🧠 Best Practices for Using the Hospitality & Resorts Dashboard
To make the most of your Power BI dashboard, follow these best practices:
1. Define Clear Objectives
Start by identifying what you want to measure — profit margins, occupancy trends, or guest satisfaction. Clear goals drive meaningful analysis.
2. Keep Data Updated
Ensure your data sources (Excel, PMS, or ERP systems) are updated frequently to maintain accurate insights.
3. Use Slicers Wisely
Slicers make exploration easy. Use them to drill down into specific locations, departments, or booking channels.
4. Customize for Your Business
Power BI allows customization. Tailor visuals, KPIs, and themes to match your brand identity and reporting needs.
5. Focus on Visualization Clarity
Use consistent colors and clear labels. Avoid overcrowding pages — clarity boosts understanding.
6. Regularly Review Trends
Analyze trends monthly or quarterly to anticipate seasonal shifts and allocate budgets accordingly.
7. Train Your Team
Ensure all users understand how to navigate the dashboard and interpret the visuals effectively.
Use Cases of Hospitality & Resorts Dashboard
The versatility of this Power BI dashboard makes it useful across various roles in the hospitality industry:
-
Hotel Managers: Evaluate performance across properties.
-
Finance Teams: Monitor profitability and cost efficiency.
-
Marketing Executives: Identify high-converting booking channels.
-
Operations Managers: Track occupancy, cancellations, and check-in performance.
-
Customer Service Teams: Assess satisfaction scores and feedback trends.
How This Dashboard Improves Decision-Making
By combining real-time analytics with interactive visuals, this dashboard helps businesses move from reactive management to proactive strategy.
For instance:
-
When the Checked-In % drops, managers can instantly explore whether the issue is due to cancellations, room unavailability, or customer dissatisfaction.
-
When Profit (USD) by Region varies, they can identify which resorts are overperforming and replicate their strategies elsewhere.
This data-driven approach fosters continuous improvement and helps maintain a competitive edge in the hospitality market.
🎯 Conclusion
The Hospitality & Resorts Dashboard in Power BI isn’t just a reporting tool — it’s a strategic asset for the modern hospitality industry. It simplifies complex datasets into clear insights, empowers quick decision-making, and helps teams align around common goals.
With this Power BI solution, hospitality businesses can move beyond static reports and embrace real-time performance management, ensuring every guest interaction and every dollar spent contributes to lasting success.
❓ Frequently Asked Questions (FAQs)
1. What is the Hospitality & Resorts Dashboard in Power BI?
It’s an interactive analytical tool built in Power BI that visualizes hotel and resort performance metrics like revenue, profit, occupancy, and guest satisfaction.
2. Who can use this dashboard?
It’s ideal for hotel managers, resort owners, financial analysts, operations heads, and marketing professionals in the hospitality sector.
3. What type of data does it analyze?
It analyzes booking data, revenue, costs, customer ratings, occupancy rates, and monthly trends across different properties and departments.
4. Can this dashboard be customized?
Yes, you can customize the visuals, themes, KPIs, and slicers to match your organization’s branding and specific business requirements.
5. Does it support multiple resort locations?
Absolutely. It’s designed to handle data from multiple resorts or hotel branches, enabling comparative analysis by region or property.
6. What are the main benefits of using it?
You gain real-time insights, transparent reporting, better forecasting, improved decision-making, and enhanced guest satisfaction.
7. Is Power BI required to use this dashboard?
Yes, this dashboard runs in Microsoft Power BI Desktop or Power BI Service.
8. Can non-technical users operate this dashboard?
Yes, it’s built with simplicity in mind. With intuitive slicers and clean visuals, even non-technical users can explore and understand the data easily.
Visit our YouTube channel to learn step-by-step video tutorials