Managing a housing society involves much more than collecting maintenance fees or resolving complaints. Committees must track finances, services, facilities, compliance, and resident satisfaction regularly. However, when data remains scattered across registers, WhatsApp messages, or multiple Excel files, decision-making becomes slow and unclear.
That is exactly where a Housing Societies KPI Dashboard in Excel makes a real difference.
In this detailed guide, you will learn what a Housing Societies KPI Dashboard in Excel is, why it matters, how it works, its worksheet structure, key features, advantages, best practices, and frequently asked questions. By the end of this article, you will clearly understand how this ready-to-use Excel dashboard helps housing societies improve transparency, control costs, and manage operations efficiently.
Click to Purchases Housing Societies KPI Dashboard in Excel
What Is a Housing Societies KPI Dashboard in Excel?
A Housing Societies KPI Dashboard in Excel is a structured and interactive reporting tool designed to track and visualize key performance indicators related to housing society operations.
Instead of reviewing manual reports or separate spreadsheets, society committees can monitor all important KPIs in one centralized Excel dashboard. As a result, they gain instant clarity on performance, trends, and problem areas.
Moreover, because Excel powers this dashboard, societies do not need expensive software or technical expertise to use it effectively.
Why Do Housing Societies Need a KPI Dashboard?
Housing societies manage multiple operational and financial activities every month. Without proper KPI tracking, committees often rely on assumptions rather than facts. Therefore, a KPI dashboard becomes essential.
A Housing Societies KPI Dashboard in Excel helps because:
-
It brings all society performance data into one place
-
It improves transparency for committee members
-
It supports data-driven decision-making
-
It highlights operational gaps early
-
It improves accountability across teams
As a result, societies move from reactive management to proactive planning.
How Does a Housing Societies KPI Dashboard in Excel Work?
A Housing Societies KPI Dashboard in Excel works by combining structured data input, KPI definitions, calculations, and visual indicators into a single workbook.
The dashboard follows a simple flow:
-
Define KPIs and targets
-
Enter actual performance numbers
-
Compare actuals with targets and previous year data
-
View MTD and YTD performance
-
Analyze trends using charts and indicators
Because Excel supports formulas, dropdowns, charts, and conditional formatting, the dashboard delivers insights without complexity.
Click to Purchases Housing Societies KPI Dashboard in Excel
What Are the Key Worksheets in the Housing Societies KPI Dashboard in Excel?
This ready-to-use Housing Societies KPI Dashboard includes seven well-designed worksheets, each created to serve a specific purpose.
What Is the Home Sheet and Why Is It Useful?
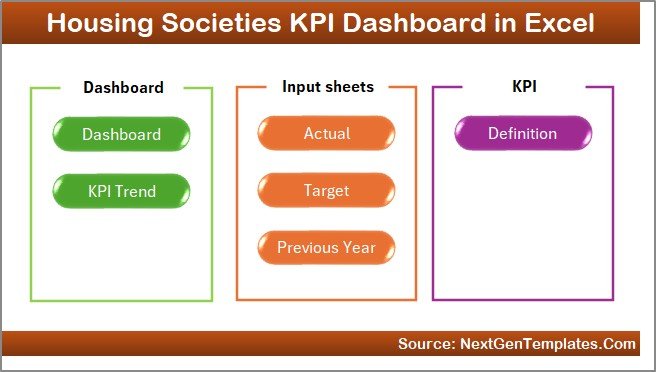
The Home Sheet acts as the index page of the dashboard.
Key Features of the Home Sheet
-
Provides a clean landing page
-
Includes six navigation buttons
-
Allows users to jump directly to required sheets
-
Improves usability and navigation
Because of this design, even non-technical users can navigate the dashboard easily.
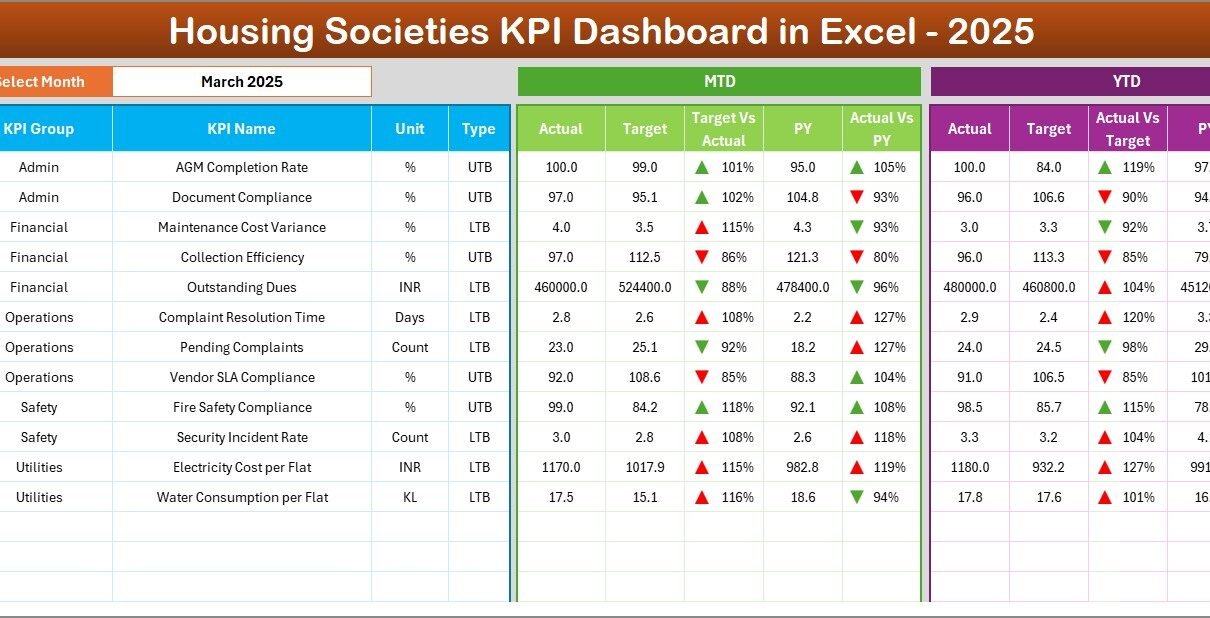
What Happens in the Dashboard Sheet?
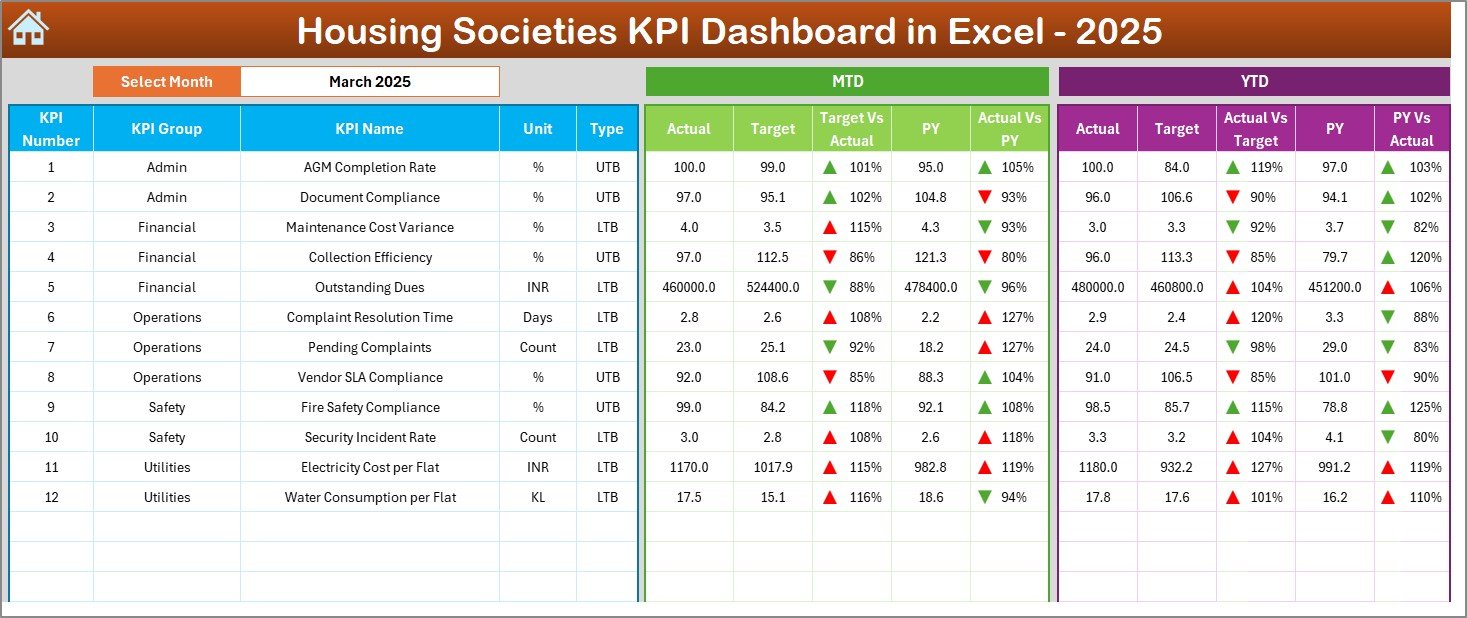
The Dashboard Sheet is the main and most important sheet of the Housing Societies KPI Dashboard in Excel.
Key Features of the Dashboard Sheet
-
Month Selection Dropdown (Cell D3)
Users can select the required month, and the entire dashboard updates automatically. -
MTD Performance Tracking
Displays:-
MTD Actual
-
MTD Target
-
MTD Previous Year
-
-
YTD Performance Tracking
Displays:-
YTD Actual
-
YTD Target
-
YTD Previous Year
-
-
Variance Analysis
Shows:-
Target vs Actual
-
Previous Year vs Actual
-
-
Conditional Formatting with Up/Down Arrows
Visual arrows quickly indicate good or poor performance.
Because of this structure, committee members can understand society performance in seconds.
Click to Purchases Housing Societies KPI Dashboard in Excel
How Does the KPI Trend Sheet Help in Analysis?
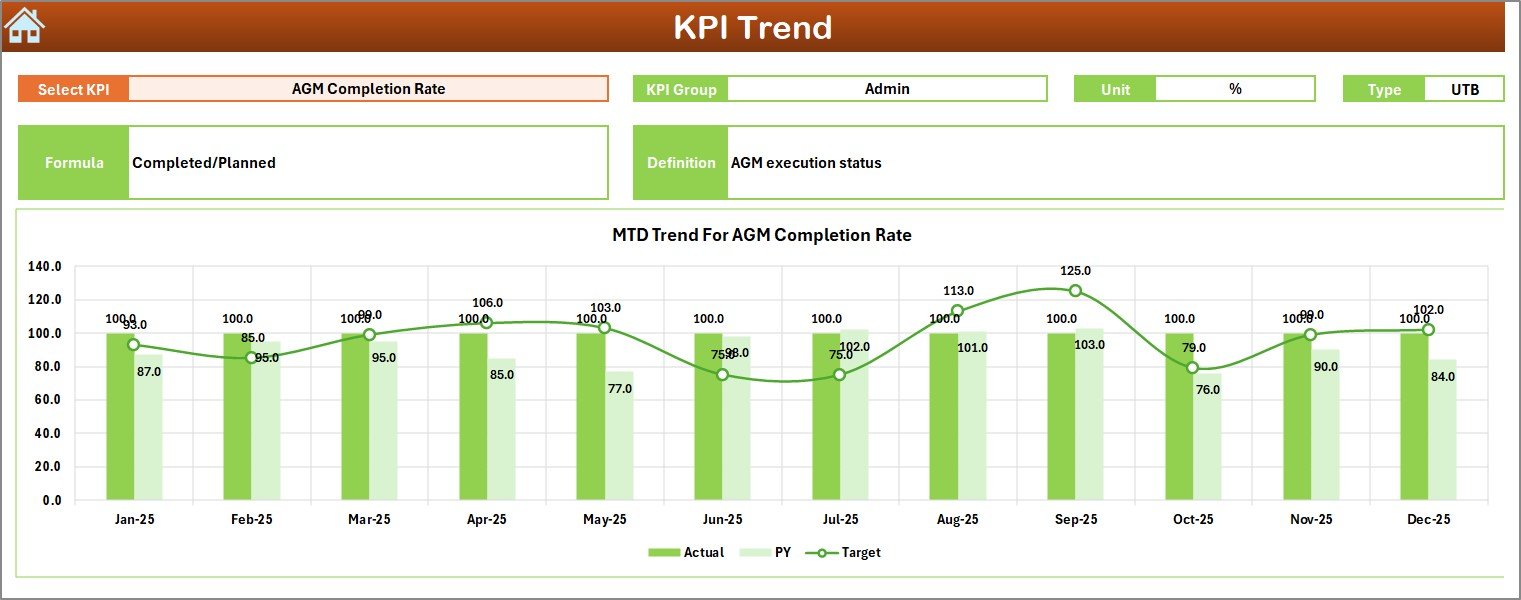
The KPI Trend Sheet supports detailed KPI-level analysis.
Key Capabilities of the KPI Trend Sheet
-
KPI Selection Dropdown (Cell C3)
Select any KPI to view detailed information instantly. -
KPI Details Displayed
-
KPI Group
-
Unit of KPI
-
KPI Type (Lower the Better or Upper the Better)
-
KPI Formula
-
KPI Definition
-
-
MTD and YTD Trend Charts
Displays trend charts for:-
Actual
-
Target
-
Previous Year
-
As a result, users can understand performance patterns instead of reviewing isolated numbers.
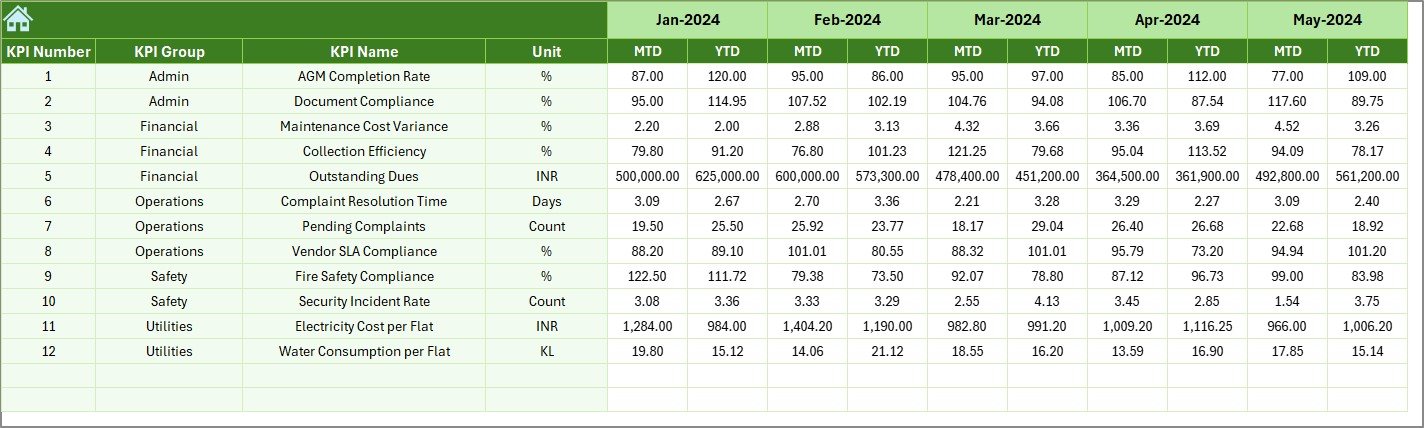
Why Is the Actual Numbers Input Sheet Important?
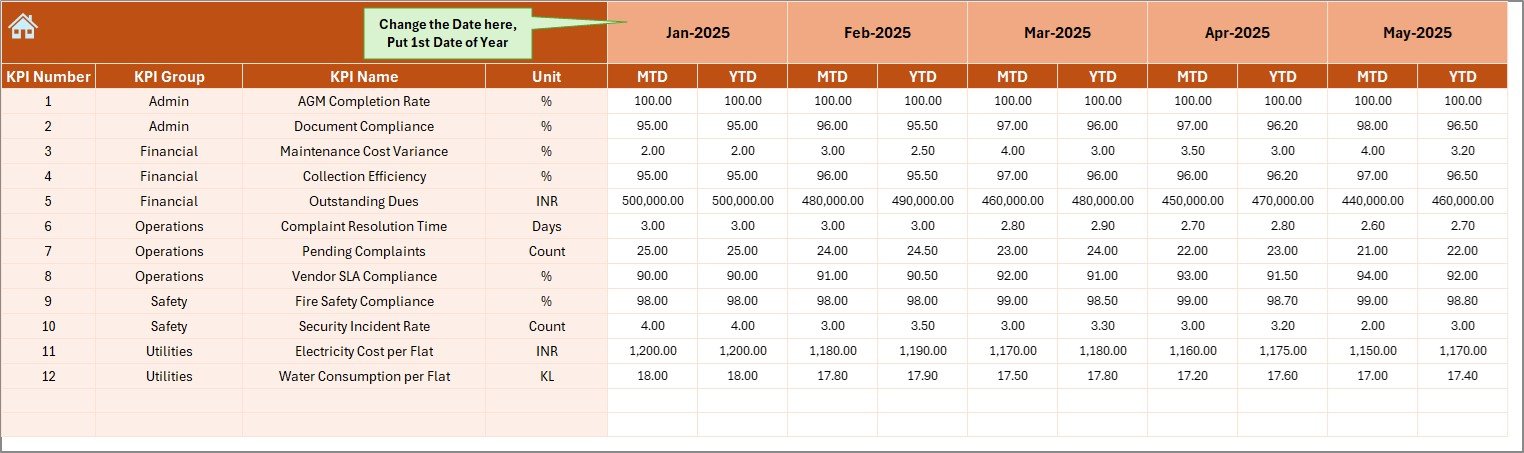
The Actual Numbers Input Sheet forms the foundation of the dashboard.
Key Features of the Actual Numbers Input Sheet
-
Allows entry of MTD and YTD actual values
-
Supports monthly tracking
-
Month selection available in Cell E1
-
Requires entering only the first month of the year once
Because of this setup, data entry becomes simple and structured.
Click to Purchases Housing Societies KPI Dashboard in Excel
What Is the Role of the Target Sheet?
The Target Sheet helps define performance expectations.
Key Features of the Target Sheet
-
Enter monthly MTD targets
-
Enter YTD targets for each KPI
-
Supports consistent performance measurement
By defining clear targets, societies can evaluate whether operations meet expectations.
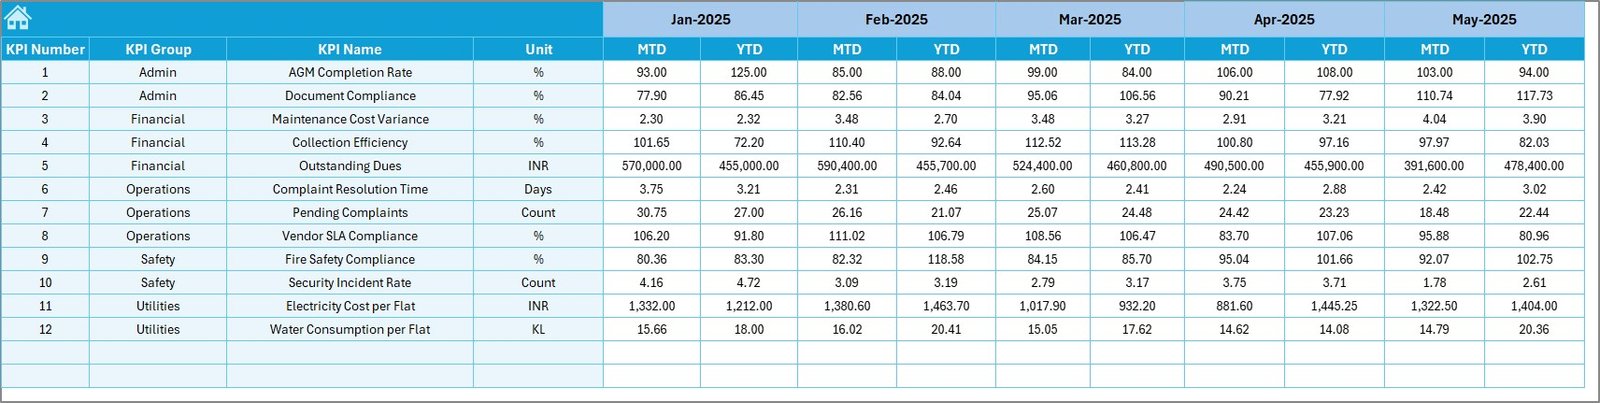
Why Track Previous Year Numbers?
The Previous Year Number Sheet enables year-over-year comparison.
Key Benefits
-
Enter previous year data using the same structure
-
Compare current performance with historical results
-
Identify improvement or decline trends
Because of this comparison, committees can evaluate long-term performance.
What Is the Purpose of the KPI Definition Sheet?
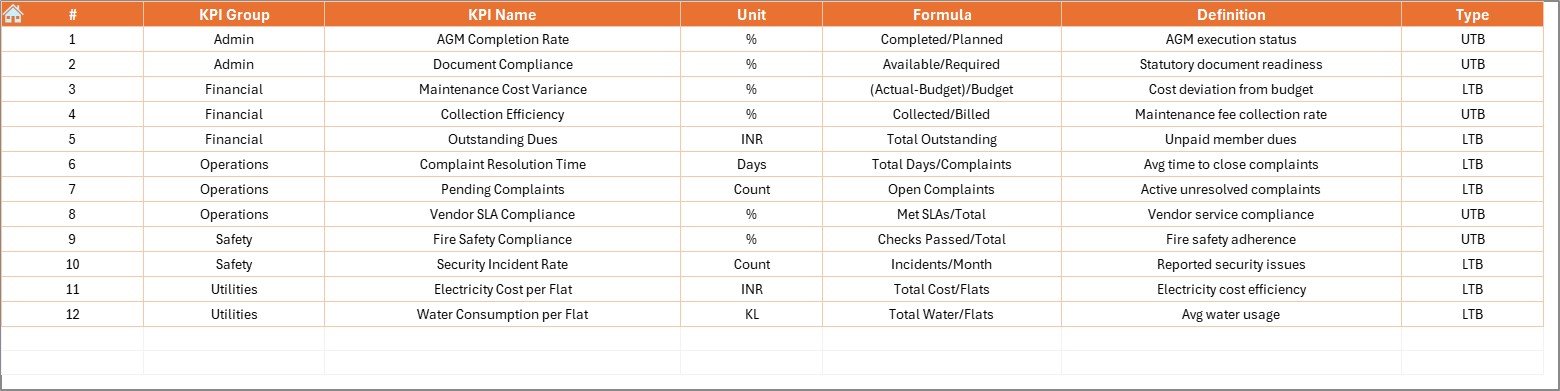
The KPI Definition Sheet ensures clarity and standardization.
Key Elements of the KPI Definition Sheet
-
KPI Name
-
KPI Group
-
Unit of Measurement
-
KPI Formula
-
KPI Definition
This sheet avoids confusion and ensures everyone interprets KPIs correctly.
Click to Purchases Housing Societies KPI Dashboard in Excel
Which KPIs Can Be Tracked Using This Dashboard?
A Housing Societies KPI Dashboard in Excel can track KPIs such as:
-
Maintenance collection rate
-
Pending dues percentage
-
Expense variance
-
Electricity and water consumption
-
Complaint resolution time
-
Vendor performance
-
Lift uptime
-
Security incident count
-
Housekeeping quality score
-
Compliance completion rate
These KPIs cover financial, operational, and service performance.
Click to Purchases Housing Societies KPI Dashboard in Excel
Advantages of Housing Societies KPI Dashboard in Excel
Using a Housing Societies KPI Dashboard in Excel offers several benefits.
Key Advantages
-
Centralized Performance Monitoring
Track all society KPIs in one dashboard. -
Improved Transparency
Committees can share clear reports with residents. -
Cost-Effective Solution
Excel eliminates the need for expensive software. -
Easy to Use
No advanced technical skills required. -
Better Decision-Making
Visual insights support faster actions. -
Historical Performance Tracking
MTD, YTD, and previous year comparisons improve planning.
Because of these advantages, Excel dashboards remain popular among housing societies.
How Does This Dashboard Improve Society Governance?
Strong governance depends on data transparency and accountability. This dashboard supports governance by:
-
Standardizing KPI definitions
-
Maintaining performance records
-
Supporting audit-ready reporting
-
Improving committee oversight
As a result, societies operate more professionally and transparently.
Best Practices for the Housing Societies KPI Dashboard in Excel
To get maximum value from the dashboard, follow these best practices.
Best Practices
-
Define KPIs clearly before implementation
-
Align KPIs with society goals
-
Update data regularly
-
Review MTD and YTD performance in meetings
-
Use realistic and achievable targets
-
Train committee members on dashboard usage
-
Review KPIs annually and refine when needed
When societies follow these practices, the dashboard becomes a strategic tool.
Click to Purchases Housing Societies KPI Dashboard in Excel
Who Should Use a Housing Societies KPI Dashboard in Excel?
This dashboard benefits:
-
Housing society committees
-
Apartment owners associations
-
Society managers
-
Facility management teams
-
Auditors and consultants
Because of its flexibility, the dashboard suits small and large societies alike.
Click to Purchases Housing Societies KPI Dashboard in Excel
Conclusion: Why Choose a Housing Societies KPI Dashboard in Excel?
A Housing Societies KPI Dashboard in Excel provides a simple yet powerful way to monitor society performance. Instead of relying on assumptions or manual reports, committees gain clear visibility into operations, finances, and services.
Moreover, with structured worksheets, trend analysis, and visual indicators, this ready-to-use dashboard improves transparency, accountability, and decision-making.
For housing societies seeking control without complexity, Excel remains a practical and reliable solution.
Frequently Asked Questions (FAQs)
What is a Housing Societies KPI Dashboard in Excel?
It is an Excel-based tool that tracks and visualizes key performance indicators for housing society operations.
Can this dashboard be customized?
Yes, users can modify KPIs, targets, formulas, and visuals easily.
Is this dashboard suitable for small housing societies?
Yes, it works well for both small and large societies.
How often should data be updated?
Societies should update data monthly or as per KPI requirements.
Does this dashboard support MTD and YTD tracking?
Yes, it includes both MTD and YTD performance analysis.
Do users need advanced Excel skills?
No, basic Excel knowledge is enough to use this dashboard.
Click to Purchases Housing Societies KPI Dashboard in Excel
Visit our YouTube channel to learn step-by-step video tutorials