In today’s competitive business environment, organizations realize that employee satisfaction is not just a buzzword—it’s a powerful driver of success. Happy employees are more engaged, productive, and loyal. However, measuring satisfaction can feel challenging without the right tools.
That’s why we have created a Human Resources Employee Satisfaction KPI Dashboard in Excel – a ready-to-use, professional solution to track and improve your employee satisfaction initiatives.
In this article, we will explore every aspect of the dashboard, its features, advantages, best practices, and answer the most common questions to help you get the best out of this tool.
Click to Purchases Human Resources Employee Satisfaction KPI Dashboard in Excel
What is a Human Resources Employee Satisfaction KPI Dashboard?
The Human Resources Employee Satisfaction KPI Dashboard is a comprehensive Excel-based tool designed to monitor, measure, and manage employee satisfaction KPIs (Key Performance Indicators) throughout the year.
It offers a dynamic, interactive way to view real-time performance data for various employee satisfaction metrics, making decision-making faster and smarter.
Key Features of the Human Resources Employee Satisfaction KPI Dashboard
This powerful dashboard template comes packed with useful features to help HR managers, department heads, and leadership teams stay on top of employee satisfaction KPIs.
Here’s a detailed breakdown:
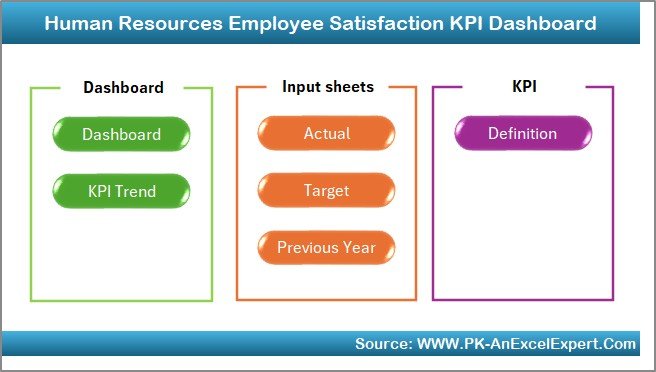
1. Home Sheet
-
Acts as a navigation center.
-
Features 6 smart buttons that let you instantly jump to different sections.
-
Makes the dashboard super easy to explore, even for beginners.
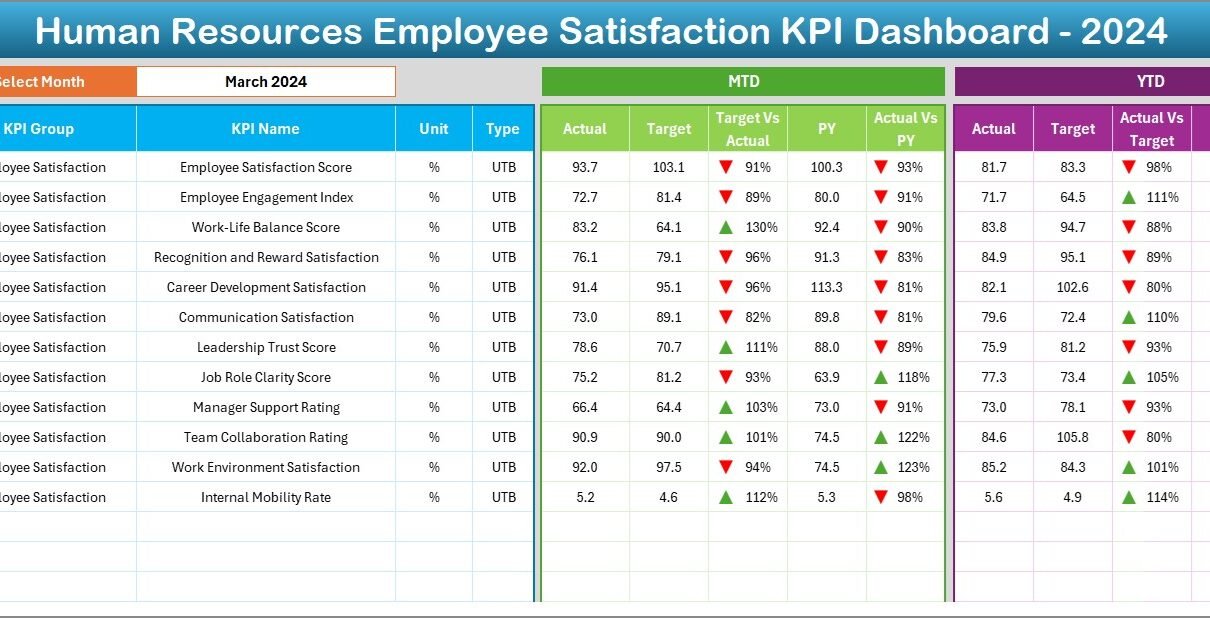
2. Dashboard Sheet Tab
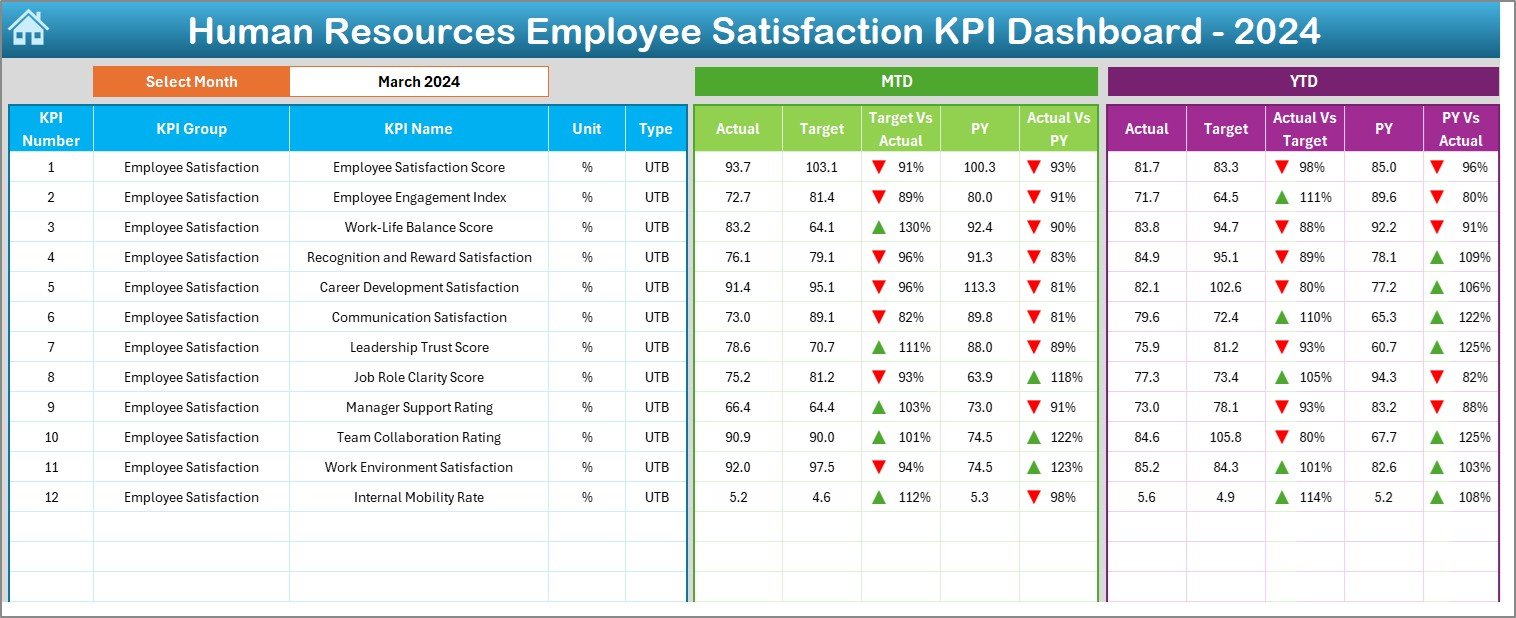
-
This is the main sheet and the heart of the dashboard.
-
Select the month from a dropdown list (located at D3) to update all dashboard numbers dynamically.
-
Displays:
- MTD (Month-to-Date) Actual, Target, and Previous Year data.
- YTD (Year-to-Date) Actual, Target, and Previous Year data.
-
Includes conditional formatting using up and down arrows to quickly visualize performance (target vs actual, and previous year vs actual).
3. KPI Trend Sheet Tab
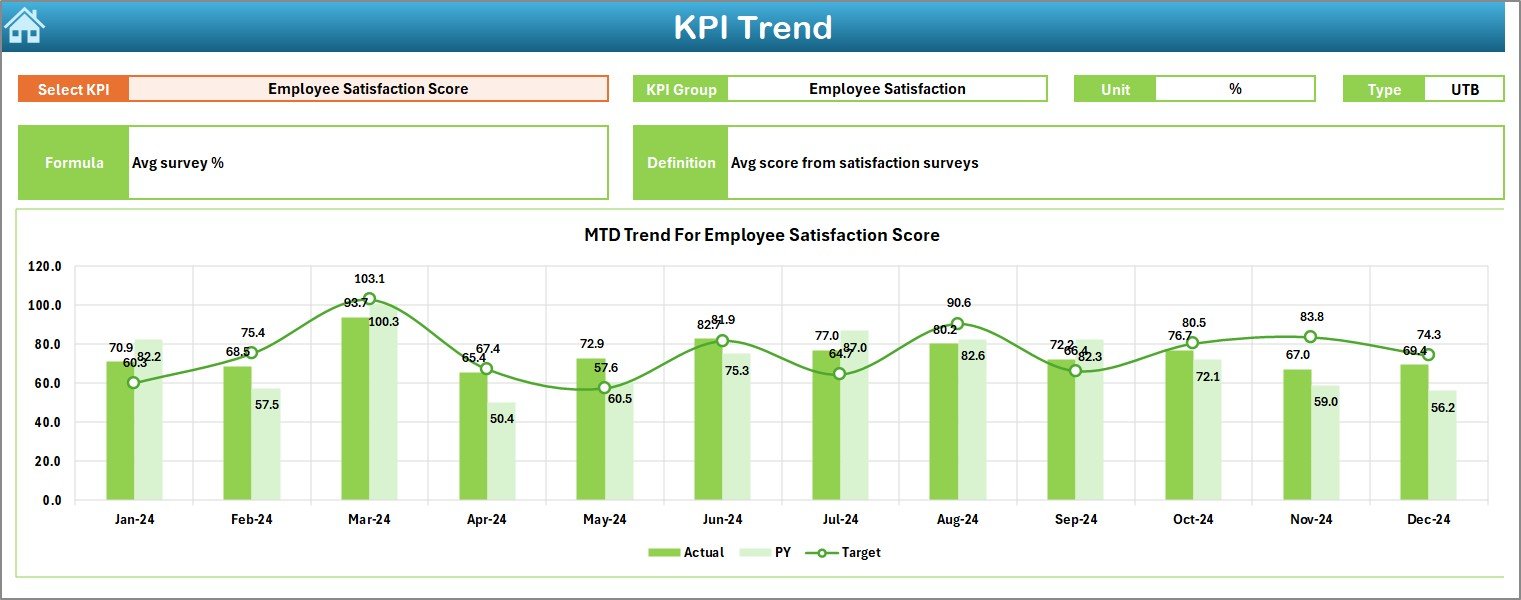
-
View individual KPI trends over time.
-
Select the KPI name from the dropdown menu at C3.
-
See important KPI details such as:
- KPI Group
- Unit of Measure
- Type (Lower-the-Better or Upper-the-Better)
- Formula
- Definition
-
Includes attractive MTD and YTD trend charts comparing Actual, Target, and Previous Year numbers.
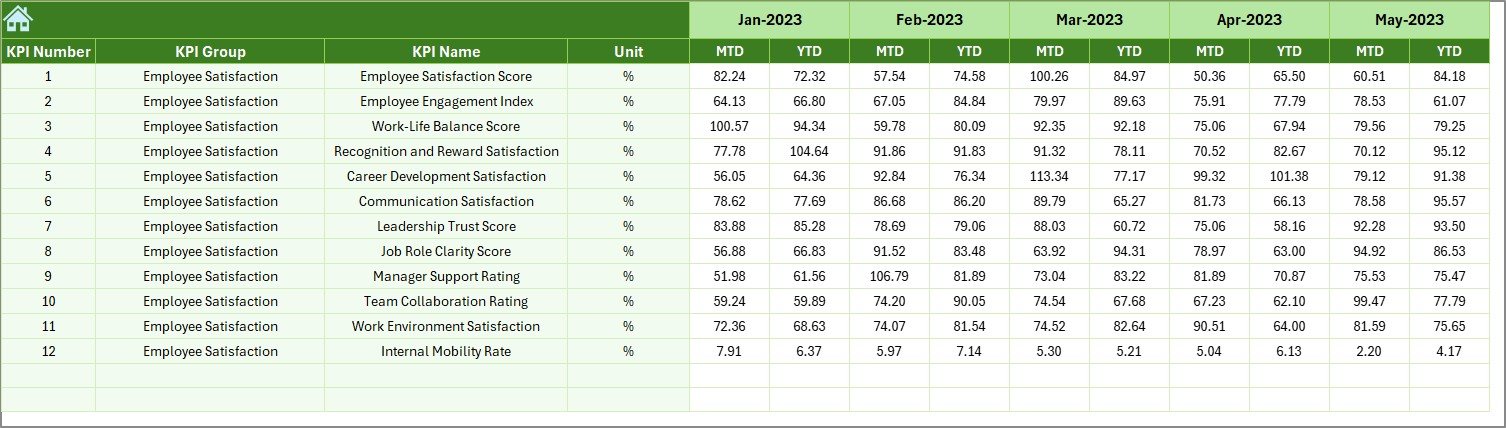
4. Actual Numbers Input Sheet
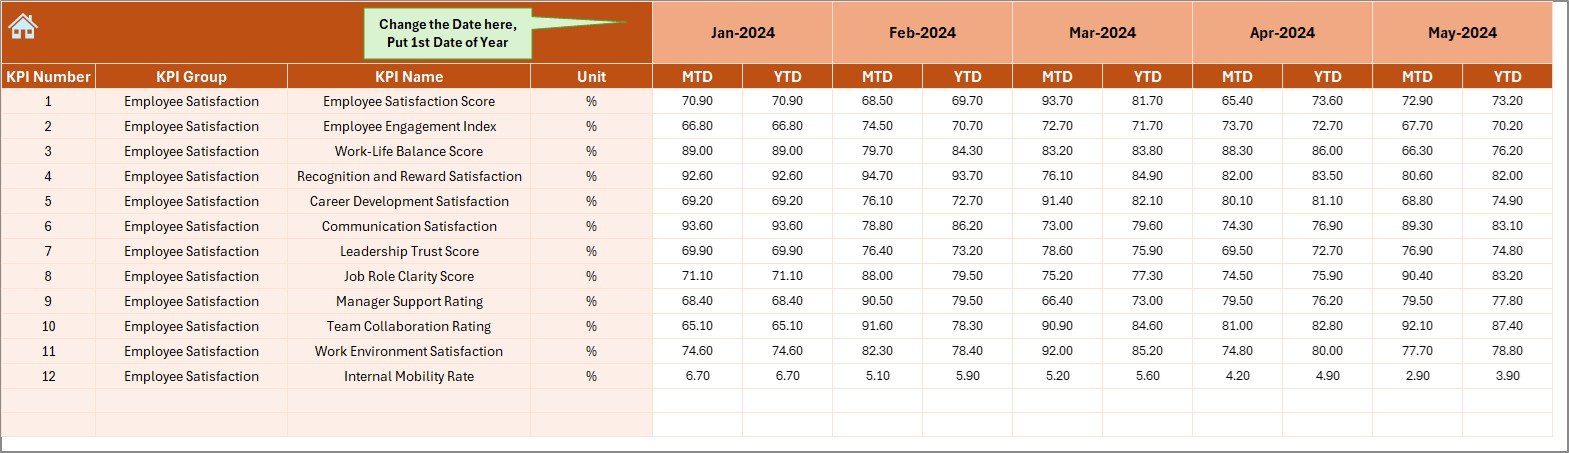
-
This is where you input actual employee satisfaction data.
-
Use cell E1 to change the first month of the year dynamically.
-
Enter both MTD and YTD actual numbers for each KPI month by month.
5. Target Sheet Tab
-
Define your targets for MTD and YTD KPIs.
-
Helps you set clear, measurable goals to enhance employee satisfaction.
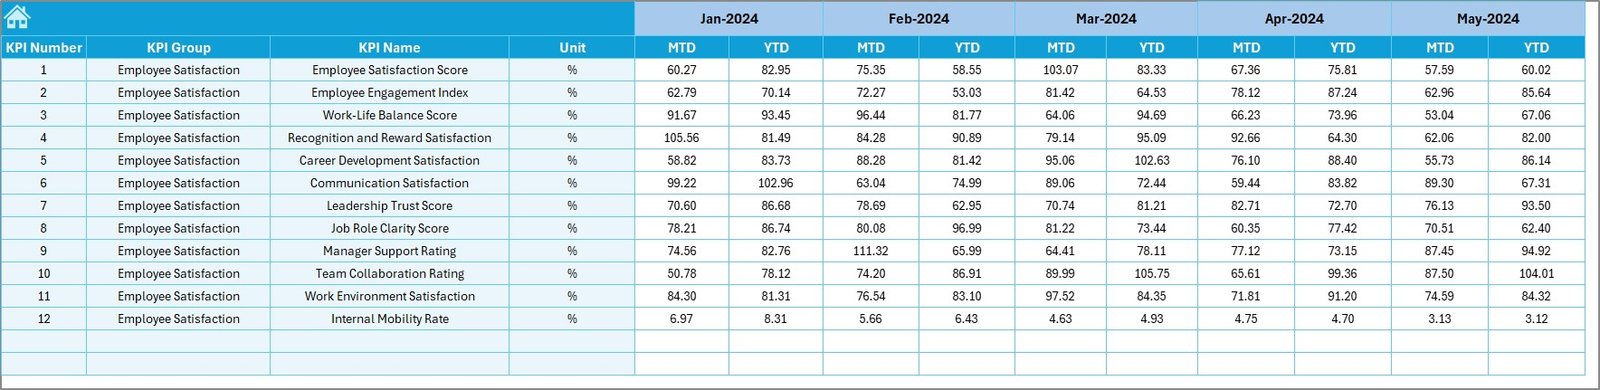
6. Previous Year Number Sheet Tab
-
Enter last year’s performance data.
-
Compare current performance with past data easily to track improvement.
7. KPI Definition Sheet Tab
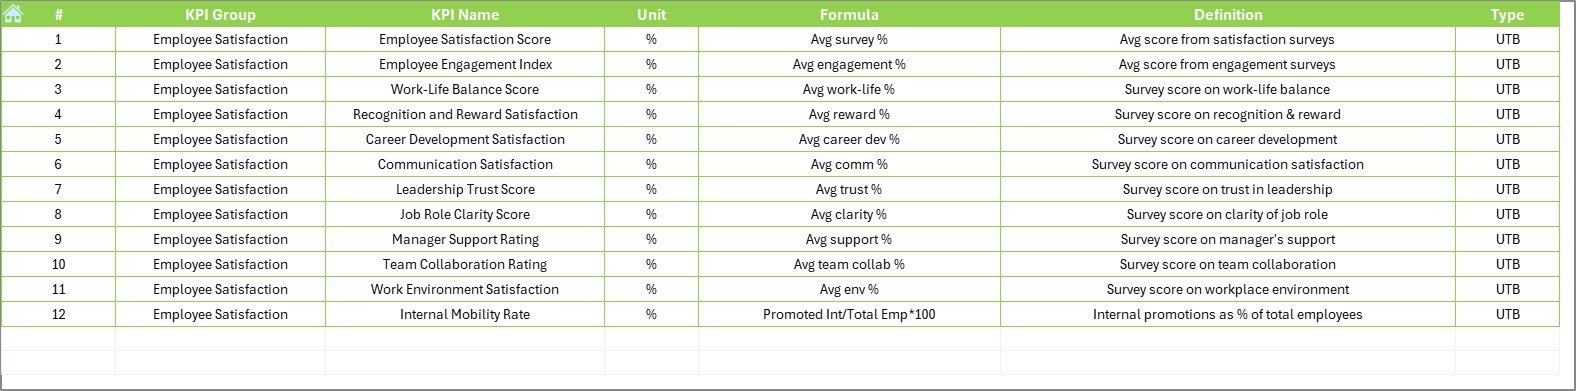
-
Maintain a clean record of all KPIs including:
- Name
- Group
- Unit
- Formula
- Definition
-
Keeps everything organized and easily accessible for analysis.
Click to Purchases Human Resources Employee Satisfaction KPI Dashboard in Excel
Why Do You Need an Employee Satisfaction KPI Dashboard?
Many companies measure employee satisfaction only through annual surveys. But that’s no longer enough. With this dashboard:
-
You track satisfaction monthly and yearly.
-
You spot issues early before they become big problems.
-
You make data-driven decisions instead of relying on assumptions.
Thus, a dashboard like this transforms how you view and improve employee happiness and engagement.
Advantages of Human Resources Employee Satisfaction KPI Dashboard
There are countless advantages to using this dashboard, but here are some of the biggest highlights:
📈 Real-time Monitoring
See how your employee satisfaction metrics are performing without waiting for the year-end report.
🎯 Better Target Setting
Set clear, achievable monthly and yearly targets, and track them in one place.
🧩 Easy Customization
You can easily add, remove, or modify KPIs according to your organization’s needs.
🔍 Identify Trends Early
Trend charts highlight emerging issues or success stories before they impact your workforce.
📊 Data-Driven Decisions
Replace guesswork with facts, leading to more effective HR strategies.
💻 Simple and User-Friendly
Designed for HR teams of any size—no advanced Excel knowledge needed.
Best Practices for Using the Employee Satisfaction KPI Dashboard
To get the best results, follow these practical best practices:
1. Regular Data Updates
Update actual numbers every month without fail. Fresh data ensures accuracy.
2. Set SMART Targets
Always set Specific, Measurable, Achievable, Relevant, and Time-bound (SMART) targets for each KPI.
3. Involve Department Heads
Collaborate with department leaders to ensure the targets and actuals reflect the ground reality.
4. Analyze Trends
Don’t just look at numbers—analyze trends! If satisfaction is consistently dropping in a department, dig deeper to understand why.
5. Communicate Results
Share dashboard highlights with leadership and teams. Transparency boosts trust and engagement.
6. Refine KPIs Periodically
Review and adjust KPIs annually to ensure they align with changing business goals and employee expectations.
How to Get Started with the Employee Satisfaction KPI Dashboard?
Starting is easy!
Follow these quick steps:
-
Download and open the Excel file.
-
Go to the Actual Numbers Input sheet and start entering your real data.
-
Input your monthly and yearly targets in the Target sheet.
-
Update previous year’s data in the Previous Year Number sheet.
-
Review KPI definitions and make sure they match your organizational goals.
-
Use the Dashboard sheet to view your progress month by month.
-
Watch the trends using the KPI Trend sheet.
Simple, right?
How This Dashboard Boosts HR Strategy?
HR is no longer just about administration; it’s about creating value.
With this dashboard:
-
HR teams show direct impact on employee engagement strategies.
-
Management understands employee needs better.
-
Organizations retain talent more effectively by acting on satisfaction insights.
It connects employee satisfaction data directly with organizational performance and strategy.
Conclusion
The Human Resources Employee Satisfaction KPI Dashboard in Excel is not just a reporting tool; it’s a strategic asset for every HR team. It helps measure what matters most—your people’s happiness.
By tracking KPIs monthly and yearly, setting smart goals, analyzing trends, and acting on insights, you can drive meaningful change in your organization. In short, happier employees mean better business results.
Ready to transform the way you measure employee satisfaction?
Download the dashboard and start today!
Frequently Asked Questions (FAQs)
1. What KPIs should I track for Employee Satisfaction?
You should track metrics like Employee Engagement Score, Training Satisfaction Rate, Management Feedback Score, Employee Turnover Rate, Internal Promotion Rate, and Work-Life Balance Satisfaction.
2. Can I customize the KPIs in this dashboard?
Yes! The dashboard is completely customizable. You can add new KPIs or modify existing ones to fit your organization’s needs.
3. How often should I update the dashboard?
Ideally, update the dashboard every month. Consistent updates give you real-time insights and help you take timely action.
4. Do I need advanced Excel skills to use this dashboard?
No. The dashboard is designed for easy use. Basic Excel knowledge like data entry and dropdown selection is enough.
5. Can I use this dashboard for different departments?
Absolutely! You can use it for HR as a whole or adapt it for individual departments by adjusting KPIs accordingly.
6. What if my company’s financial year starts from a different month?
No worries! You can easily adjust the starting month using the input field provided on the Actual Numbers Input sheet.
Visit our YouTube channel to learn step-by-step video tutorials