In today’s fast-paced business world, every company wants to ensure their employees are growing, performing, and staying engaged. Tracking human resources (HR) growth metrics is no longer optional; it is crucial for organizational success.
Without proper monitoring, businesses risk losing their best talent and missing opportunities for improvement.
Fortunately, using an HR Growth Metrics KPI Dashboard in Excel can make this task easier, faster, and much more insightful.
In this article, we will explore everything about the HR Growth Metrics KPI Dashboard, its advantages, best practices, and frequently asked questions.
Click to Purchases Human Resources Growth Metrics KPI Dashboard in Excel
What is a Human Resources Growth Metrics KPI Dashboard in Excel?
A Human Resources Growth Metrics KPI Dashboard in Excel is a powerful tool that helps HR teams measure, track, and analyze key performance indicators (KPIs) related to employee growth and development.
It collects important data like hiring rates, training hours, turnover percentages, and promotion rates and presents them in an easy-to-read visual format.
By using Excel, you have complete flexibility to customize the dashboard according to your company’s unique needs.
Key Features of the Human Resources Growth Metrics KPI Dashboard
We have designed a ready-to-use Human Resources Growth Metrics KPI Dashboard with multiple useful features. Let’s dive into what makes this template outstanding:
Home Sheet

- Serves as an index or navigation page.
- Includes 6 quick-access buttons to jump to various worksheets.
- Ensures easy navigation across the dashboard.
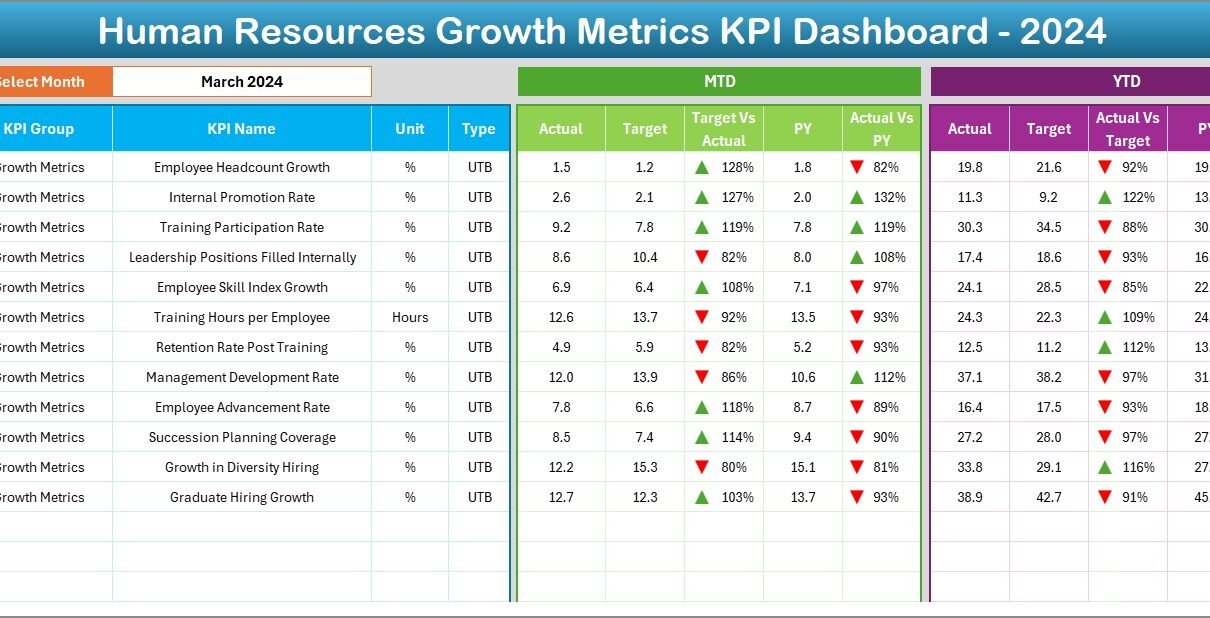
Dashboard Sheet Tab

- This is the main sheet where all KPI summaries are displayed.
- You can select the month from a drop-down list in cell D3.
- The dashboard dynamically updates based on your selected month.
- Displays:
- MTD (Month-to-Date) Actual, Target, and Previous Year Data.
- YTD (Year-to-Date) Actual, Target, and Previous Year Data.
- Includes Conditional Formatting with up/down arrows to highlight performance.
Click to Purchases Human Resources Growth Metrics KPI Dashboard in Excel
KPI Trend Sheet Tab

- Select a KPI Name from a drop-down in cell C3.
- Shows:
- KPI Group
- KPI Unit
- Type (Lower the Better or Upper the Better)
- Formula
- Short Definition
- Provides trend charts for both MTD and YTD performance.
Actual Numbers Input Sheet

- Allows input of actual performance numbers.
- You can adjust the year’s start month by changing cell E1.
- Collects both MTD and YTD data effortlessly.
Target Sheet Tab

- Input target numbers for each KPI monthly.
- Supports easy updating for both MTD and YTD targets.
Previous Year Numbers Sheet Tab

- Allows entry of prior year’s actual numbers.
- Helps in analyzing growth by comparing past and current performances.
KPI Definition Sheet Tab

- Centralized sheet to define all KPIs.
- Columns include:
- KPI Name
- KPI Group
- Unit
- Formula
- Short Definition
Why Should You Use a Human Resources Growth Metrics KPI Dashboard?
Using a manual process to track employee growth is time-consuming and often inaccurate.
Here are some important reasons why you should switch to a dashboard-based system:
- Real-time Tracking: Instantly view monthly and yearly progress.
- Improved Decision Making: Quickly spot issues and act on them.
- Better Accountability: Track the ownership and results of HR initiatives.
- Increased Transparency: Share progress updates easily with stakeholders.
- Enhanced Efficiency: Save hours spent on manual calculations and reporting.
Advantages of Human Resources Growth Metrics KPI Dashboard
Let’s take a deeper look at the major benefits:
📈 1. Data-Driven Decision Making
By collecting accurate metrics, HR managers can make smarter decisions rather than relying on guesswork.
🕒 2. Saves Time and Resources
The automated calculations and visuals save countless hours compared to manual reporting.
📊 3. Clear Visualizations
Easy-to-understand graphs, charts, and conditional formatting help you interpret data quickly.
🔍 4. Performance Monitoring
You can track employee performance, growth, and training outcomes in real-time.
🚀 5. Supports Strategic Planning
Helps HR departments align employee development with overall business strategies.
Best Practices for Building and Using an HR Growth Metrics KPI Dashboard
If you want your dashboard to be truly effective, you must follow some best practices.
Here’s what you should keep in mind:
- Define Clear KPIs
Always start by deciding which KPIs truly matter to your HR goals.
Examples:
- Employee Turnover Rate
- Internal Promotion Rate
- Training Completion Rate
- Hiring Speed
- Keep It Simple
Use simple layouts and clear visualizations.
Avoid cluttering your dashboard with too much data.
- Update Data Regularly
Set a monthly schedule to update actual, target, and previous year numbers.
Keeping your data fresh ensures accurate reporting.
- Use Conditional Formatting
Apply conditional formatting like color-coding, arrows, and indicators to highlight important changes immediately.
- Involve Stakeholders
Regularly share your dashboard with top management and HR teams.
This keeps everyone aligned on employee growth strategies.
How to Customize the HR Growth Metrics KPI Dashboard in Excel?
Customizing your dashboard is easier than you think!
Follow these simple steps:
- Update the KPI Definition Sheet: Add or remove KPIs based on your organization’s needs.
- Adjust Targets: Modify target values monthly based on updated HR goals.
- Enter New Actual Numbers: Regularly fill in the MTD and YTD data.
- Review Conditional Formatting: Tweak the visual indicators if needed.
- Enhance Navigation: Add or update buttons on the Home sheet for new sections if you expand the dashboard.
Common KPIs to Track in Human Resources Growth Metrics Dashboard
Here’s a list of some essential KPIs you might want to include:
- Employee Retention Rate
- Training Hours per Employee
- Internal Mobility Rate
- Employee Satisfaction Score
- Time-to-Hire
- Onboarding Completion Rate
- Absenteeism Rate
- Leadership Development Participation
These KPIs ensure you cover recruitment, engagement, development, and retention—four pillars of HR success.
How the HR Growth Metrics KPI Dashboard Supports Business Goals
Your employees are your most valuable assets.
When you track their growth systematically, you directly contribute to:
- Higher productivity
- Better employee morale
- Lower turnover rates
- Stronger leadership pipelines
- Improved organizational performance
Thus, the HR Growth Metrics Dashboard is not just an HR tool; it is a strategic growth tool.
Conclusion
An effective Human Resources Growth Metrics KPI Dashboard in Excel can transform the way your organization manages employee growth.
It brings clarity, efficiency, and strategic focus to HR processes.
By using this dashboard, HR managers can make smarter decisions, track real progress, and demonstrate HR’s impact on business success.
If you want to enhance your HR reporting, empower your leadership team, and build a stronger workforce, investing time in setting up this dashboard is truly worth it.
Frequently Asked Questions (FAQs)
What are Human Resources Growth Metrics?
Human Resources Growth Metrics are measurements that track the growth, development, and performance of employees within an organization.
Why is it important to track HR Growth KPIs?
Tracking HR Growth KPIs helps businesses improve decision-making, enhance employee engagement, retain top talent, and align HR initiatives with business goals.
Can I customize the HR Growth Metrics Dashboard?
Yes, the dashboard is fully customizable! You can modify KPI names, formulas, target numbers, and even add new KPIs based on your needs.
How often should I update the data in the dashboard?
It is best to update the data monthly. You should enter MTD (Month-to-Date) and YTD (Year-to-Date) values regularly to keep the dashboard accurate.
Click to Purchases Human Resources Growth Metrics KPI Dashboard in Excel
Visit our YouTube channel to learn step-by-step video tutorials