In today’s fast-paced business environment, keeping stakeholders informed about Human Resources (HR) performance is no longer a luxury—it is a necessity. Whether you are managing recruitment, employee engagement, or compliance, HR plays a crucial role in shaping organizational success. That’s where a Human Resources Stakeholder Reporting KPI Dashboard in Excel comes into play.
This article will walk you through everything you need to know about creating and using an HR Stakeholder Reporting Dashboard. We will cover its advantages, best practices, and even answer some frequently asked questions. So, let’s dive right in!
Click to Purchases Human Resources Stakeholder Reporting KPI Dashboard in Excel
What Is a Human Resources Stakeholder Reporting KPI Dashboard?
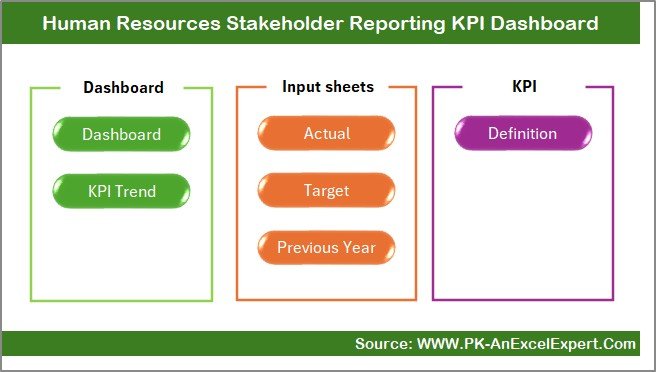
A Human Resources Stakeholder Reporting KPI Dashboard is a dynamic Excel-based tool that displays essential HR performance indicators (KPIs) in a visual and understandable format. It tracks critical metrics such as employee turnover, recruitment efficiency, training completion, and more.
Instead of digging through spreadsheets and reports, stakeholders can instantly view real-time insights in one place, making decision-making much faster and more effective.
Key Features of the Human Resources Stakeholder Reporting KPI Dashboard
Our ready-to-use Excel template for HR Stakeholder Reporting comes loaded with powerful features that ensure smooth tracking, reporting, and decision-making:
1. Home Sheet
-
Acts as the central navigation panel.
-
Includes six clickable buttons that allow users to jump directly to important worksheets.
-
Makes it super easy to move between various sections of the dashboard.
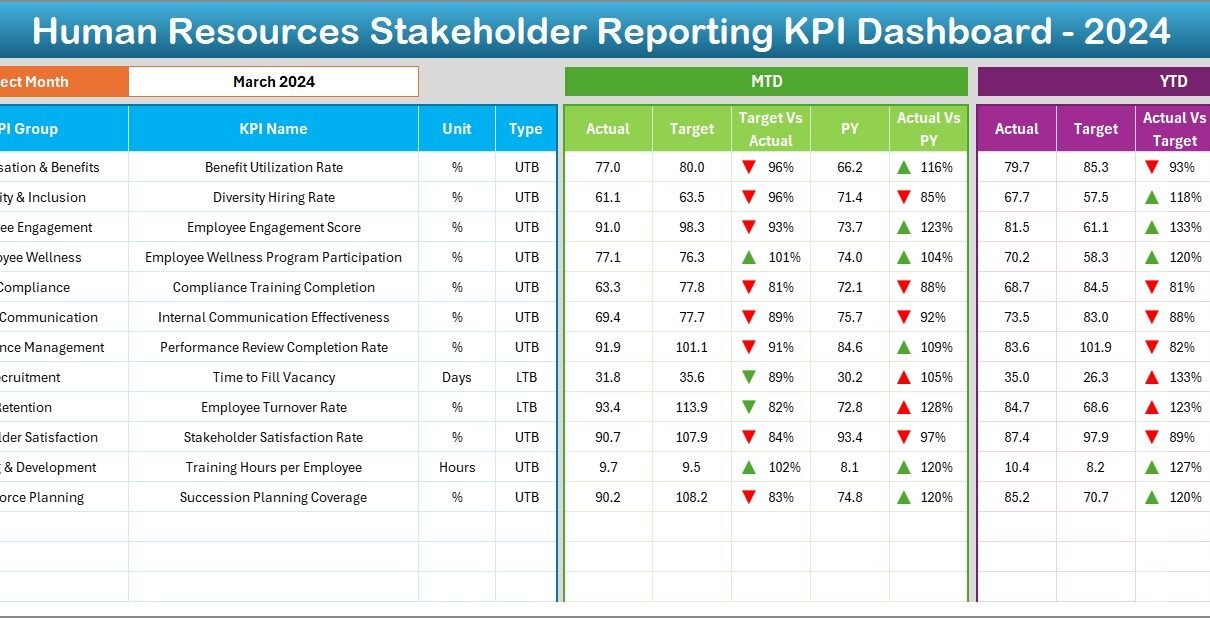
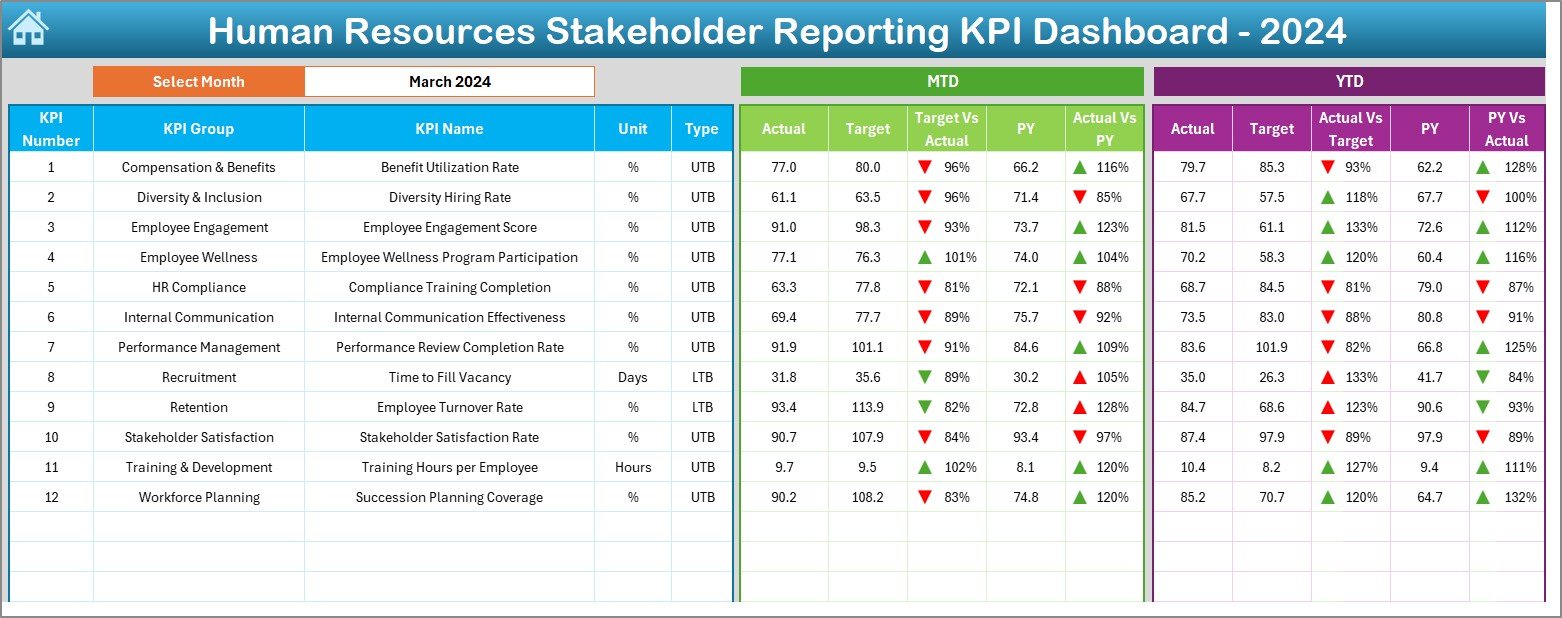
2. Dashboard Sheet Tab
-
This is the main visualization sheet.
-
Month selection is available through a drop-down at cell D3.
-
Automatically updates Month-to-Date (MTD) and Year-to-Date (YTD) performance based on Actual, Target, and Previous Year data.
-
Includes Conditional Formatting Arrows (up/down) to show positive or negative performance trends at a glance.
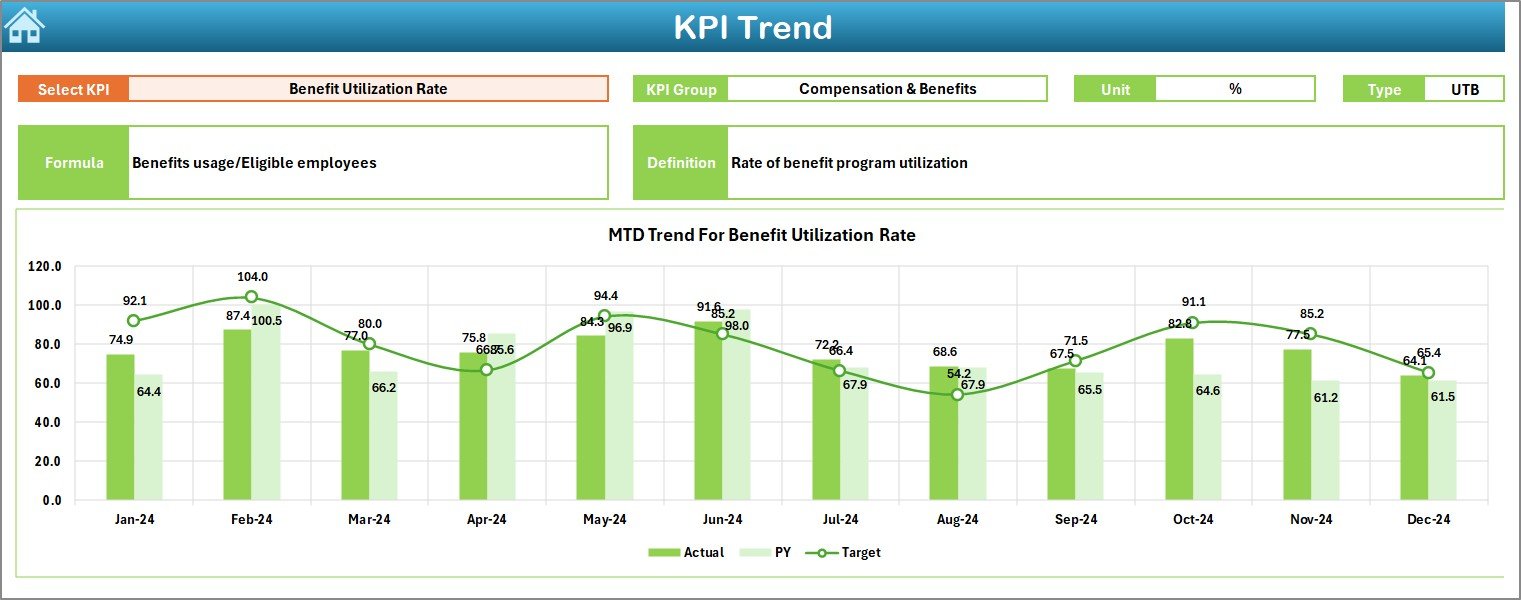
3. KPI Trend Sheet Tab
-
Select a specific KPI using a drop-down list at cell C3.
-
Displays vital KPI information like Group, Unit, Formula, and Type (whether Lower the Better or Upper the Better).
-
Provides a trend chart for both MTD and YTD numbers, comparing Actual, Target, and Previous Year metrics.
Click to Purchases Human Resources Stakeholder Reporting KPI Dashboard in Excel
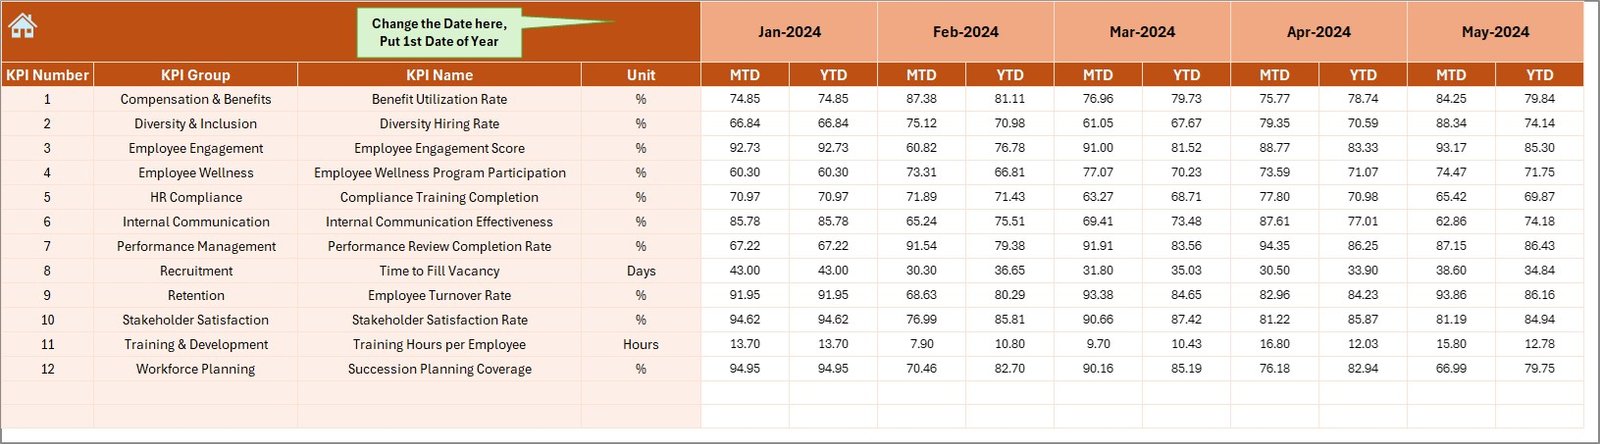
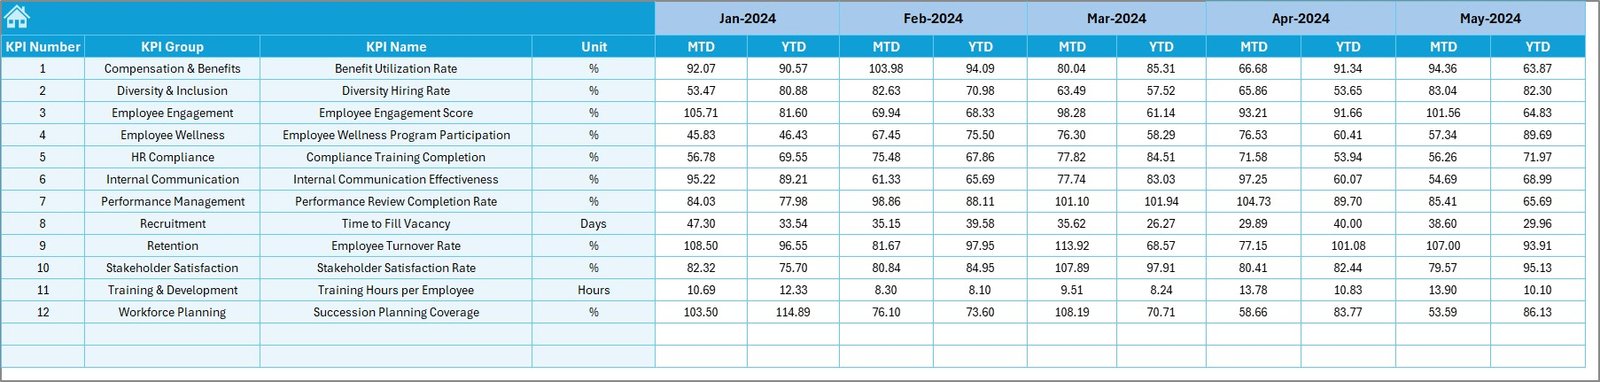
4. Actual Numbers Input Sheet
-
Enter the real-time numbers for MTD and YTD performances.
-
Flexible month settings: set the first month of your fiscal or calendar year using cell E1.
5. Target Sheet Tab
-
Record targeted KPIs for each month separately for MTD and YTD figures.
-
Enables precise comparison between Actual vs Target numbers.
6. Previous Year Numbers Sheet Tab
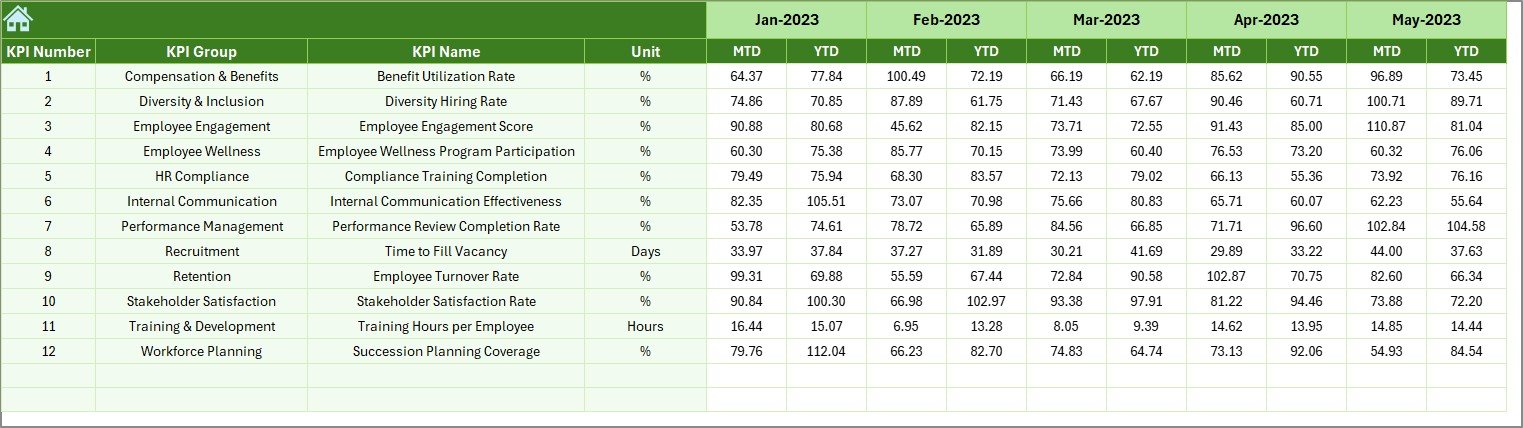
-
Input the previous year’s data for all KPIs.
-
Helps in conducting year-over-year comparisons to identify long-term trends.
7. KPI Definition Sheet Tab
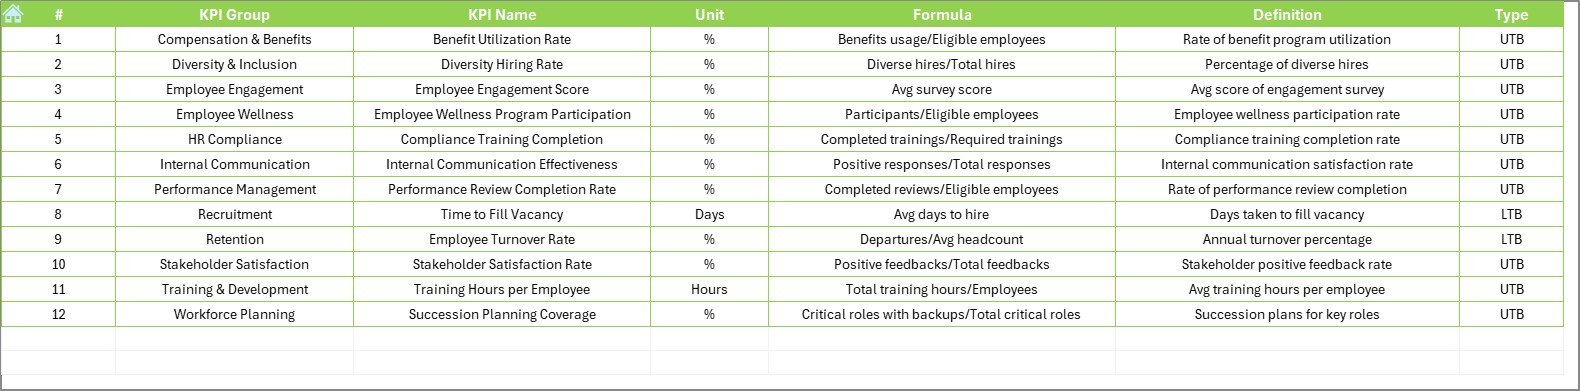
-
Maintain a library of KPI definitions.
-
Add details like KPI Group, KPI Name, Unit, Formula, and Definitions for easy reference and standardization.
Why Do You Need an HR Stakeholder Reporting Dashboard?
In the modern corporate world, stakeholders expect timely, accurate, and actionable insights. Here’s why using an HR Stakeholder Reporting Dashboard is crucial:
-
Informed Decision-Making: Provides real-time data for better business decisions.
-
Transparency: Builds trust among stakeholders by sharing clear HR metrics.
-
Efficiency: Reduces time spent on creating manual reports.
-
Accountability: Makes it easy to track performance against set goals.
-
Strategic Alignment: Ensures HR goals align with overall business objectives.
Advantages of Using a Human Resources Stakeholder Reporting KPI Dashboard
Using a dashboard brings numerous benefits to HR teams and stakeholders alike. Let’s explore some of them:
📈 Real-Time Insights
Stakeholders can monitor HR performance at any time without waiting for end-of-month reports.
🧩 Easy Customization
You can adjust KPIs, update targets, or add new metrics easily within the Excel structure.
🎯 Better Focus on Strategic Goals
Visual reports help HR teams concentrate on KPIs that directly impact business outcomes.
🕒 Saves Time
Automated data updates and visualizations significantly cut down the time needed for report generation.
🔒 Data Integrity
Having a centralized location for HR data reduces errors and inconsistencies.
How to Effectively Use the Human Resources Stakeholder Reporting Dashboard?
If you want to get the best results from your dashboard, follow these simple steps:
-
Start with Accurate Data:
Always double-check the numbers you input into the Actual Numbers, Target, and Previous Year sheets. -
Update Monthly:
Regular updates ensure stakeholders always see the most recent and relevant data. -
Customize KPIs:
Every organization has unique goals. Modify or add KPIs to match your specific business needs. -
Use Conditional Formatting Smartly:
Pay attention to the up and down arrows—they offer immediate feedback about performance. -
Review Trends:
Use the KPI Trend sheet to analyze whether performance is improving, stable, or declining.
Best Practices for the Human Resources Stakeholder Reporting KPI Dashboard
To maximize the effectiveness of your HR KPI dashboard, keep these best practices in mind:
✅ Keep It Simple
Avoid overcrowding the dashboard. Focus on the most important KPIs that truly matter to stakeholders.
✅ Maintain Consistent Formatting
Use consistent colors, fonts, and formatting to make the dashboard easy to read and visually appealing.
✅ Validate Data Regularly
Perform data validation checks periodically to maintain the accuracy of reports.
✅ Involve Stakeholders
Gather feedback from stakeholders on what KPIs matter most to them and adjust your dashboard accordingly.
✅ Train Your Team
Make sure your HR team understands how to use and update the dashboard properly.
How Does the KPI Trend Sheet Help Stakeholders?
The KPI Trend sheet is an essential part of the dashboard because:
-
It allows stakeholders to choose a specific KPI and drill deeper into its details.
-
It shows whether performance is improving or declining over months.
-
It visualizes comparisons between Actual, Target, and Previous Year values, making trends easy to spot.
-
It highlights which KPIs need urgent attention, helping prioritize strategic actions.
What Makes Our Excel Template Special?
Our Human Resources Stakeholder Reporting KPI Dashboard stands out because:
-
User-Friendly Navigation: Home sheet buttons make moving around simple and intuitive.
-
Dynamic Updates: Select a month and see all numbers update instantly.
-
Professional Design: Clean layout with charts, graphs, and color-coded indicators.
-
Ready to Use: No need for complex setup—just input your data and start analyzing.
-
Highly Customizable: Add or modify KPIs, set your targets, and change the template according to your needs.
Conclusion
A Human Resources Stakeholder Reporting KPI Dashboard in Excel is more than just a reporting tool. It is a strategic asset that improves transparency, drives smarter decisions, and aligns HR initiatives with business objectives. By using our ready-to-use template, you can save time, reduce reporting errors, and impress your stakeholders with professional, real-time HR insights.
If you want your HR reporting to be more efficient, transparent, and actionable, then this dashboard is the perfect solution!
Frequently Asked Questions (FAQs)
❓ What is a Stakeholder Reporting KPI Dashboard in HR?
It is an Excel-based dashboard that displays HR key performance indicators in an organized way, allowing stakeholders to view real-time insights and performance trends.
❓ Why should HR teams use a KPI Dashboard?
It saves time, provides accurate reporting, and enhances decision-making by offering quick visibility into HR performance metrics.
❓ Can I customize the KPIs in the template?
Yes, you can easily add, modify, or remove KPIs according to your organization’s specific needs.
❓ Is this dashboard beginner-friendly?
Absolutely! The dashboard is designed for easy navigation and updating, even for users who are not Excel experts.
❓ How often should I update the dashboard?
Ideally, you should update it monthly to ensure stakeholders have the latest data at their fingertips.
❓ Can the dashboard handle different fiscal years?
Yes, you can set your starting month in the Actual Numbers Input sheet to match your fiscal year.
Visit our YouTube channel to learn step-by-step video tutorials