Humanitarian organizations operate in demanding environments. They deliver emergency relief, medical assistance, food distribution, education programs, and community support. However, without structured KPI tracking, leaders struggle to measure real impact.
Many NGOs still depend on manual reports and scattered spreadsheets. As a result, decision-makers face delays, limited visibility, and weak donor reporting.
So, how can humanitarian organizations measure performance clearly and consistently?
The answer is simple.
You need a Humanitarian Aid KPI Scorecard in Excel.
This ready-to-use KPI scorecard template helps humanitarian teams track actual vs target performance, monitor MTD and YTD results, analyze trends, and document KPI definitions — all within one organized Excel workbook.
In this complete guide, you will learn:
-
What a Humanitarian Aid KPI Scorecard in Excel is
-
Why humanitarian organizations need KPI scorecards
-
A detailed explanation of all 4 worksheets
-
Advantages of Humanitarian Aid KPI Scorecard in Excel
-
Best Practices for the Humanitarian Aid KPI Scorecard in Excel
-
Frequently Asked Questions
Let us explore everything step by step.
Click to Purchases Humanitarian Aid KPI Scorecard in Excel
What Is a Humanitarian Aid KPI Scorecard in Excel?
A Humanitarian Aid KPI Scorecard in Excel is a structured performance monitoring tool designed to evaluate key performance indicators for humanitarian programs.
Instead of reviewing disconnected files, this scorecard allows you to:
-
Select a month for analysis
-
Compare MTD and YTD performance
-
Track actual vs target values
-
View performance status using visual indicators
-
Analyze performance trends
-
Document KPI formulas and definitions
Moreover, Excel updates calculations automatically when you enter new data. Therefore, leaders can make faster and smarter decisions.
Why Do Humanitarian Organizations Need a KPI Scorecard?
Humanitarian missions focus on impact and accountability. Donors expect transparency. Communities rely on timely services.
However, without structured KPI monitoring, organizations may:
-
Miss performance gaps
-
Fail to optimize resources
-
Struggle with donor reporting
-
Lack strategic clarity
Therefore, a KPI scorecard improves governance and accountability.
When organizations implement KPI tracking effectively, they:
-
Improve operational efficiency
-
Enhance transparency
-
Increase donor confidence
-
Strengthen program monitoring
-
Support long-term planning
Key Features of Humanitarian Aid KPI Scorecard in Excel
Click to Purchases Humanitarian Aid KPI Scorecard in Excel
This template includes 4 well-structured worksheets designed for complete KPI management.
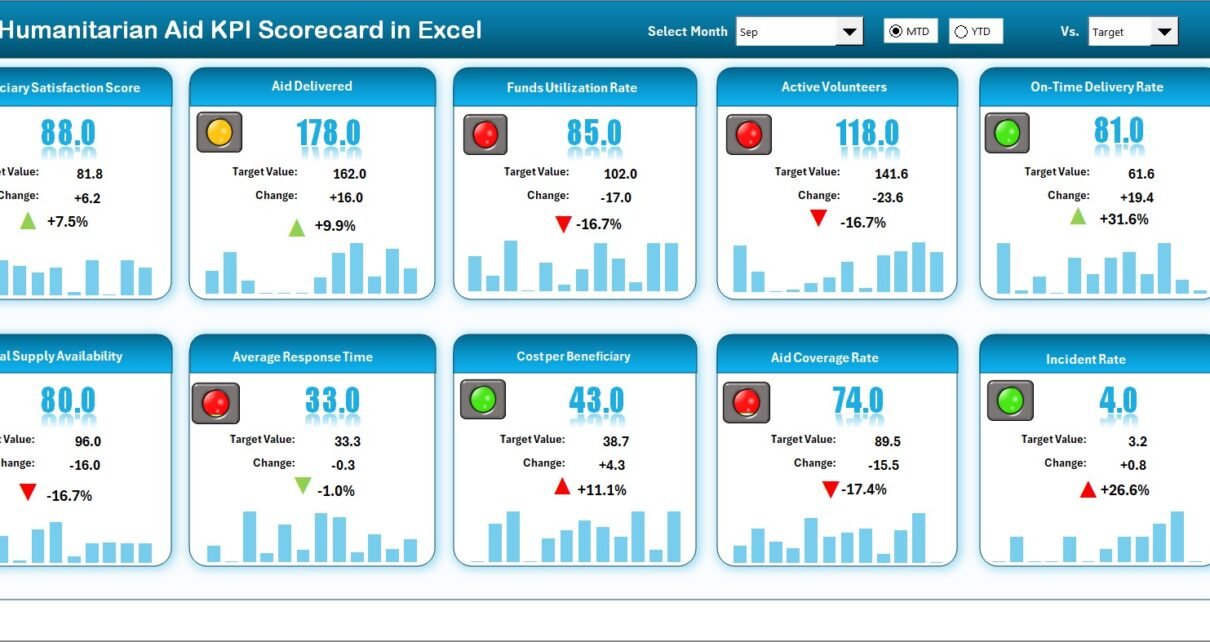
1️⃣ Scorecard Sheet – Main KPI Performance Dashboard
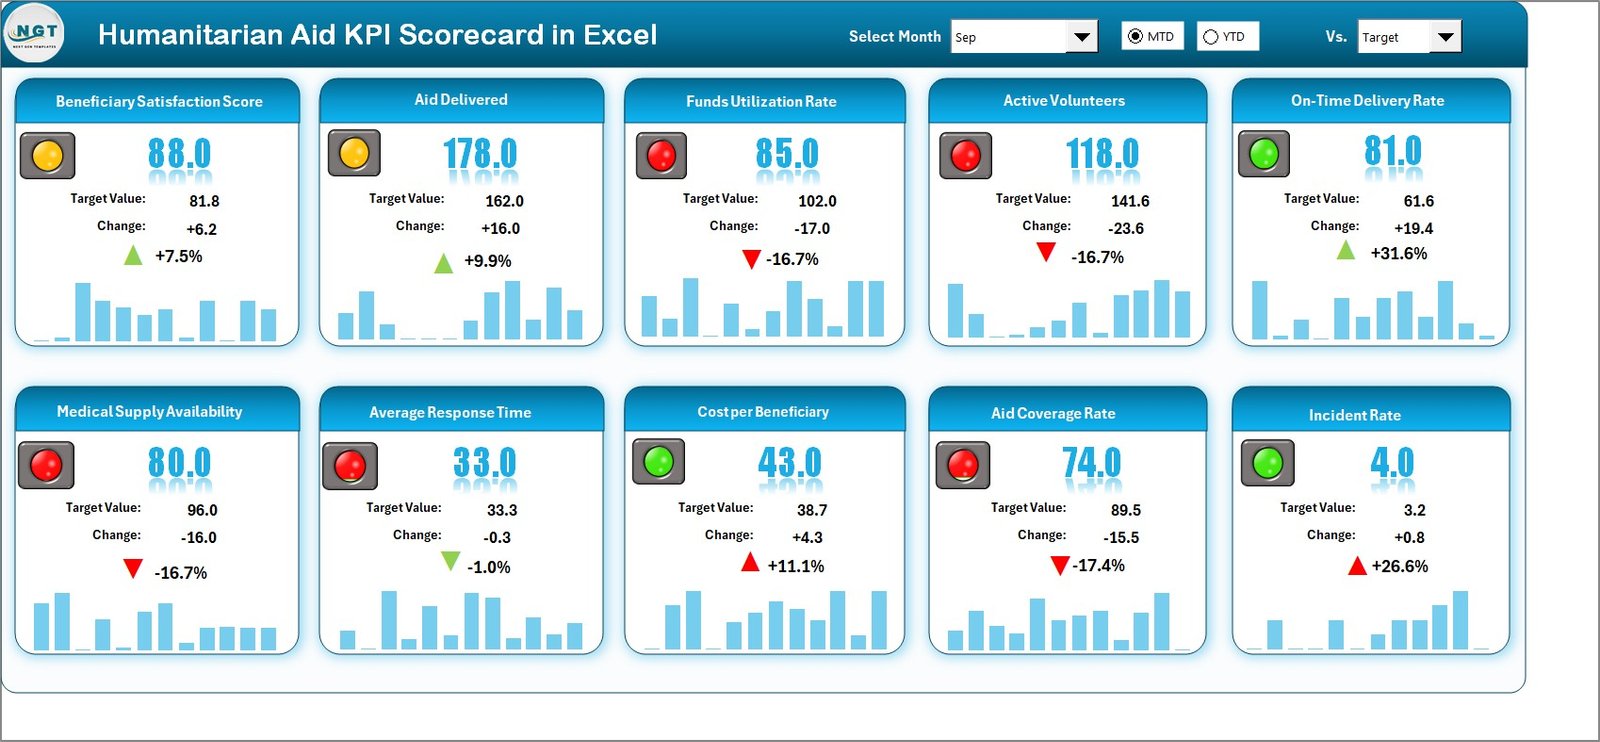
The Scorecard sheet acts as the primary interface for viewing performance.
What Can You Do on the Scorecard Sheet?
✔ Use Dropdown Menus
You can select:
-
Month
-
MTD (Month-to-Date)
-
YTD (Year-to-Date)
When you change the selection, the entire scorecard updates automatically.
✔ Compare Actual vs Target
The scorecard displays:
-
Actual MTD
-
Target MTD
-
Actual YTD
-
Target YTD
This comparison helps you identify performance gaps quickly.
✔ View Visual Indicators
The sheet uses:
-
Conditional formatting
-
Color-coded performance indicators
For example:
-
Green color indicates KPI meets target
-
Red color indicates KPI underperforms
Therefore, leaders can evaluate performance instantly.
✔ Get a Comprehensive KPI Overview
The scorecard displays:
-
KPI Name
-
KPI Group
-
Unit of Measurement
-
Performance comparisons
-
MTD and YTD values
Thus, you gain complete visibility in one place.
Click to Purchases Humanitarian Aid KPI Scorecard in Excel
2️⃣ KPI Trend Sheet – Analyze Performance Over Time
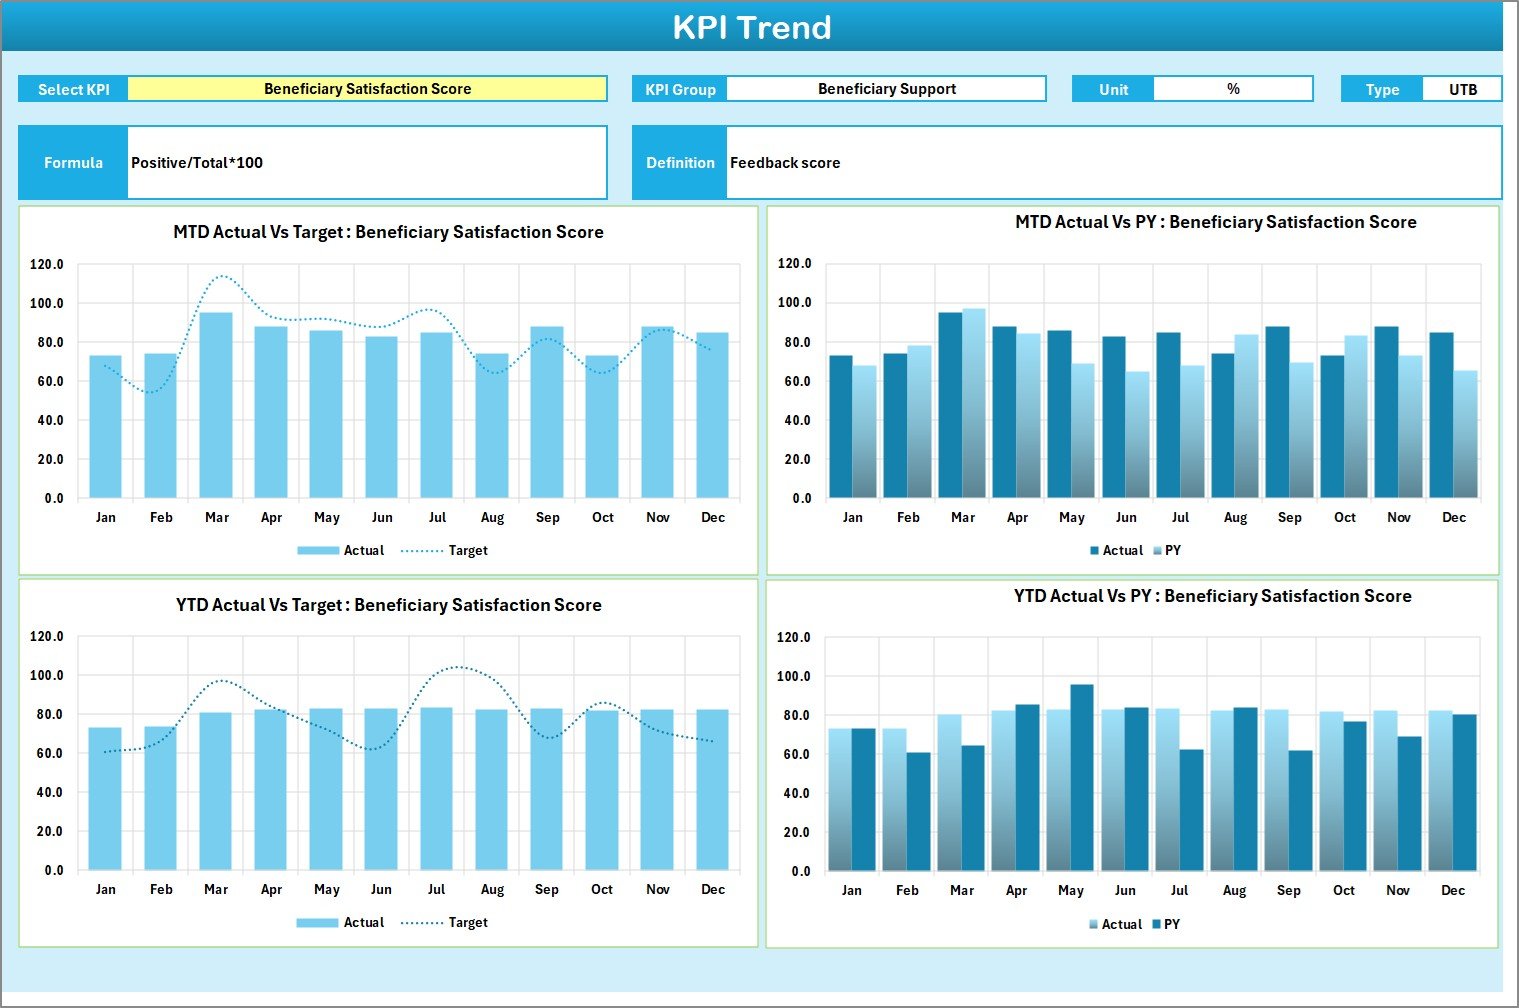
The KPI Trend sheet provides detailed analysis for individual KPIs.
On cell C3, select a KPI from the dropdown list.
Once selected, the sheet displays:
-
KPI Group
-
Unit
-
KPI Type (Lower the Better or Upper the Better)
-
KPI Formula
-
KPI Definition
Trend Charts Included
The sheet displays two charts:
-
MTD Trend Chart (Actual vs Target vs Previous Year)
-
YTD Trend Chart (Actual vs Target vs Previous Year)
These charts help you:
-
Identify growth patterns
-
Detect performance fluctuations
-
Compare with previous year
-
Analyze seasonal variations
For example:
If beneficiary reach increases steadily, the trend line rises.
If response time increases and KPI type is Lower the Better, performance declines.
Thus, trend analysis supports proactive action.
Click to Purchases Humanitarian Aid KPI Scorecard in Excel
3️⃣ Input Data Sheet – Central Data Entry Area
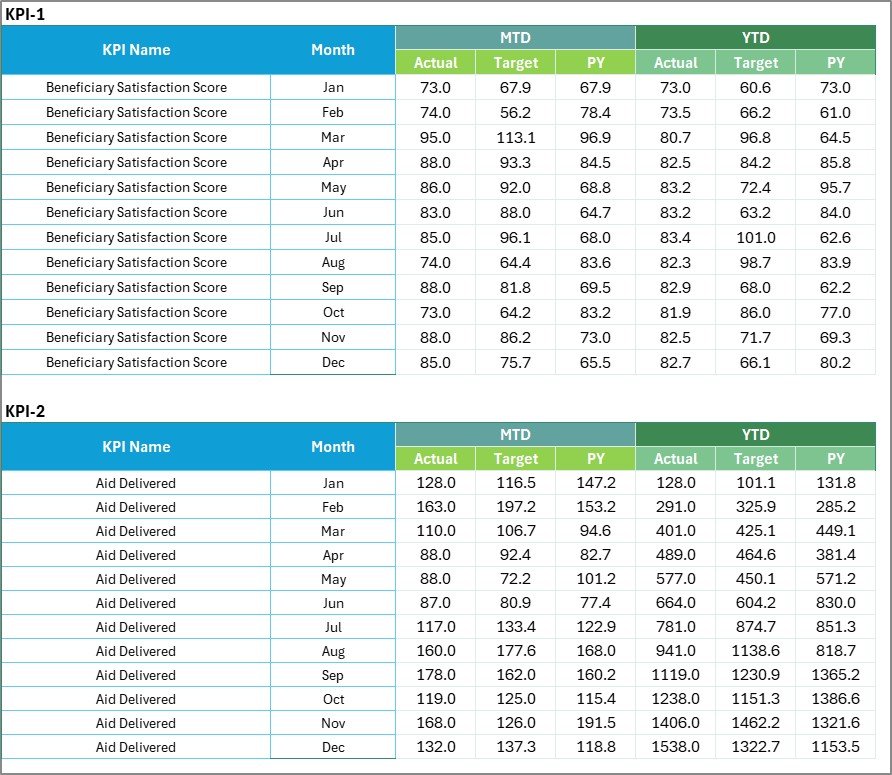
The Input Data sheet stores all KPI numbers.
Here, you enter:
-
Actual values
-
Target values
-
Monthly performance data
Because this sheet drives the entire scorecard, accurate data entry remains essential.
Moreover, you can update data easily when new results become available. Therefore, the scorecard stays current and relevant.
Click to Purchases Humanitarian Aid KPI Scorecard in Excel
4️⃣ KPI Definition Sheet – KPI Documentation and Governance
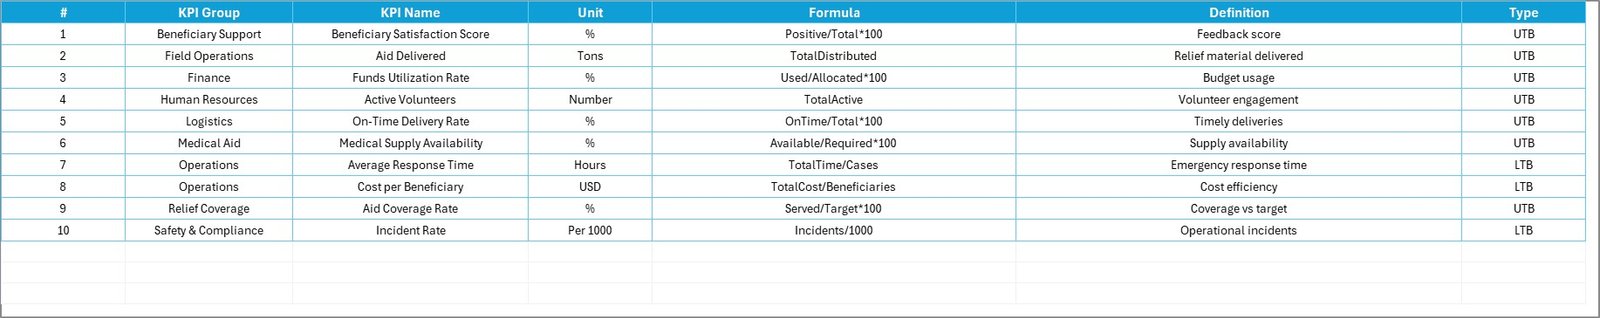
The KPI Definition sheet stores:
-
KPI Name
-
KPI Group
-
Unit
-
Formula
-
Definition
This documentation ensures:
-
Clear KPI understanding
-
Standardized measurement logic
-
Better governance
-
Improved audit readiness
Therefore, stakeholders can understand how each KPI works.
What KPIs Can You Track in Humanitarian Aid?
You can monitor KPIs such as:
-
Number of Beneficiaries Served
-
Aid Distribution Efficiency
-
Emergency Response Time
-
Budget Utilization Percentage
-
Volunteer Engagement Rate
-
Medical Coverage Percentage
-
Project Completion Rate
-
Fund Disbursement Speed
Additionally, you can customize KPIs based on your mission focus.
Click to Purchases Humanitarian Aid KPI Scorecard in Excel
Advantages of Humanitarian Aid KPI Scorecard in Excel
Let us explore the benefits.
1️⃣ Easy to Implement
Most organizations already use Excel. Therefore, adoption becomes simple.
2️⃣ Cost-Effective Solution
You avoid expensive business intelligence tools.
3️⃣ Flexible and Customizable
You can add, edit, or remove KPIs as needed.
4️⃣ Clear Performance Visualization
Color-coded indicators make analysis simple.
5️⃣ MTD and YTD Tracking
You can analyze both short-term and long-term performance.
6️⃣ Trend Analysis Capability
Charts provide performance insights over time.
7️⃣ Improved Donor Reporting
Structured data strengthens credibility and transparency.
Click to Purchases Humanitarian Aid KPI Scorecard in Excel
Best Practices for the Humanitarian Aid KPI Scorecard in Excel
To maximize value, follow these best practices:
✔ Define Clear and Measurable KPIs
Align KPIs with organizational objectives.
✔ Update Data Regularly
Monthly updates ensure reliability.
✔ Validate Data Before Reporting
Check actual and target numbers carefully.
✔ Review Trends Quarterly
Trend analysis helps identify long-term patterns.
✔ Use KPI Type Correctly
Define whether KPI is Lower the Better or Upper the Better.
✔ Share Scorecard with Leadership
Regular review improves accountability and strategy.
Common Mistakes to Avoid
Avoid these errors:
-
Setting unrealistic targets
-
Ignoring previous year comparison
-
Skipping data validation
-
Overcomplicating KPI definitions
-
Failing to update data regularly
When you avoid these mistakes, your scorecard becomes accurate and effective.
Click to Purchases Humanitarian Aid KPI Scorecard in Excel
How Does This KPI Scorecard Improve Humanitarian Impact?
This scorecard helps organizations:
-
Measure impact clearly
-
Identify performance gaps early
-
Optimize resource allocation
-
Increase accountability
-
Strengthen donor trust
-
Improve strategic planning
Therefore, data-driven decisions replace assumptions.
Click to Purchases Humanitarian Aid KPI Scorecard in Excel
Conclusion: Why Should You Use Humanitarian Aid KPI Scorecard in Excel?
Humanitarian work demands accountability and measurable results. Therefore, structured KPI tracking becomes essential.
The Humanitarian Aid KPI Scorecard in Excel provides:
-
Actual vs Target comparison
-
MTD and YTD tracking
-
Visual performance indicators
-
Trend analysis
-
Clear KPI documentation
-
Easy data updates
Moreover, because it remains simple and customizable, teams can implement it quickly.
If you want transparent, measurable, and impact-focused humanitarian performance monitoring, this Excel KPI scorecard delivers a practical and powerful solution.
Click to Purchases Humanitarian Aid KPI Scorecard in Excel
Frequently Asked Questions with Answers
1️⃣ Can I customize KPIs?
Yes. You can modify KPI details in the KPI Definition sheet.
2️⃣ How does MTD and YTD selection work?
Use the dropdown menu in the Scorecard sheet to switch between MTD and YTD views.
3️⃣ What does Lower the Better mean?
Lower the Better means lower values indicate improved performance.
4️⃣ Can I compare with previous year?
Yes. The KPI Trend sheet supports comparison with previous year data.
5️⃣ Is this suitable for small NGOs?
Yes. Both small and large humanitarian organizations can use it effectively.
6️⃣ Do I need advanced Excel skills?
No. Basic Excel knowledge is sufficient.
7️⃣ Can I use this for donor reporting?
Yes. The structured format supports professional reporting.
Click to Purchases Humanitarian Aid KPI Scorecard in Excel
Visit our YouTube channel to learn step-by-step video tutorials