In today’s fast-changing film industry, independent filmmakers face constant challenges. From managing production budgets to tracking marketing spend and analyzing box office performance, everything requires careful monitoring. Independent Filmmaking Dashboard in Power BI However, when this data remains scattered across spreadsheets, decision-making becomes difficult and slow.
So, how can filmmakers track costs, measure profitability, and optimize performance in real time?
👉 The answer is the Independent Filmmaking Dashboard in Power BI.
This powerful and interactive dashboard helps filmmakers, producers, and studios visualize financial data, monitor KPIs, and make smarter decisions. Moreover, it converts complex film data into clear and actionable insights. Therefore, you can focus on creating impactful content while staying financially efficient.
In this complete guide, you will learn everything about this dashboard, including features, advantages, best practices, and frequently asked questions.
Click to Purchases Independent Filmmaking Dashboard in Power BI
📊 What is an Independent Filmmaking Dashboard in Power BI?
An Independent Filmmaking Dashboard in Power BI is a data visualization and analytics tool designed to monitor and analyze key metrics related to film production and distribution.
Instead of manually analyzing reports, you can:
- 🎯 Track production and marketing costs
- 💰 Monitor revenue and profitability
- 📈 Analyze ROI across films and channels
- 🌍 Evaluate regional box office performance
As a result, filmmakers can make faster, data-driven decisions and improve project outcomes.
❓ Why Do Independent Filmmakers Need a Dashboard?
Independent filmmaking involves limited budgets and high risks. Therefore, tracking every dollar becomes crucial.
Without a dashboard:
- Budget overruns happen frequently
- Revenue insights remain unclear
- ROI becomes difficult to calculate
However, with a Power BI dashboard:
- You gain complete financial visibility
- You identify profitable strategies quickly
- You improve resource allocation effectively
👉 In short, it helps you turn creativity into profitability.
🧩 Key Features of Independent Filmmaking Dashboard in Power BI
This dashboard includes 5 powerful analytical pages, each designed to provide deep insights.
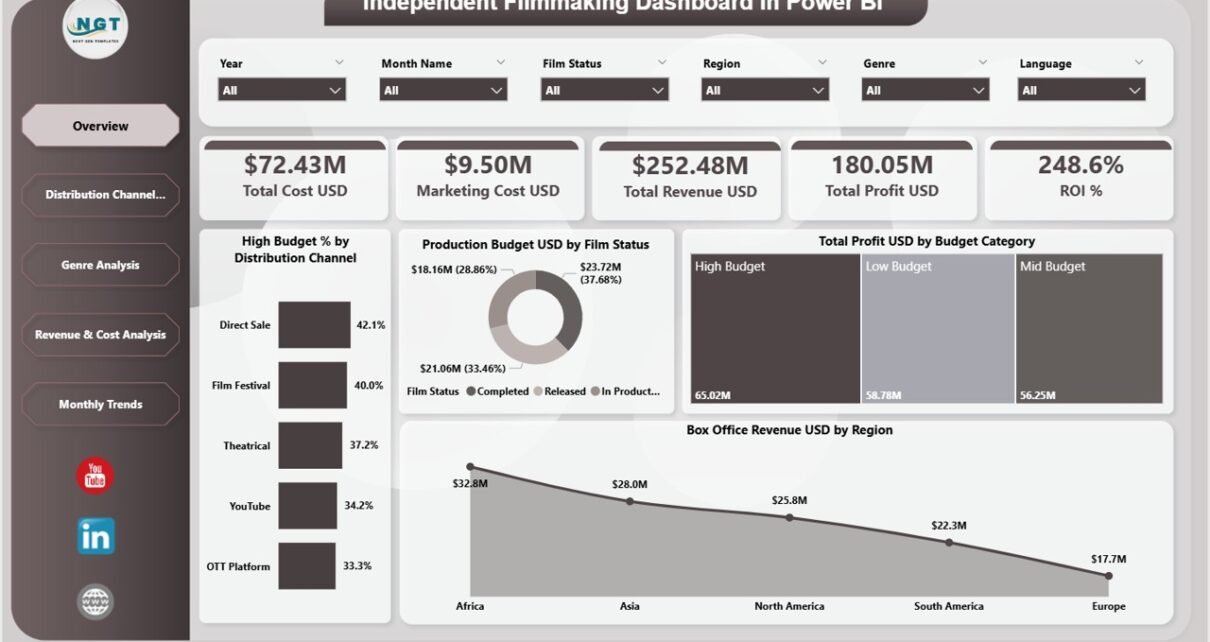
🏠 1. Overview Page – Get a Complete Financial Snapshot
The Overview Page gives you a quick summary of your filmmaking performance.
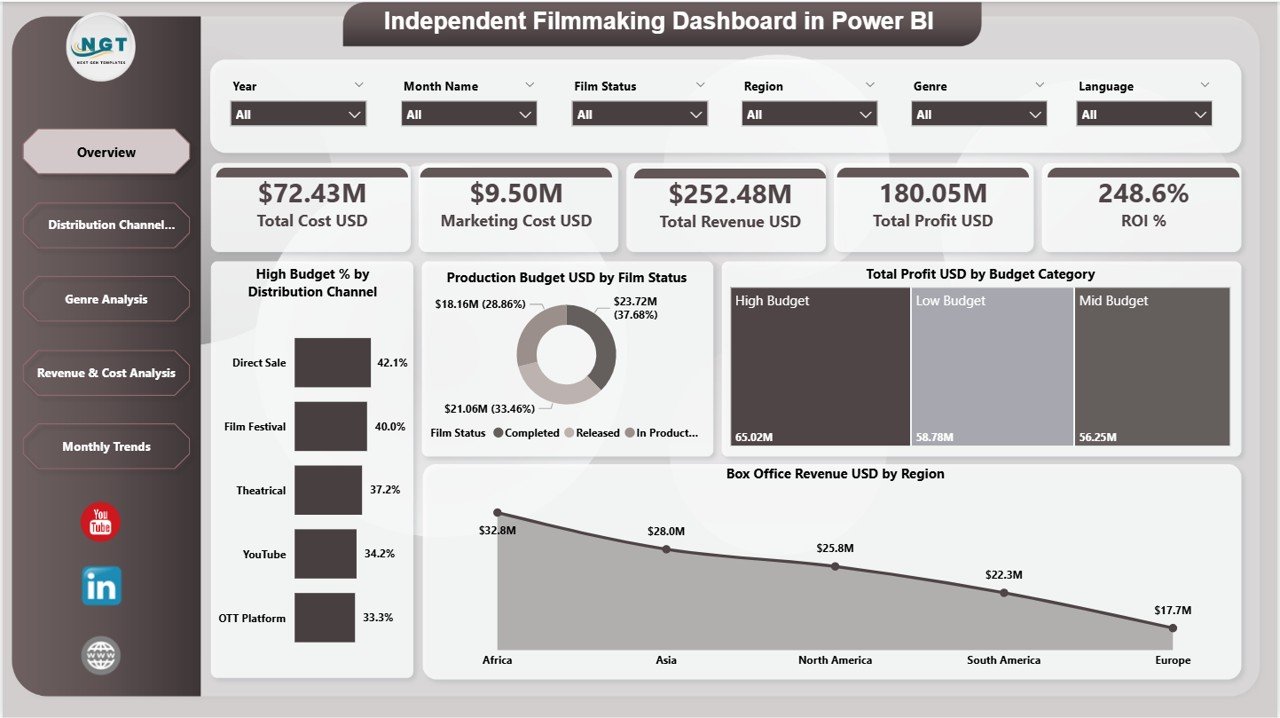
🔑 KPI Cards:
- Total Cost (USD)
- Marketing Cost (USD)
- Total Revenue (USD)
- Total Profit (USD)
- ROI (%)
📊 Charts Included:
- High Budget % by Distribution Channel
- Production Budget USD by Film Status
- Total Profit USD by Budget Category
- Box Office Revenue USD by Region
👉 Therefore, you can instantly understand the financial health of your film projects.
📺 2. Distribution Channel Analysis – Optimize Release Strategy
This page focuses on how different distribution channels perform.
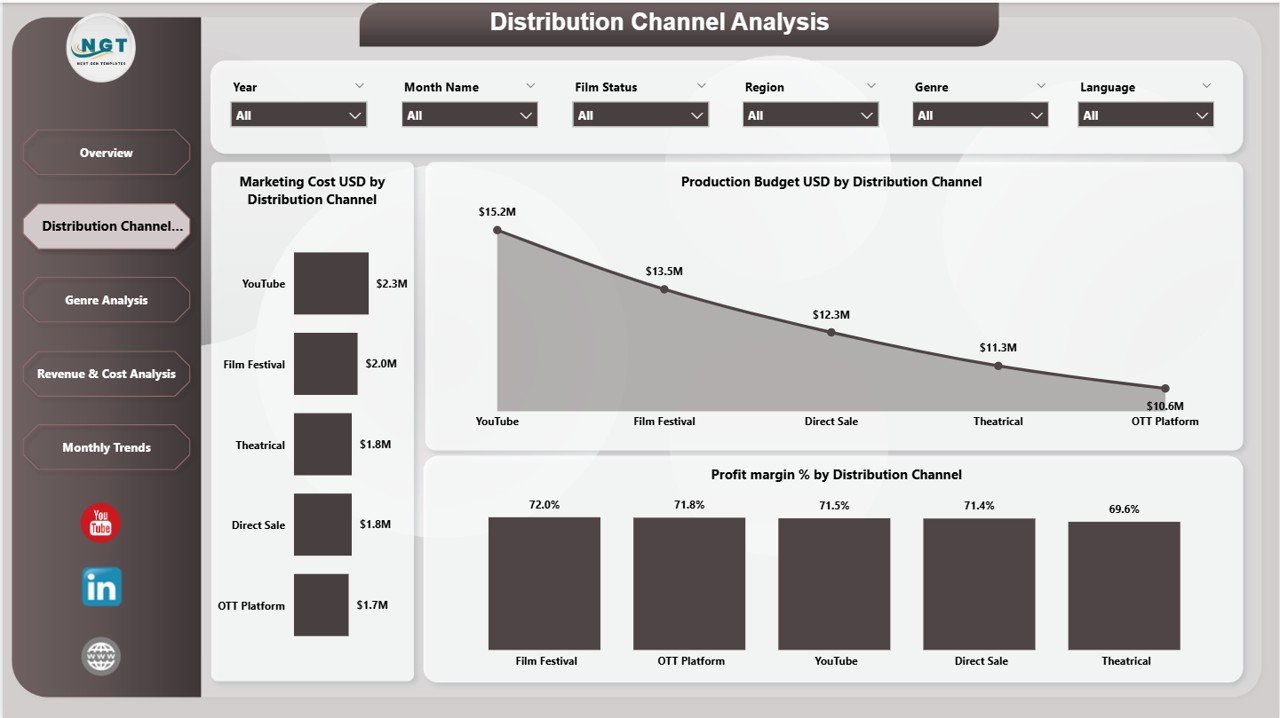
📊 Charts Included:
- Marketing Cost USD by Distribution Channel
- Production Budget USD by Distribution Channel
- Profit Margin % by Distribution Channel
👉 As a result, you can identify which channels generate the highest returns.
🎭 3. Genre Analysis – Discover Audience Preferences
Understanding genres helps filmmakers create successful projects.
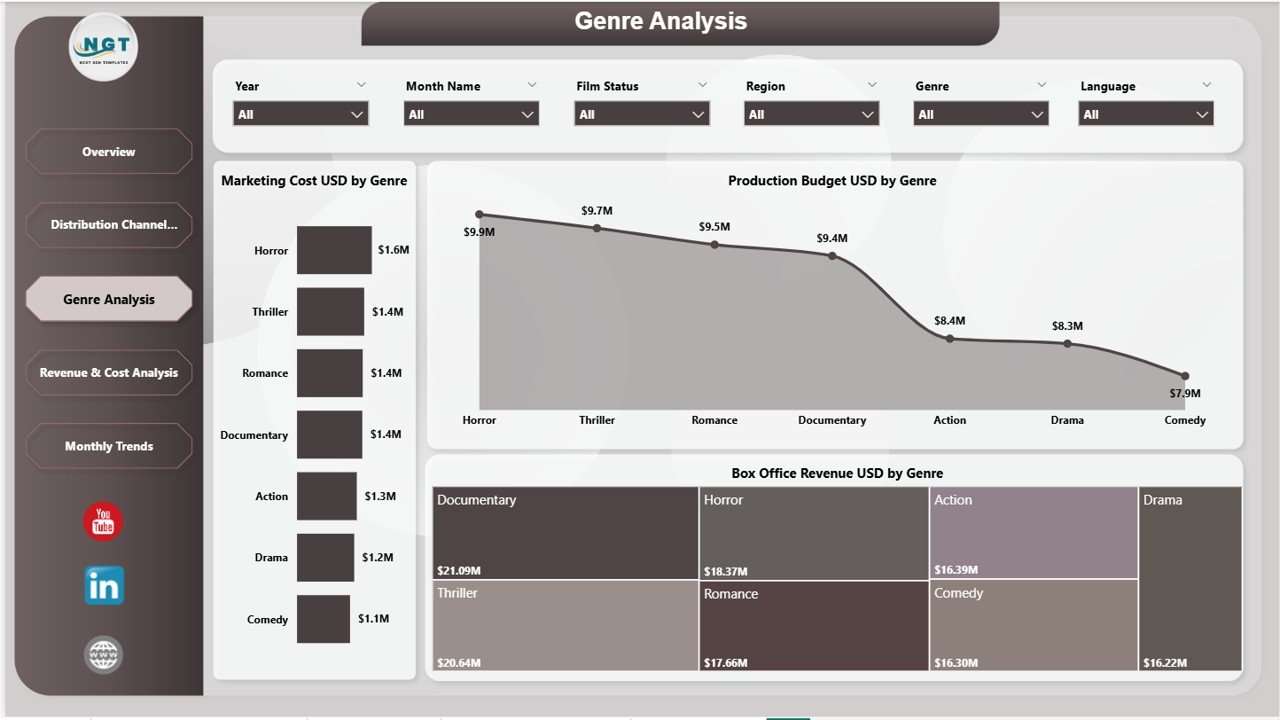
📊 Charts Included:
- Marketing Cost USD by Genre
- Production Budget USD by Genre
- Box Office Revenue USD by Genre
👉 Therefore, you can focus on genres that deliver better performance.
💰 4. Revenue & Cost Analysis – Balance Profitability
This page helps you analyze revenue streams and costs in detail.
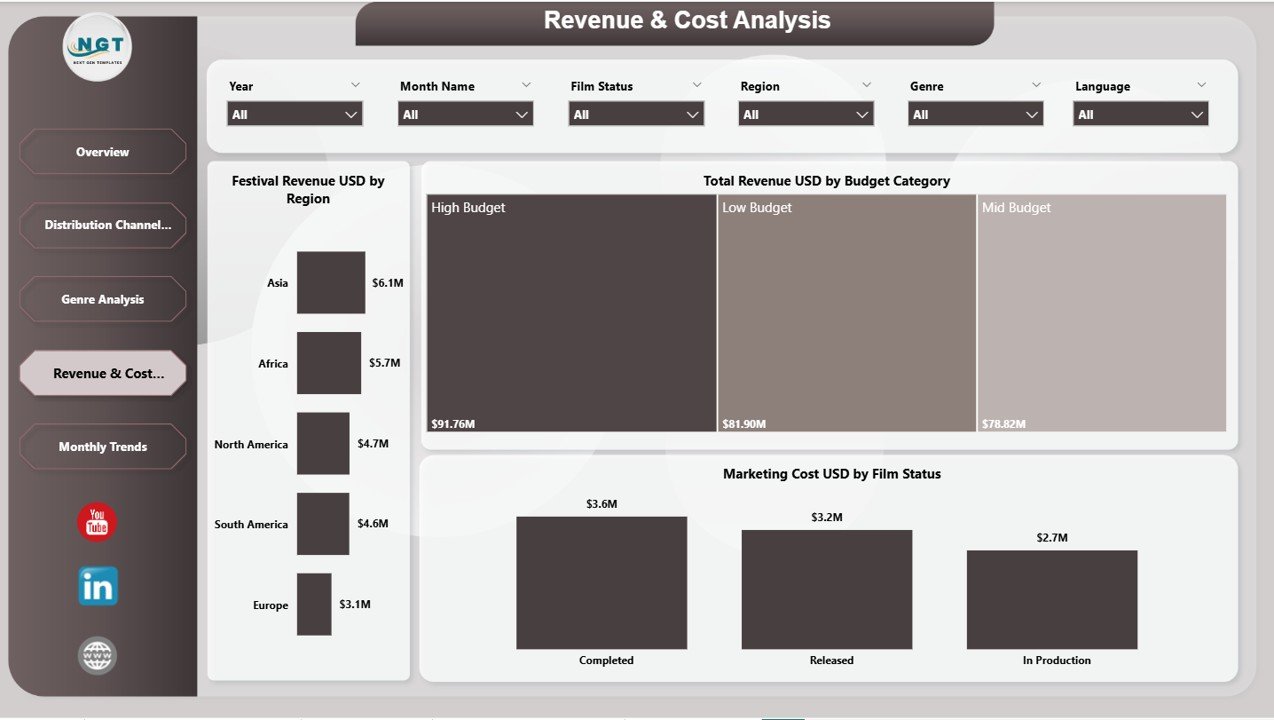
📊 Charts Included:
- Festival Revenue USD by Region
- Total Revenue USD by Budget Category
- Marketing Cost USD by Film Status
👉 Consequently, you can manage costs and maximize profits effectively.
📅 5. Monthly Trends – Track Performance Over Time
The Monthly Trends Page helps you analyze growth patterns.
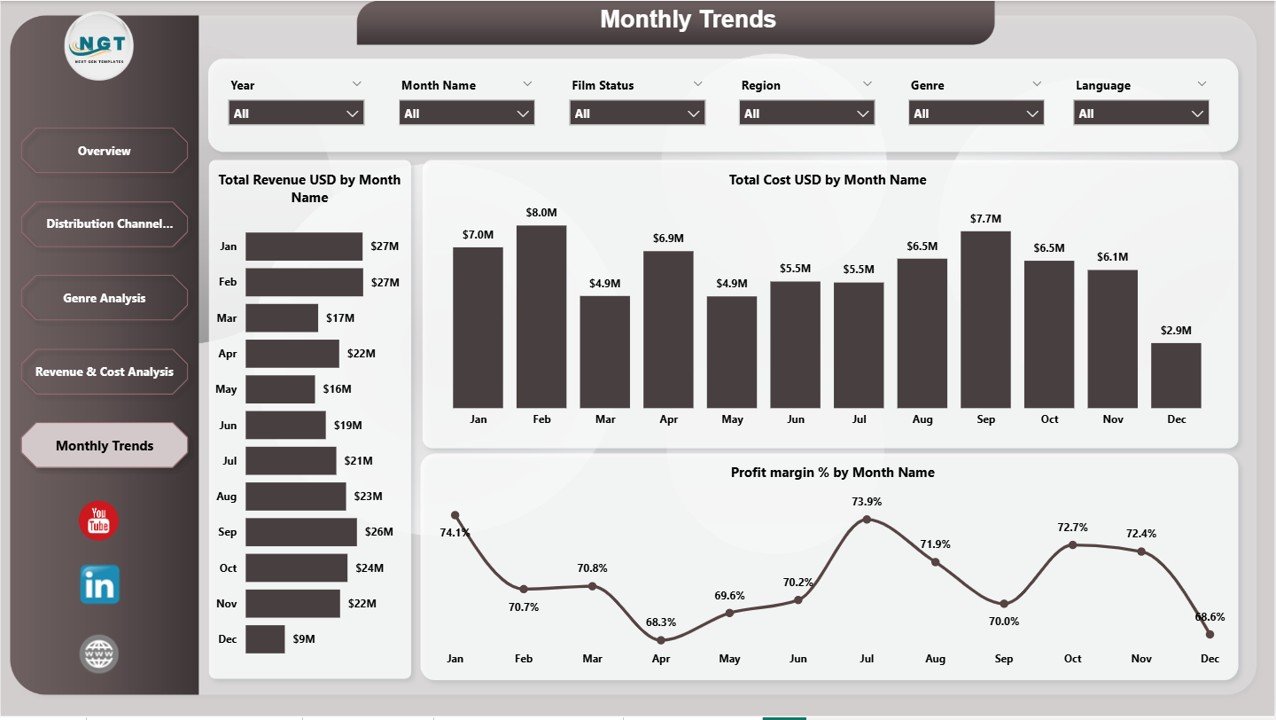
📈 Charts Included:
- Total Revenue USD by Month Name
- Total Cost USD by Month Name
- Profit Margin % by Month Name
👉 Therefore, you can plan future projects based on trends.
🌟 Advantages of Independent Filmmaking Dashboard in Power BI
Using this dashboard offers several powerful benefits.
✅ 1. Real-Time Financial Insights
You can monitor costs, revenue, and profit instantly.
✅ 2. Better Budget Control
You can track expenses and avoid overspending.
✅ 3. Improved ROI Analysis
You can measure return on investment across projects and channels.
✅ 4. Data-Driven Decision Making
Visual insights help you make smarter production and marketing decisions.
✅ 5. Enhanced Performance Tracking
You can evaluate film success by genre, region, and distribution channel.
✅ 6. Centralized Data Management
All your filmmaking data stays organized in one place.
🚀 How to Use the Independent Filmmaking Dashboard?
Using this dashboard is simple and efficient.
Step 1: Import Your Data
Upload production, marketing, and revenue data into Power BI.
Step 2: Connect Data Sources
Ensure all datasets link properly for accurate analysis.
Step 3: Use Slicers (Filters)
Select film status, genre, or region to customize insights.
Step 4: Analyze KPI Cards
Review key financial indicators quickly.
Step 5: Explore Detailed Pages
Dive deeper into distribution, genre, and revenue analysis.
Step 6: Identify Trends
Use monthly insights to improve future projects.
👉 As a result, you can transform raw data into powerful decisions.
📈 Best Practices for the Independent Filmmaking Dashboard
To get maximum value, follow these best practices:
🔹 Keep Data Updated
Always refresh your data regularly.
🔹 Maintain Clean Data Structure
Organized data improves accuracy and performance.
🔹 Focus on Key Metrics
Track only essential KPIs like ROI, cost, and revenue.
🔹 Customize Dashboard Views
Adjust visuals based on project needs.
🔹 Monitor Trends Frequently
Regular analysis helps you stay ahead.
🔹 Train Your Team
Ensure everyone understands how to use the dashboard.
⚠️ Common Challenges and Solutions
Even though dashboards are powerful, users may face some issues.
🚫 Data Inaccuracy
👉 Solution: Use validated and consistent data sources
🚫 Overcomplicated Reports
👉 Solution: Keep visuals simple and focused
🚫 Slow Performance
👉 Solution: Optimize data models and reduce unnecessary fields
🚫 Lack of Insights
👉 Solution: Focus on actionable KPIs
💡 How This Dashboard Helps Increase Profitability
This dashboard directly improves financial performance.
💰 Identify Profitable Films
You can focus on projects with high ROI.
🎯 Optimize Marketing Spend
You can allocate budget to high-performing channels.
📊 Improve Distribution Strategy
You can select channels that generate more revenue.
🎬 Focus on Successful Genres
You can produce films that audiences prefer.
👉 Therefore, you can maximize profits while minimizing risks.
🔮 Future of Film Analytics with Power BI
The filmmaking industry continues to evolve with data and technology.
In the future:
- AI will predict box office success
- Real-time analytics will become standard
- Data-driven filmmaking will dominate
👉 Therefore, adopting dashboards today gives you a strong competitive advantage.
🏁 Conclusion
The Independent Filmmaking Dashboard in Power BI is a must-have tool for filmmakers and production teams. It helps you track costs, analyze revenue, and improve decision-making—all in one place.
Moreover, it simplifies complex data into easy visuals. Therefore, you can focus on storytelling while ensuring financial success.
👉 If you want to improve efficiency, reduce risks, and maximize ROI, this dashboard is your perfect solution.
Click to Purchases Independent Filmmaking Dashboard in Power BI
❓ Frequently Asked Questions (FAQs)
1. What is ROI in filmmaking?
ROI (Return on Investment) measures the profitability of a film compared to its cost.
2. Can I customize this dashboard?
Yes, you can modify KPIs, charts, and filters based on your needs.
3. Is Power BI required to use this dashboard?
Yes, you need Power BI Desktop or Service to use the dashboard.
4. How often should I update the data?
You should update it regularly, preferably weekly or monthly.
5. Can this dashboard track multiple films?
Yes, it supports analysis across multiple film projects.
6. Does it help in budget planning?
Yes, it provides insights that help control costs and plan budgets effectively.
7. Can beginners use this dashboard?
Yes, it is user-friendly and easy to understand.
8. What industries can benefit from this dashboard?
Film production, media companies, OTT platforms, and entertainment businesses.
Click to Purchases Independent Filmmaking Dashboard in Power BI
Visit our YouTube channel to learn step-by-step video tutorials