Home>Blogs>Charts and Visualization>Info-graphics with Column chart (Part-2)>Info-graphics with Column chart (Part-2) – 5
Info-graphics with Column chart (Part-2) – 5
15
Aug 2018
1530
PK
Meet PK, the founder of PK-AnExcelExpert.com! With over 15 years of experience in Data Visualization, Excel Automation, and dashboard creation. PK is a Microsoft Certified Professional who has a passion for all things in Excel. PK loves to explore new and innovative ways to use Excel and is always eager to share his knowledge with others. With an eye for detail and a commitment to excellence, PK has become a go-to expert in the world of Excel. Whether you're looking to create stunning visualizations or streamline your workflow with automation, PK has the skills and expertise to help you succeed. Join the many satisfied clients who have benefited from PK's services and see how he can take your Excel skills to the next level!
https://www.pk-anexcelexpert.com
Related Articles
Railway KPI Dashboard in Excel
The Railway KPI Dashboard is an essential tool for monitoring and analyzing the key performance indicators (KPIs) of railway operations.
Automotive Parts Manufacturing KPI Dashboard in Excel
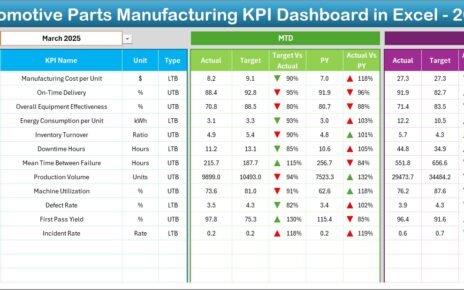
The automotive parts manufacturing industry operates in a highly competitive and precision-driven environment. Manufacturers must manage production efficiency, quality standards,
Nonprofit Organizations Dashboard in Power BI
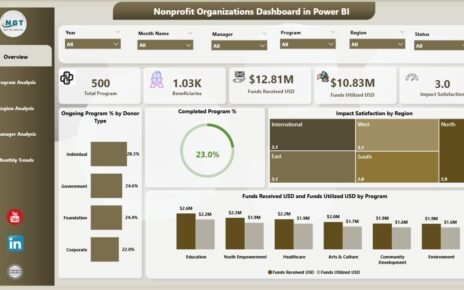
Running a nonprofit organization demands vision, compassion, and measurable impact. However, managing multiple projects, tracking donors, and evaluating program effectiveness


